Drowsiness Monitoring System Market Size 2024-2028
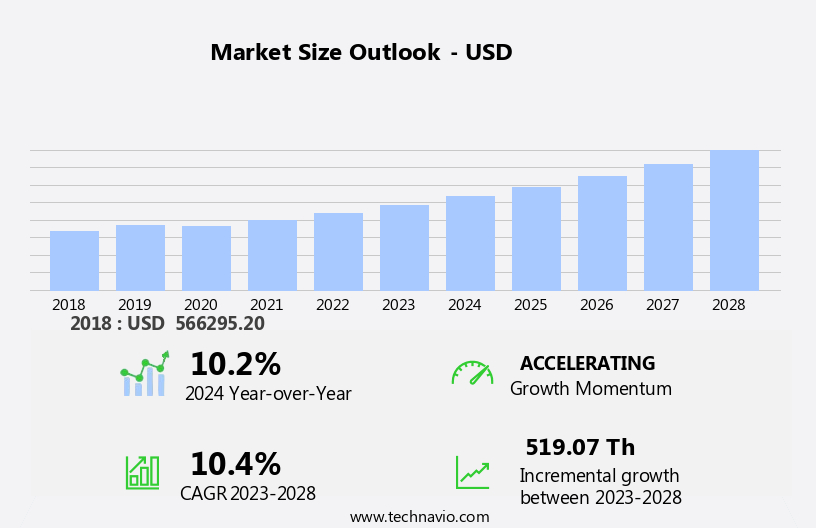
The drowsiness monitoring system market size is forecast to increase by USD 519.07 thousand at a CAGR of 10.4% between 2023 and 2028.
- The market is witnessing significant growth due to escalating concerns about road safety. As per reports, drowsiness is a leading cause of road accidents, making it essential for automakers to integrate drowsiness monitoring systems in vehicles. Furthermore, there is an increasing emphasis by companies on launching new products to cater to the growing demand for advanced driver assistance systems (ADAS) that include drowsiness monitoring features. However, the high likelihood of generating false alarms remains a major challenge for market growth. To mitigate this issue, companies are investing in advanced technologies such as machine learning algorithms and biometric sensors to improve system accuracy. Additionally, the integration of these systems with infotainment displays and smartphone applications is expected to enhance user experience and increase market penetration.
What will be the Size of the Drowsiness Monitoring System Market During the Forecast Period?
- The market In the US is experiencing significant growth due to increasing road safety awareness and the escalating number of traffic accidents caused by driver fatigue. Safety measures, such as public awareness campaigns and automotive technology, are prioritized to mitigate the risks of drowsiness-related accidents. Driver assistance systems, incorporating artificial intelligence and machine learning, are increasingly being integrated into vehicles. Sensor technologies, including cameras, eye movements, steering patterns, and vehicle position, are utilized for real-time monitoring.
- Electric and autonomous vehicles also adopt these advanced systems to ensure vehicle safety. Timely warnings for tiredness detection, distraction detection, and accident prevention are crucial components of these systems. Corporate fleet management and commercial vehicle operations also benefit from driver monitoring technology to maintain road safety and efficiency. Sophisticated sensors, algorithms, and vehicle safety systems continue to evolve, incorporating facial recognition and other advanced techniques to enhance driver awareness and overall safety.
How is this Drowsiness Monitoring System Industry segmented and which is the largest segment?
The drowsiness monitoring system industry research report provides comprehensive data (region-wise segment analysis), with forecasts and estimates in "USD thousand" for the period 2024-2028, as well as historical data from 2018-2022 for the following segments.
- Type
- Hardware devices
- Software systems
- Application
- Passenger vehicles
- Commercial vehicles
- Geography
- North America
- US
- Europe
- Germany
- France
- APAC
- China
- Japan
- Middle East and Africa
- South America
- North America
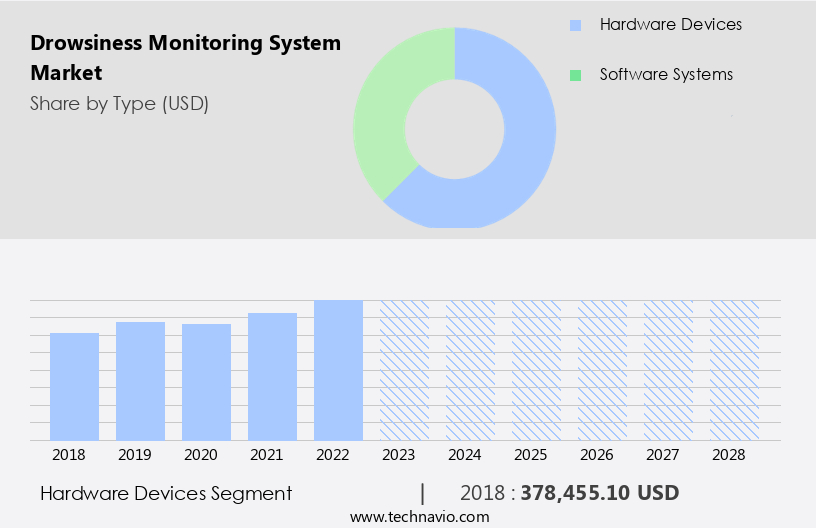
By Type Insights
- The hardware devices segment is estimated to witness significant growth during the forecast period.
The global market for drowsiness monitoring systems is experiencing notable growth, particularly In the hardware devices segment. This segment includes physical components installed in vehicles to detect driver fatigue and promote road safety. Bosch, a leading market player, offers a comprehensive driver drowsiness detection system utilizing advanced camera and radar technologies for interior sensing. Compliant with EU General Safety Regulation (GSR) and NCAP consumer tests, this system ensures adherence to safety standards. Monitoring driver attentiveness and detecting signs of drowsiness, it prompts timely breaks, enhancing road safety. As of July 2024, the EU mandates the implementation of such systems in all new vehicles, contributing significantly to accident prevention and enabling various assisted driving functions.
Get a glance at the Drowsiness Monitoring System Industry report of share of various segments Request Free Sample
The Hardware devices segment was valued at USD 378.46 thousand in 2018 and showed a gradual increase during the forecast period.
Regional Analysis
- North America is estimated to contribute 35% to the growth of the global market during the forecast period.
Technavio's analysts have elaborately explained the regional trends and drivers that shape the market during the forecast period.

For more insights on the market share of various regions, Request Free Sample
The North American market for drowsiness monitoring systems is witnessing substantial growth due to the escalating concern over drowsy driving-related traffic accidents. In the US, the American Automobile Association (AAA) Foundation for Traffic Safety reports that drowsiness contributes to around 328,000 motor vehicle accidents and 6,400 fatal crashes annually. In Canada, the issue is equally pressing, with 1,931 motor vehicle fatalities recorded in 2022, marking a 6.0% increase from the previous year and the second-highest figure In the past decade. To mitigate this risk, there is a pressing need for effective fatigue management solutions. These systems, which leverage automotive technology, driver assistance systems, artificial intelligence, machine learning, and sensor technologies, enable real-time monitoring and intervention to prevent drowsy driving. Enhancing road safety and reducing the number of accidents is the primary objective of these advanced systems.
Market Dynamics
Our drowsiness monitoring system market researchers analyzed the data with 2023 as the base year, along with the key drivers, trends, and challenges. A holistic analysis of drivers will help companies refine their marketing strategies to gain a competitive advantage.
What are the key market drivers leading to the rise In the adoption of the Drowsiness Monitoring System Industry?
Escalating concerns about road safety is the key driver of the market.
- The market is gaining traction due to increasing road safety awareness and the alarming number of traffic accidents caused by drowsy driving. Drowsiness, characterized by difficulty staying awake, can significantly impair brain functions, including reaction times and decision-making abilities. Sleep deprivation, whether due to insufficient sleep or sleep disorders, is a major contributor to these accidents. According to the National Highway Traffic Safety Administration, drowsiness-related accidents accounted for approximately 72,000 crashes, 44,000 injuries, and 800 fatalities In the United States alone in 2013. To mitigate these risks, automotive technology companies are developing advanced Driver Assistance Systems (ADAS) that incorporate Drowsiness Monitoring Systems (DMS).
- These systems utilize sophisticated sensors, such as infrared sensors, steering angle sensors, and vehicle speed sensors, to monitor driver behavior and alert them of potential drowsiness. Machine learning and artificial intelligence algorithms analyze real-time data from these sensors to detect physiological indicators, such as eye movements and steering patterns, and provide timely warnings to prevent accidents. Moreover, the integration of multi-modal detection systems, including facial recognition and eye-tracking, further enhances the accuracy of these systems. The market for Drowsiness Monitoring Systems is not limited to passenger cars but also includes commercial vehicles, electric vehicles, and autonomous vehicles. Fleet management solutions are also adopting these systems to ensure the safety of their drivers and prevent accidents, resulting in significant cost savings and improved public health.
What are the market trends shaping the Drowsiness Monitoring System Industry?
Increasing emphasis by companies on launching new products is the upcoming market trend.
- The market is experiencing notable growth due to increasing Road Safety Awareness and the implementation of stringent regulations. Traffic Accidents caused by drowsiness are a significant concern, leading to the development and integration of advanced Driver Assistance Systems (ADAS) in passenger cars. Automotive Technology companies are investing in Artificial Intelligence (AI) and Machine Learning (ML) to enhance DMS capabilities. These systems utilize sophisticated sensors, including infrared sensors, steering angle sensors, and vehicle speed sensors, for real-time monitoring. Key companies, such as Great Wall Motor, are integrating multi-modal detection systems with facial recognition, eye-tracking, and biometric sensors to prevent drowsiness-related accidents.
- Public Awareness Campaigns aim to educate the public on the importance of preventing distracted driving, and fleet management solutions are increasingly adopting these technologies for commercial vehicle operations. The Guardian Generation 3, unveiled by computer vision technology leader Seeing Machines, is a prime example of these advancements. This aftermarket DMS has been independently verified to meet European Commission safety regulations and boasts enhanced microsleep detection and eye-gaze tracking capabilities. By providing timely warnings, these systems contribute to accident prevention and overall vehicle safety.
What challenges does the Drowsiness Monitoring System Industry face during its growth?
The high likelihood of generating false alarms is a key challenge affecting the industry growth.
- The market is gaining traction In the automotive industry due to the increasing focus on Road Safety Awareness and the prevalence of Traffic Accidents caused by drowsy driving. Safety Measures, such as Driver Assistance Systems and Public Awareness Campaigns, are being implemented to mitigate the risks associated with drowsiness-related accidents. Automotive Technology advancements, including Artificial Intelligence and Machine Learning, are being integrated into DMS to enhance real-time monitoring capabilities. Electric Vehicles and autonomous vehicles are also adopting Drowsiness Detection Technologies to prevent accidents and ensure vehicle safety. Fleet Management Solutions are utilizing sophisticated sensors, algorithms, and multi-modal detection systems for real-time monitoring and timely alerts.
- Image Processing technologies, such as Facial Recognition, Eye-Tracking, and Biometric Sensors, are being used to accurately assess driver states. However, the market faces challenges, including the generation of false alarms, which can annoy or distract drivers and compromise road safety. Reliable capture of facial and eye features is a key technical challenge, as external conditions such as bright lights, sudden movements, or changes in posture can trigger false alarms. Integration of these systems into vehicles and fleet management solutions is essential to ensure accurate and effective drowsiness monitoring.
Exclusive Customer Landscape
The drowsiness monitoring system market forecasting report includes the adoption lifecycle of the market, covering from the innovator's stage to the laggard's stage. It focuses on adoption rates in different regions based on penetration. Furthermore, the drowsiness monitoring system market report also includes key purchase criteria and drivers of price sensitivity to help companies evaluate and develop their market growth analysis strategies.

Customer Landscape
Key Companies & Market Insights
Companies are implementing various strategies, such as strategic alliances, drowsiness monitoring system market forecast, partnerships, mergers and acquisitions, geographical expansion, and product/service launches, to enhance their presence In the industry.
The industry research and growth report includes detailed analyses of the competitive landscape of the market and information about key companies, including:
- AISIN CORP.
- Aptiv Plc
- Continental Engineering Services
- DENSO Corp.
- Faststream Technologies
- Harman International Industries Inc.
- HELLA GmbH and Co. KGaA
- Infineon Technologies AG
- Magna International Inc.
- Mitsubishi Electric Corp.
- NVIDIA Corp.
- OMRON Corp.
- Optalert Australia Pty Ltd
- Panasonic Holdings Corp.
- Robert Bosch GmbH
- Seeing Machines Ltd
- Smart Eye AB
- Tobii AB
- Valeo SA
- Visteon Corp.
Qualitative and quantitative analysis of companies has been conducted to help clients understand the wider business environment as well as the strengths and weaknesses of key industry players. Data is qualitatively analyzed to categorize companies as pure play, category-focused, industry-focused, and diversified; it is quantitatively analyzed to categorize companies as dominant, leading, strong, tentative, and weak.
Research Analyst Overview
The global automotive industry is witnessing a significant shift towards advanced safety technologies, with drowsiness monitoring systems (DMS) gaining increasing attention. These systems are designed to detect and prevent drowsiness-related accidents, a major contributor to road safety concerns worldwide. Drowsiness monitoring systems employ sophisticated sensors, artificial intelligence (AI), and machine learning algorithms to analyze various physiological indicators and driving patterns. These indicators may include eye movements, steering patterns, vehicle position, and other relevant data points. The integration of DMS in both passenger cars and commercial vehicles is a crucial step towards enhancing road safety.
Moreover, the technology is particularly beneficial for long-haul commercial vehicle operations, where drivers are at a higher risk of experiencing fatigue. By providing timely warnings, DMS can help prevent accidents caused by driver distraction or drowsiness. The automotive industry's adoption of drowsiness monitoring systems is driven by several factors. The increasing awareness of road safety and the rising number of traffic accidents due to driver fatigue are primary motivators. Furthermore, governments and regulatory bodies are implementing stricter safety standards, mandating the inclusion of DMS in vehicles. Advanced algorithms and multi-modal detection systems are essential components of DMS. These systems can analyze data from various sensors, including infrared sensors, steering angle sensors, and vehicle speed sensors, to detect drowsiness accurately.
Furthermore, facial recognition and eye-tracking technologies are also being integrated into DMS to improve detection efficiency. Despite their benefits, DMS faces challenges such as false alarms and integration with existing vehicle safety systems. Addressing these challenges is crucial for the widespread adoption of drowsiness monitoring systems. The transportation and logistics sectors are significant consumers of DMS, with fleet management solutions playing a pivotal role In their implementation. Electric vehicles and autonomous vehicles are also adopting drowsiness monitoring systems to ensure vehicle safety and passenger comfort. The integration of AI, machine learning, and advanced sensors is driving innovation in this field, paving the way for a safer and more efficient transportation future.
|
Drowsiness Monitoring System Market Scope |
|
|
Report Coverage |
Details |
|
Page number |
206 |
|
Base year |
2023 |
|
Historic period |
2018-2022 |
|
Forecast period |
2024-2028 |
|
Growth momentum & CAGR |
Accelerate at a CAGR of 10.4% |
|
Market Growth 2024-2028 |
USD 519.07 thousand |
|
Market structure |
Fragmented |
|
YoY growth 2023-2024(%) |
10.2 |
|
Key countries |
US, Germany, China, France, and Japan |
|
Competitive landscape |
Leading Companies, Market Positioning of Companies, Competitive Strategies, and Industry Risks |
What are the Key Data Covered in this Drowsiness Monitoring System Market Research and Growth Report?
- CAGR of the Drowsiness Monitoring System industry during the forecast period
- Detailed information on factors that will drive the Drowsiness Monitoring System growth and forecasting between 2024 and 2028
- Precise estimation of the size of the market and its contribution of the industry in focus to the parent market
- Accurate predictions about upcoming growth and trends and changes in consumer behaviour
- Growth of the market across North America, Europe, APAC, Middle East and Africa, and South America
- Thorough analysis of the market's competitive landscape and detailed information about companies
- Comprehensive analysis of factors that will challenge the drowsiness monitoring system market growth of industry companies
We can help! Our analysts can customize this drowsiness monitoring system market research report to meet your requirements.
 RIA -
RIA - 
