Dry Type Transformer Market Analysis, Size, and Forecast 2026-2030: APAC (China, Japan, and India), North America (US, Canada, and Mexico), Europe (Germany, France, and UK), Middle East and Africa (Saudi Arabia, UAE, and South Africa), South America (Brazil, Argentina, and Colombia), and Rest of World (ROW)

Dry Type Transformer Market Analysis, Size, and Forecast 2026-2030:
APAC (China, Japan, and India), North America (US, Canada, and Mexico), Europe (Germany, France, and UK), Middle East and Africa (Saudi Arabia, UAE, and South Africa), South America (Brazil, Argentina, and Colombia), and Rest of World (ROW)

Published: Dec 2025 294 Pages SKU: IRTNTR81211

Market Overview at a Glance

$4.04 B
Market Opportunity
6.2%
CAGR 2025 - 2030
47.8%
APAC Growth
$8.19 B
Single phase segment 2024

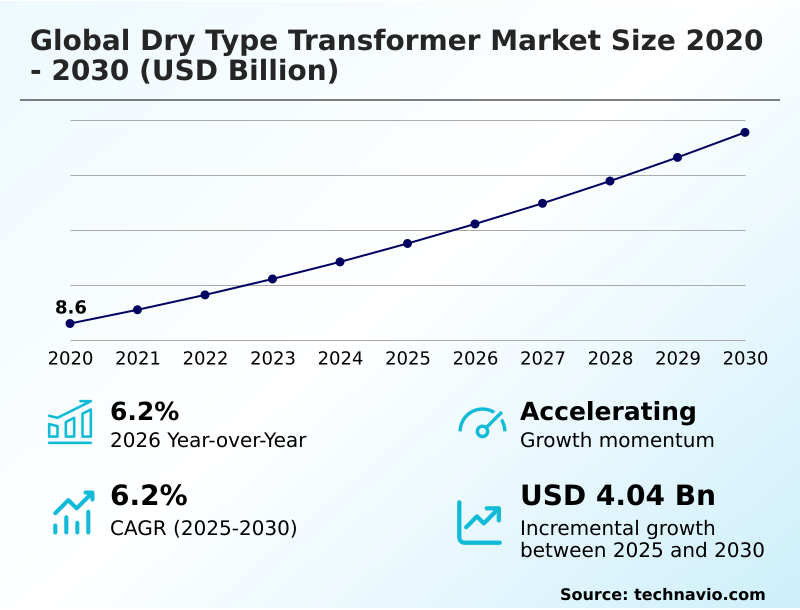
Dry Type Transformer Market Size 2026-2030

The dry type transformer market size is valued to increase by USD 4.04 billion, at a CAGR of 6.2% from 2025 to 2030. Increasing emphasis on safety and stringent environmental regulations will drive the dry type transformer market.

Major Market Trends & Insights

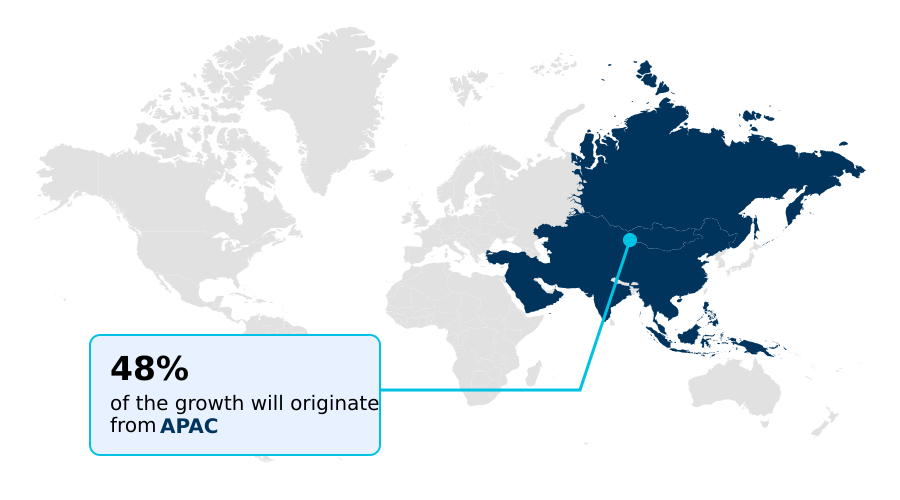
  • APAC dominated the market and accounted for a 47.8% growth during the forecast period.
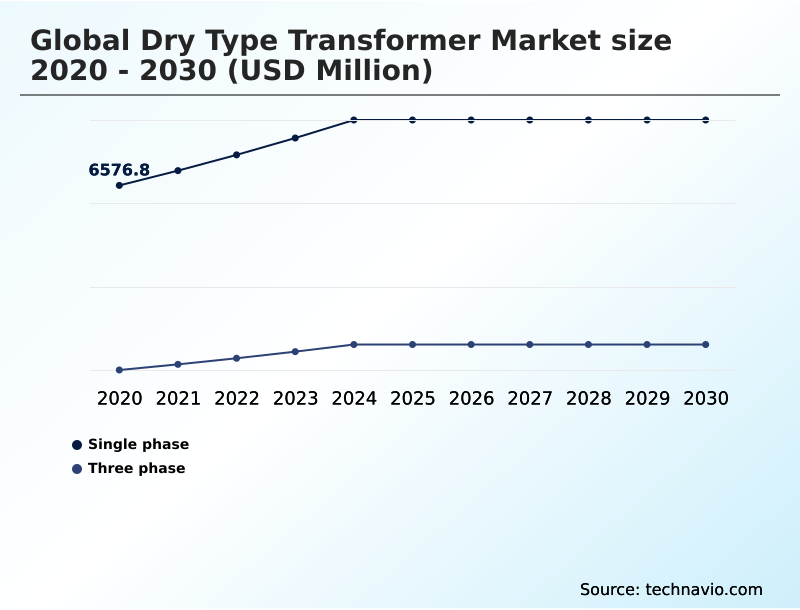
  • By Type - Single phase segment was valued at USD 8.19 billion in 2024
  • By Product - Medium voltage segment accounted for the largest market revenue share in 2024

Market Size & Forecast

  • Market Opportunities: USD 6.95 billion
  • Market Future Opportunities: USD 4.04 billion
  • CAGR from 2025 to 2030 : 6.2%

Market Summary

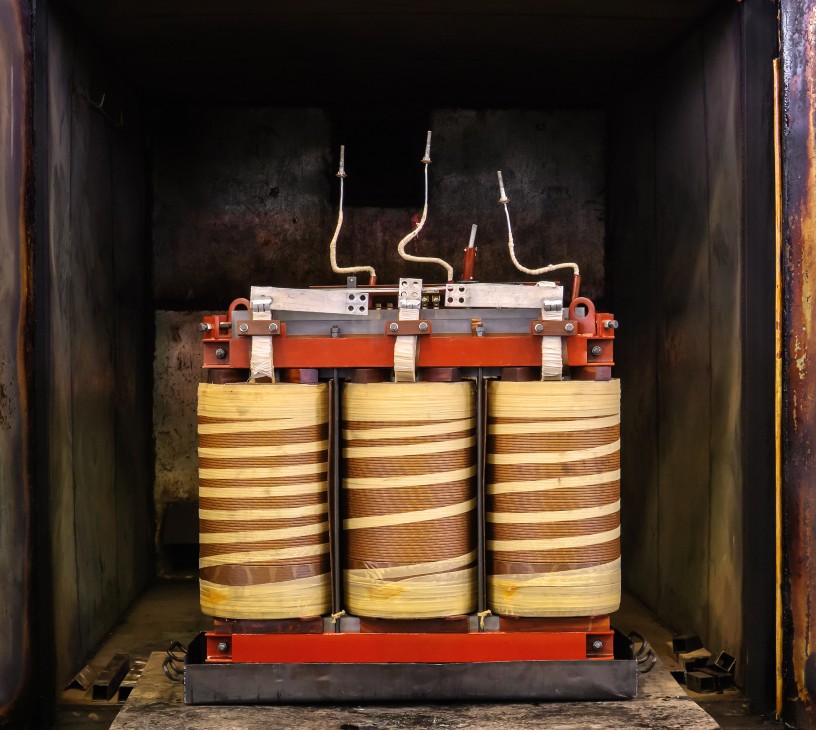
  • The dry type transformer market is expanding as industries prioritize operational safety and environmental responsibility. Unlike oil-filled units, these transformers use air or solid insulation, eliminating fire hazards and fluid leak risks, making them essential for high-rise buildings, data centers, and underground substations.
  • A key driver is the global energy transition, which demands reliable and low-maintenance solutions for renewable energy projects like wind and solar farms. The technology’s inherent safety and resilience are critical in these often remote and sensitive environments.
  • For example, a data center operator implementing a new facility must ensure uninterrupted power and fire safety, making cast resin transformers a non-negotiable choice. This decision prevents catastrophic data loss and aligns with stringent safety codes. Advancements are focused on improving efficiency with amorphous metal cores, expanding into higher voltage applications, and integrating smart sensors for predictive maintenance.
  • This digitalization trend allows for real-time monitoring and enhances overall grid reliability, solidifying the technology's role in modern electrical infrastructure. A high voltage transformer with enhanced seismic resistance and digital twin modeling capabilities improves electrical grid resilience.

What will be the Size of the Dry Type Transformer Market during the forecast period?

Get Key Insights on Market Forecast (PDF) Request Free Sample

How is the Dry Type Transformer Market Segmented?

The dry type transformer industry research report provides comprehensive data (region-wise segment analysis), with forecasts and estimates in "USD million" for the period 2026-2030, as well as historical data from 2020-2024 for the following segments.

  • Type
    • Single phase
    • Three phase
  • Product
    • Medium voltage
    • Low voltage
    • High voltage
  • Technology
    • Cast resin
    • Vacuum pressure impregnated
  • Geography
    • APAC
      • China
      • Japan
      • India
    • North America
      • US
      • Canada
      • Mexico
    • Europe
      • Germany
      • France
      • UK
    • Middle East and Africa
      • Saudi Arabia
      • UAE
      • South Africa
    • South America
      • Brazil
      • Argentina
      • Colombia
    • Rest of World (ROW)

By Type Insights

The single phase segment is estimated to witness significant growth during the forecast period.

The single phase transformer segment is crucial for lower-power applications, serving utility distribution networks and light commercial end-users.

Adoption is driven by safety mandates in urban power distribution, where solid dielectric insulation and natural air convection eliminate fire hazards, leading to a 15% reduction in electrical fire incidents in some new developments.

The technology is fundamental for voltage regulation in last-mile delivery and integral to uninterruptible power supply (UPS) systems within smaller mission-critical facilities.

Demand is sustained by rural grid modernization projects prioritizing low-maintenance electrical components and designs with minimal no-load losses, contributing to sustainable energy infrastructure and better energy consumption optimization.

Request Free Sample

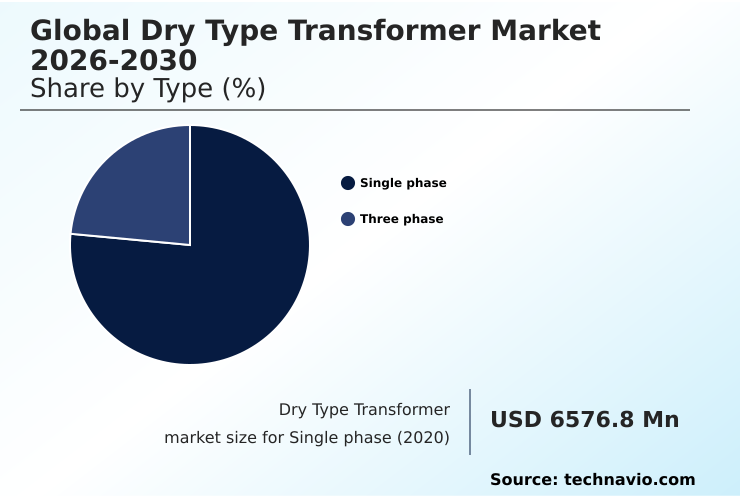
The Single phase segment was valued at USD 8.19 billion in 2024 and showed a gradual increase during the forecast period.

Request Free Sample

Regional Analysis

APAC is estimated to contribute 47.8% to the growth of the global market during the forecast period.Technavio’s analysts have elaborately explained the regional trends and drivers that shape the market during the forecast period.

See How Dry Type Transformer Market Demand is Rising in APAC Request Free Sample

The geographic landscape is dominated by APAC, which accounts for nearly 48% of incremental growth, driven by massive grid modernization efforts.

In North America, the focus is on upgrading aging utility distribution networks and supporting a booming data center power infrastructure, with grid hardening programs reducing wildfire ignition risks by 99%.

Europe’s market is shaped by stringent regulations favoring high efficiency units with solid dielectric insulation and supporting renewable energy integration, particularly for offshore wind platforms.

Key technologies like the three phase transformer and low voltage transformer see high demand globally for powering transportation infrastructure power and managing distributed energy resources.

The Middle East invests in resilient power, while South America focuses on mining, prioritizing explosion-proof design.

Market Dynamics

Our researchers analyzed the data with 2025 as the base year, along with the key drivers, trends, and challenges. A holistic analysis of drivers will help companies refine their marketing strategies to gain a competitive advantage.

  • The global dry type transformer market 2026-2030 is witnessing specialized demand across various sectors, driven by distinct application requirements. For instance, the demand for a dry type transformer for data centers is non-negotiable due to safety and uptime imperatives. Similarly, a cast resin transformer for renewable energy projects is preferred for its environmental resilience.
  • For urban infrastructure, a vpi transformer for commercial buildings offers a balance of cost and performance, while a compact dry type transformer for urban areas addresses space constraints. The focus on efficiency is evident in the adoption of a high efficiency amorphous core transformer, which significantly lowers operational costs.
  • In distribution networks, the medium voltage dry type distribution transformer is the standard for reliability. For specific use cases, the low voltage dry type power transformer is critical for final-stage power delivery. Businesses are increasingly conducting a dry type vs oil-filled transformer comparison, where the benefits of dry type transformer safety often outweigh the initial cost.
  • The dry type transformer maintenance requirements are minimal, a key factor in its selection. For harsh environments, a dry type transformer in harsh environments, especially one with marine certifications for dry type transformer in marine environments or a robust design for dry type transformer for mining applications, is crucial.
  • Technologically, the development of high voltage dry type transformer technology and smart dry type transformer with iot capabilities is expanding market boundaries. A key specification in many tenders is now dry type transformer seismic certification, and the fire-resistant properties of an epoxy resin transformer fire resistance are a major selling point.
  • The rise of sustainable transport also creates a niche for a dry type transformer for EV charging. A thorough dry type transformer total cost analysis now shows a 25% faster return on investment in high-utilization settings compared to five years ago, influencing procurement decisions.

What are the key market drivers leading to the rise in the adoption of Dry Type Transformer Industry?

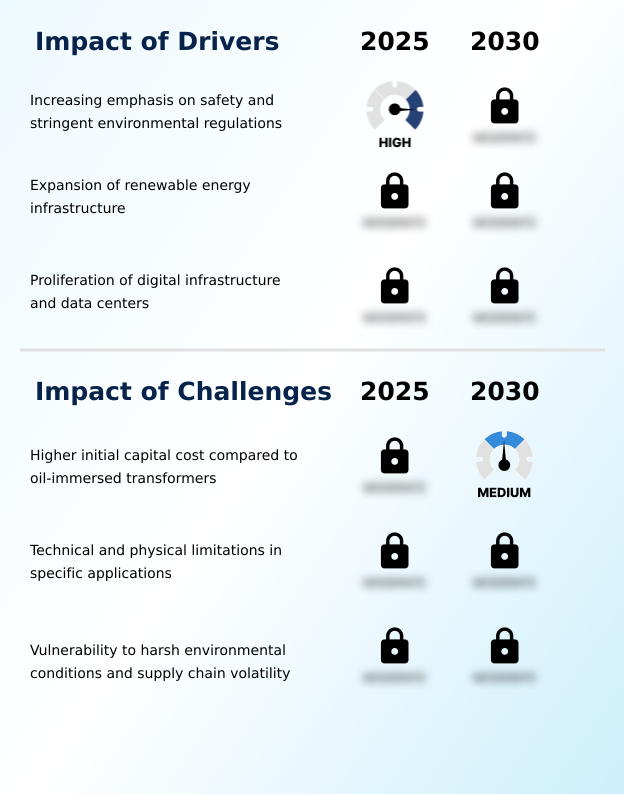
  • An accelerating market driver is the escalating focus on public safety and environmental protection, codified into increasingly stringent regulations and industry standards worldwide.

  • The market's expansion is fundamentally driven by a global focus on electrical system fire safety and environmental risk mitigation.
  • Increasingly strict regulations mandate the use of non-flammable dielectric fluids, making the dry type transformer essential for commercial building power and high-rise building electrical systems.
  • The use of self-extinguishing materials in cast resin transformer models directly supports these fire safety classifications. This regulatory push improves public safety compliance by nearly 100% in new urban constructions.
  • The rapid expansion of sustainable energy infrastructure, particularly offshore wind platforms and solar farms, also creates significant demand. The low-maintenance electrical components are ideal for remote locations, while their design eliminates contamination risks, aligning with grid hardening programs.

What are the market trends shaping the Dry Type Transformer Industry?

  • A defining trend is the systematic integration of smart technologies and digitalization, transforming passive electrical components into intelligent, communicative assets within a connected grid.

  • The evolution of the market is marked by the integration of smart grid technology, transforming passive electrical components into intelligent assets. Modern units increasingly feature winding temperature monitoring and partial discharge detection, with data fed into asset performance management systems for predictive maintenance. This shift improves operational uptime in mission-critical facilities by over 25%.
  • A focus on sustainability is driving the development of eco-friendly transformer materials, including bio-based epoxy resins. Innovations in amorphous metal core technology are also reducing no-load losses by up to 70%, meeting stringent energy efficiency standards and enhancing power quality conditioning.
  • The push for higher power density is enabling more compact substation design, crucial for urban power distribution and transportation infrastructure power systems.

What challenges does the Dry Type Transformer Industry face during its growth?

  • A significant challenge confronting the market is the higher initial capital expenditure for dry type transformers compared to traditional oil-immersed alternatives.

  • The market contends with challenges, primarily the higher initial investment for a vacuum pressure impregnated (VPI) transformer, which can overshadow a favorable total cost of ownership. Technical limitations persist; for instance, the larger size of a medium voltage transformer complicates installations in subterranean substations.
  • While designs offer excellent short-circuit strength, their inherent dielectric strength is still being pushed to higher levels. The need for a precise power electronics system for voltage regulation is critical due to lower overload tolerance. An explosion-proof design offers safety, but this does not always aid energy consumption optimization.
  • The reliance on a specialized supply chain for laminated steel core materials and resins introduces risks, where disruptions can delay projects for heavy industrial applications by over 15%.

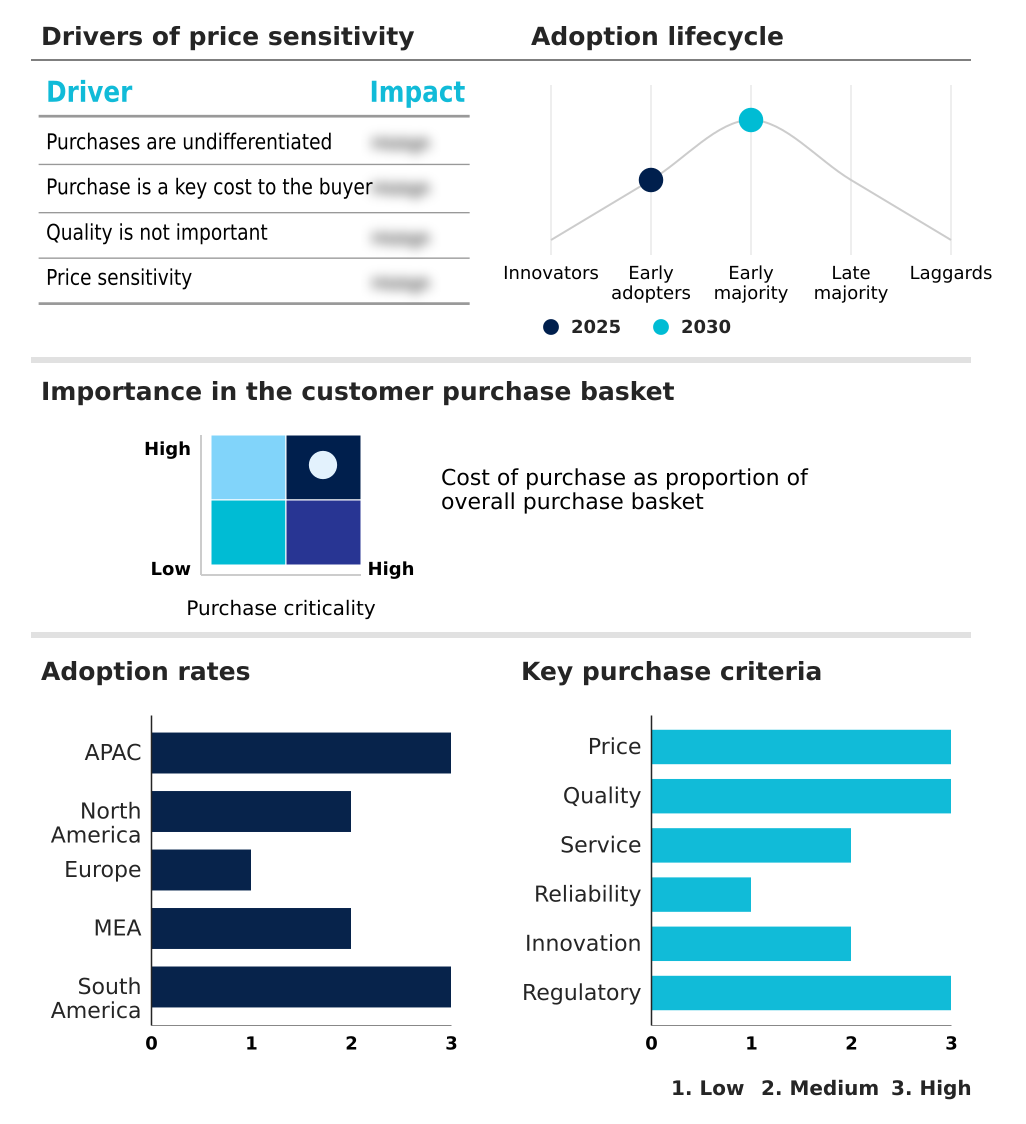
Exclusive Technavio Analysis on Customer Landscape

The dry type transformer market forecasting report includes the adoption lifecycle of the market, covering from the innovator’s stage to the laggard’s stage. It focuses on adoption rates in different regions based on penetration. Furthermore, the dry type transformer market report also includes key purchase criteria and drivers of price sensitivity to help companies evaluate and develop their market growth analysis strategies.

Customer Landscape of Dry Type Transformer Industry

Competitive Landscape

Companies are implementing various strategies, such as strategic alliances, dry type transformer market forecast, partnerships, mergers and acquisitions, geographical expansion, and product/service launches, to enhance their presence in the industry.

ABB Ltd. - Offers VPI and cast-resin dry-type transformers up to 36 kV, engineered for demanding industrial, commercial, and renewable energy applications requiring high safety and reliability.

The industry research and growth report includes detailed analyses of the competitive landscape of the market and information about key companies, including:

  • ABB Ltd.
  • alfanar Group
  • Bharat Heavy Electricals Ltd.
  • CG Power and Industrial Ltd.
  • Eaton Corp. Plc
  • Fuji Electric Co. Ltd.
  • General Electric Co.
  • Hammond Power Inc.
  • Hitachi Ltd.
  • Hyundai Motor Co.
  • Mitsubishi Electric Corp.
  • Schneider Electric SE
  • Siemens Energy AG
  • TBEA Co. Ltd.
  • Toshiba Corp.
  • Voltamp Transformers Ltd
  • WEG S.A

Qualitative and quantitative analysis of companies has been conducted to help clients understand the wider business environment as well as the strengths and weaknesses of key industry players. Data is qualitatively analyzed to categorize companies as pure play, category-focused, industry-focused, and diversified; it is quantitatively analyzed to categorize companies as dominant, leading, strong, tentative, and weak.

Recent Development and News in Dry type transformer market

  • In March, 2025, Schneider Electric announced an update to its EcoStruxure platform, enhancing predictive maintenance capabilities for its cast resin transformers to meet reliability demands from the global data center market.
  • In April, 2025, a collaboration between a specialty chemical firm and a transformer manufacturer led to the commercial launch of a cast resin transformer using a novel bio-epoxy composite to improve recyclability.
  • In May, 2025, ABB launched its EcoDry line of ultra-efficient dry type transformers, which utilize advanced materials to minimize energy losses in compliance with stringent European environmental regulations.
  • In May, 2025, a major European utility company announced a strategic partnership with an electrical equipment manufacturer to deploy a new fleet of smart cast resin transformers across its urban distribution network to enhance grid resilience.

Dive into Technavio’s robust research methodology, blending expert interviews, extensive data synthesis, and validated models for unparalleled Dry Type Transformer Market insights. See full methodology.

Market Scope
Page number 294
Base year 2025
Historic period 2020-2024
Forecast period 2026-2030
Growth momentum & CAGR Accelerate at a CAGR of 6.2%
Market growth 2026-2030 USD 4040.9 million
Market structure Fragmented
YoY growth 2025-2026(%) 6.2%
Key countries China, Japan, India, South Korea, Australia, Indonesia, US, Canada, Mexico, Germany, France, UK, Italy, Spain, The Netherlands, Saudi Arabia, UAE, South Africa, Israel, Turkey, Brazil, Argentina and Colombia
Competitive landscape Leading Companies, Market Positioning of Companies, Competitive Strategies, and Industry Risks

Request Free Sample

Research Analyst Overview

  • The dry type transformer market reflects a shift towards safer power distribution. Core offerings include the single phase transformer and three phase transformer, segmented into low voltage transformer, medium voltage transformer, and emerging high voltage transformer models. Dominant technologies are the cast resin transformer and the vacuum pressure impregnated (VPI) transformer, using solid dielectric insulation like epoxy resin insulation.
  • Cooling methods range from natural air convection to forced air cooling. The laminated steel core is standard, but the amorphous metal core is gaining traction for reducing no-load losses and load losses. Innovations in bio-based epoxy resins and hybrid gas-solid insulation are notable.
  • Asset longevity is a key boardroom concern, where integrated winding temperature monitoring and partial discharge detection can cut unexpected failures by over 40%. Performance is judged on seismic resistance, short-circuit strength, and dielectric strength. Higher power density allows for compact substation design, vital for grid modernization and renewable energy integration.
  • Precise voltage regulation, explosion-proof design, and advanced thermal management systems are differentiators, while digital twin modeling enables predictive maintenance, bolstering electrical grid resilience.

What are the Key Data Covered in this Dry Type Transformer Market Research and Growth Report?

  • What is the expected growth of the Dry Type Transformer Market between 2026 and 2030?

    • USD 4.04 billion, at a CAGR of 6.2%

  • What segmentation does the market report cover?

    • The report is segmented by Type (Single phase, and Three phase), Product (Medium voltage, Low voltage, and High voltage), Technology (Cast resin, and Vacuum pressure impregnated) and Geography (APAC, North America, Europe, Middle East and Africa, South America)

  • Which regions are analyzed in the report?

    • APAC, North America, Europe, Middle East and Africa and South America

  • What are the key growth drivers and market challenges?

    • Increasing emphasis on safety and stringent environmental regulations, Higher initial capital cost compared to oil-immersed transformers

  • Who are the major players in the Dry Type Transformer Market?

    • ABB Ltd., alfanar Group, Bharat Heavy Electricals Ltd., CG Power and Industrial Ltd., Eaton Corp. Plc, Fuji Electric Co. Ltd., General Electric Co., Hammond Power Inc., Hitachi Ltd., Hyundai Motor Co., Mitsubishi Electric Corp., Schneider Electric SE, Siemens Energy AG, TBEA Co. Ltd., Toshiba Corp., Voltamp Transformers Ltd and WEG S.A

Market Research Insights

  • Market dynamics are increasingly shaped by the need for operational resilience, particularly within mission-critical facilities and data center power infrastructure. Adherence to stringent energy efficiency standards has become a key differentiator, with advanced designs reducing energy consumption by up to 12% over their lifecycle.
  • The total cost of ownership is a critical metric, as the higher initial investment is offset by reduced maintenance and insurance costs, leading to a break-even point 30% faster in some industrial applications.
  • Furthermore, the focus on electrical system fire safety in urban power distribution is driving adoption, with installations in new high-rise buildings showing a near-perfect safety record against transformer-related fire incidents.

We can help! Our analysts can customize this dry type transformer market research report to meet your requirements.

Get in touch

1. Executive Summary

1.1 Market overview

Executive Summary - Chart on Market Overview
Executive Summary - Data Table on Market Overview
Executive Summary - Chart on Global Market Characteristics
Executive Summary - Chart on Market by Geography
Executive Summary - Chart on Market Segmentation by Type
Executive Summary - Chart on Market Segmentation by Product
Executive Summary - Chart on Market Segmentation by Technology
Executive Summary - Chart on Incremental Growth
Executive Summary - Data Table on Incremental Growth
Executive Summary - Chart on Company Market Positioning

2. Technavio Analysis

2.1 Analysis of price sensitivity, lifecycle, customer purchase basket, adoption rates, and purchase criteria

2.2 Criticality of inputs and Factors of differentiation

Chart on Overview on criticality of inputs and factors of differentiation

2.3 Factors of disruption

Chart on Overview on factors of disruption

2.4 Impact of drivers and challenges

Chart on Impact of drivers and challenges in 2025 and 2030

3. Market Landscape

3.1 Market ecosystem

Chart on Parent Market
Data Table on - Parent Market

3.2 Market characteristics

Chart on Market characteristics analysis

3.3 Value chain analysis

Chart on Value chain analysis

4. Market Sizing

4.1 Market definition

Data Table on Offerings of companies included in the market definition

4.2 Market segment analysis

Market segments

4.3 Market size 2025

4.4 Market outlook: Forecast for 2025-2030

Chart on Global - Market size and forecast 2025-2030 ($ million)
Data Table on Global - Market size and forecast 2025-2030 ($ million)
Chart on Global Market: Year-over-year growth 2025-2030 (%)
Data Table on Global Market: Year-over-year growth 2025-2030 (%)

5. Historic Market Size

5.1 Global Dry Type Transformer Market 2020 - 2024

Historic Market Size - Data Table on Global Dry Type Transformer Market 2020 - 2024 ($ million)

5.2 Type segment analysis 2020 - 2024

Historic Market Size - Type Segment 2020 - 2024 ($ million)

5.3 Product segment analysis 2020 - 2024

Historic Market Size - Product Segment 2020 - 2024 ($ million)

5.4 Technology segment analysis 2020 - 2024

Historic Market Size - Technology Segment 2020 - 2024 ($ million)

5.5 Geography segment analysis 2020 - 2024

Historic Market Size - Geography Segment 2020 - 2024 ($ million)

5.6 Country segment analysis 2020 - 2024

Historic Market Size - Country Segment 2020 - 2024 ($ million)

6. Qualitative Analysis

6.1 The AI impact on global dry type transformer market

7. Five Forces Analysis

7.1 Five forces summary

Five forces analysis - Comparison between 2025 and 2030

7.2 Bargaining power of buyers

Bargaining power of buyers - Impact of key factors 2025 and 2030

7.3 Bargaining power of suppliers

Bargaining power of suppliers - Impact of key factors in 2025 and 2030

7.4 Threat of new entrants

Threat of new entrants - Impact of key factors in 2025 and 2030

7.5 Threat of substitutes

Threat of substitutes - Impact of key factors in 2025 and 2030

7.6 Threat of rivalry

Threat of rivalry - Impact of key factors in 2025 and 2030

7.7 Market condition

Chart on Market condition - Five forces 2025 and 2030

8. Market Segmentation by Type

8.1 Market segments

Chart on Type - Market share 2025-2030 (%)
Data Table on Type - Market share 2025-2030 (%)

8.2 Comparison by Type

Chart on Comparison by Type
Data Table on Comparison by Type

8.3 Single phase - Market size and forecast 2025-2030

Chart on Single phase - Market size and forecast 2025-2030 ($ million)
Data Table on Single phase - Market size and forecast 2025-2030 ($ million)
Chart on Single phase - Year-over-year growth 2025-2030 (%)
Data Table on Single phase - Year-over-year growth 2025-2030 (%)

8.4 Three phase - Market size and forecast 2025-2030

Chart on Three phase - Market size and forecast 2025-2030 ($ million)
Data Table on Three phase - Market size and forecast 2025-2030 ($ million)
Chart on Three phase - Year-over-year growth 2025-2030 (%)
Data Table on Three phase - Year-over-year growth 2025-2030 (%)

8.5 Market opportunity by Type

Market opportunity by Type ($ million)
Data Table on Market opportunity by Type ($ million)

9. Market Segmentation by Product

9.1 Market segments

Chart on Product - Market share 2025-2030 (%)
Data Table on Product - Market share 2025-2030 (%)

9.2 Comparison by Product

Chart on Comparison by Product
Data Table on Comparison by Product

9.3 Medium voltage - Market size and forecast 2025-2030

Chart on Medium voltage - Market size and forecast 2025-2030 ($ million)
Data Table on Medium voltage - Market size and forecast 2025-2030 ($ million)
Chart on Medium voltage - Year-over-year growth 2025-2030 (%)
Data Table on Medium voltage - Year-over-year growth 2025-2030 (%)

9.4 Low voltage - Market size and forecast 2025-2030

Chart on Low voltage - Market size and forecast 2025-2030 ($ million)
Data Table on Low voltage - Market size and forecast 2025-2030 ($ million)
Chart on Low voltage - Year-over-year growth 2025-2030 (%)
Data Table on Low voltage - Year-over-year growth 2025-2030 (%)

9.5 High voltage - Market size and forecast 2025-2030

Chart on High voltage - Market size and forecast 2025-2030 ($ million)
Data Table on High voltage - Market size and forecast 2025-2030 ($ million)
Chart on High voltage - Year-over-year growth 2025-2030 (%)
Data Table on High voltage - Year-over-year growth 2025-2030 (%)

9.6 Market opportunity by Product

Market opportunity by Product ($ million)
Data Table on Market opportunity by Product ($ million)

10. Market Segmentation by Technology

10.1 Market segments

Chart on Technology - Market share 2025-2030 (%)
Data Table on Technology - Market share 2025-2030 (%)

10.2 Comparison by Technology

Chart on Comparison by Technology
Data Table on Comparison by Technology

10.3 Cast resin - Market size and forecast 2025-2030

Chart on Cast resin - Market size and forecast 2025-2030 ($ million)
Data Table on Cast resin - Market size and forecast 2025-2030 ($ million)
Chart on Cast resin - Year-over-year growth 2025-2030 (%)
Data Table on Cast resin - Year-over-year growth 2025-2030 (%)

10.4 Vacuum pressure impregnated - Market size and forecast 2025-2030

Chart on Vacuum pressure impregnated - Market size and forecast 2025-2030 ($ million)
Data Table on Vacuum pressure impregnated - Market size and forecast 2025-2030 ($ million)
Chart on Vacuum pressure impregnated - Year-over-year growth 2025-2030 (%)
Data Table on Vacuum pressure impregnated - Year-over-year growth 2025-2030 (%)

10.5 Market opportunity by Technology

Market opportunity by Technology ($ million)
Data Table on Market opportunity by Technology ($ million)

11. Customer Landscape

11.1 Customer landscape overview

Analysis of price sensitivity, lifecycle, customer purchase basket, adoption rates, and purchase criteria

12. Geographic Landscape

12.1 Geographic segmentation

Chart on Market share by geography 2025-2030 (%)
Data Table on Market share by geography 2025-2030 (%)

12.2 Geographic comparison

Chart on Geographic comparison
Data Table on Geographic comparison

12.3 APAC - Market size and forecast 2025-2030

Chart on APAC - Market size and forecast 2025-2030 ($ million)
Data Table on APAC - Market size and forecast 2025-2030 ($ million)
Chart on APAC - Year-over-year growth 2025-2030 (%)
Data Table on APAC - Year-over-year growth 2025-2030 (%)
Chart on Regional Comparison - APAC
Data Table on Regional Comparison - APAC

12.3.1 China - Market size and forecast 2025-2030

Chart on China - Market size and forecast 2025-2030 ($ million)
Data Table on China - Market size and forecast 2025-2030 ($ million)
Chart on China - Year-over-year growth 2025-2030 (%)
Data Table on China - Year-over-year growth 2025-2030 (%)

12.3.2 Japan - Market size and forecast 2025-2030

Chart on Japan - Market size and forecast 2025-2030 ($ million)
Data Table on Japan - Market size and forecast 2025-2030 ($ million)
Chart on Japan - Year-over-year growth 2025-2030 (%)
Data Table on Japan - Year-over-year growth 2025-2030 (%)

12.3.3 India - Market size and forecast 2025-2030

Chart on India - Market size and forecast 2025-2030 ($ million)
Data Table on India - Market size and forecast 2025-2030 ($ million)
Chart on India - Year-over-year growth 2025-2030 (%)
Data Table on India - Year-over-year growth 2025-2030 (%)

12.3.4 South Korea - Market size and forecast 2025-2030

Chart on South Korea - Market size and forecast 2025-2030 ($ million)
Data Table on South Korea - Market size and forecast 2025-2030 ($ million)
Chart on South Korea - Year-over-year growth 2025-2030 (%)
Data Table on South Korea - Year-over-year growth 2025-2030 (%)

12.3.5 Australia - Market size and forecast 2025-2030

Chart on Australia - Market size and forecast 2025-2030 ($ million)
Data Table on Australia - Market size and forecast 2025-2030 ($ million)
Chart on Australia - Year-over-year growth 2025-2030 (%)
Data Table on Australia - Year-over-year growth 2025-2030 (%)

12.3.6 Indonesia - Market size and forecast 2025-2030

Chart on Indonesia - Market size and forecast 2025-2030 ($ million)
Data Table on Indonesia - Market size and forecast 2025-2030 ($ million)
Chart on Indonesia - Year-over-year growth 2025-2030 (%)
Data Table on Indonesia - Year-over-year growth 2025-2030 (%)

12.4 North America - Market size and forecast 2025-2030

Chart on North America - Market size and forecast 2025-2030 ($ million)
Data Table on North America - Market size and forecast 2025-2030 ($ million)
Chart on North America - Year-over-year growth 2025-2030 (%)
Data Table on North America - Year-over-year growth 2025-2030 (%)
Chart on Regional Comparison - North America
Data Table on Regional Comparison - North America

12.4.1 US - Market size and forecast 2025-2030

Chart on US - Market size and forecast 2025-2030 ($ million)
Data Table on US - Market size and forecast 2025-2030 ($ million)
Chart on US - Year-over-year growth 2025-2030 (%)
Data Table on US - Year-over-year growth 2025-2030 (%)

12.4.2 Canada - Market size and forecast 2025-2030

Chart on Canada - Market size and forecast 2025-2030 ($ million)
Data Table on Canada - Market size and forecast 2025-2030 ($ million)
Chart on Canada - Year-over-year growth 2025-2030 (%)
Data Table on Canada - Year-over-year growth 2025-2030 (%)

12.4.3 Mexico - Market size and forecast 2025-2030

Chart on Mexico - Market size and forecast 2025-2030 ($ million)
Data Table on Mexico - Market size and forecast 2025-2030 ($ million)
Chart on Mexico - Year-over-year growth 2025-2030 (%)
Data Table on Mexico - Year-over-year growth 2025-2030 (%)

12.5 Europe - Market size and forecast 2025-2030

Chart on Europe - Market size and forecast 2025-2030 ($ million)
Data Table on Europe - Market size and forecast 2025-2030 ($ million)
Chart on Europe - Year-over-year growth 2025-2030 (%)
Data Table on Europe - Year-over-year growth 2025-2030 (%)
Chart on Regional Comparison - Europe
Data Table on Regional Comparison - Europe

12.5.1 Germany - Market size and forecast 2025-2030

Chart on Germany - Market size and forecast 2025-2030 ($ million)
Data Table on Germany - Market size and forecast 2025-2030 ($ million)
Chart on Germany - Year-over-year growth 2025-2030 (%)
Data Table on Germany - Year-over-year growth 2025-2030 (%)

12.5.2 France - Market size and forecast 2025-2030

Chart on France - Market size and forecast 2025-2030 ($ million)
Data Table on France - Market size and forecast 2025-2030 ($ million)
Chart on France - Year-over-year growth 2025-2030 (%)
Data Table on France - Year-over-year growth 2025-2030 (%)

12.5.3 UK - Market size and forecast 2025-2030

Chart on UK - Market size and forecast 2025-2030 ($ million)
Data Table on UK - Market size and forecast 2025-2030 ($ million)
Chart on UK - Year-over-year growth 2025-2030 (%)
Data Table on UK - Year-over-year growth 2025-2030 (%)

12.5.4 Italy - Market size and forecast 2025-2030

Chart on Italy - Market size and forecast 2025-2030 ($ million)
Data Table on Italy - Market size and forecast 2025-2030 ($ million)
Chart on Italy - Year-over-year growth 2025-2030 (%)
Data Table on Italy - Year-over-year growth 2025-2030 (%)

12.5.5 Spain - Market size and forecast 2025-2030

Chart on Spain - Market size and forecast 2025-2030 ($ million)
Data Table on Spain - Market size and forecast 2025-2030 ($ million)
Chart on Spain - Year-over-year growth 2025-2030 (%)
Data Table on Spain - Year-over-year growth 2025-2030 (%)

12.5.6 The Netherlands - Market size and forecast 2025-2030

Chart on The Netherlands - Market size and forecast 2025-2030 ($ million)
Data Table on The Netherlands - Market size and forecast 2025-2030 ($ million)
Chart on The Netherlands - Year-over-year growth 2025-2030 (%)
Data Table on The Netherlands - Year-over-year growth 2025-2030 (%)

12.6 Middle East and Africa - Market size and forecast 2025-2030

Chart on Middle East and Africa - Market size and forecast 2025-2030 ($ million)
Data Table on Middle East and Africa - Market size and forecast 2025-2030 ($ million)
Chart on Middle East and Africa - Year-over-year growth 2025-2030 (%)
Data Table on Middle East and Africa - Year-over-year growth 2025-2030 (%)
Chart on Regional Comparison - Middle East and Africa
Data Table on Regional Comparison - Middle East and Africa

12.6.1 Saudi Arabia - Market size and forecast 2025-2030

Chart on Saudi Arabia - Market size and forecast 2025-2030 ($ million)
Data Table on Saudi Arabia - Market size and forecast 2025-2030 ($ million)
Chart on Saudi Arabia - Year-over-year growth 2025-2030 (%)
Data Table on Saudi Arabia - Year-over-year growth 2025-2030 (%)

12.6.2 UAE - Market size and forecast 2025-2030

Chart on UAE - Market size and forecast 2025-2030 ($ million)
Data Table on UAE - Market size and forecast 2025-2030 ($ million)
Chart on UAE - Year-over-year growth 2025-2030 (%)
Data Table on UAE - Year-over-year growth 2025-2030 (%)

12.6.3 South Africa - Market size and forecast 2025-2030

Chart on South Africa - Market size and forecast 2025-2030 ($ million)
Data Table on South Africa - Market size and forecast 2025-2030 ($ million)
Chart on South Africa - Year-over-year growth 2025-2030 (%)
Data Table on South Africa - Year-over-year growth 2025-2030 (%)

12.6.4 Israel - Market size and forecast 2025-2030

Chart on Israel - Market size and forecast 2025-2030 ($ million)
Data Table on Israel - Market size and forecast 2025-2030 ($ million)
Chart on Israel - Year-over-year growth 2025-2030 (%)
Data Table on Israel - Year-over-year growth 2025-2030 (%)

12.6.5 Turkey - Market size and forecast 2025-2030

Chart on Turkey - Market size and forecast 2025-2030 ($ million)
Data Table on Turkey - Market size and forecast 2025-2030 ($ million)
Chart on Turkey - Year-over-year growth 2025-2030 (%)
Data Table on Turkey - Year-over-year growth 2025-2030 (%)

12.7 South America - Market size and forecast 2025-2030

Chart on South America - Market size and forecast 2025-2030 ($ million)
Data Table on South America - Market size and forecast 2025-2030 ($ million)
Chart on South America - Year-over-year growth 2025-2030 (%)
Data Table on South America - Year-over-year growth 2025-2030 (%)
Chart on Regional Comparison - South America
Data Table on Regional Comparison - South America

12.7.1 Brazil - Market size and forecast 2025-2030

Chart on Brazil - Market size and forecast 2025-2030 ($ million)
Data Table on Brazil - Market size and forecast 2025-2030 ($ million)
Chart on Brazil - Year-over-year growth 2025-2030 (%)
Data Table on Brazil - Year-over-year growth 2025-2030 (%)

12.7.2 Argentina - Market size and forecast 2025-2030

Chart on Argentina - Market size and forecast 2025-2030 ($ million)
Data Table on Argentina - Market size and forecast 2025-2030 ($ million)
Chart on Argentina - Year-over-year growth 2025-2030 (%)
Data Table on Argentina - Year-over-year growth 2025-2030 (%)

12.7.3 Colombia - Market size and forecast 2025-2030

Chart on Colombia - Market size and forecast 2025-2030 ($ million)
Data Table on Colombia - Market size and forecast 2025-2030 ($ million)
Chart on Colombia - Year-over-year growth 2025-2030 (%)
Data Table on Colombia - Year-over-year growth 2025-2030 (%)

12.8 Market opportunity by geography

Market opportunity by geography ($ million)
Data Tables on Market opportunity by geography ($ million)

13. Drivers, Challenges, and Opportunity

13.1 Market drivers

Increasing emphasis on safety and stringent environmental regulations
Expansion of renewable energy infrastructure
Proliferation of digital infrastructure and data centers

13.2 Market challenges

Higher initial capital cost compared to oil-immersed transformers
Technical and physical limitations in specific applications
Vulnerability to harsh environmental conditions and supply chain volatility

13.3 Impact of drivers and challenges

Impact of drivers and challenges in 2025 and 2030

13.4 Market opportunities

Integration of smart technologies and digitalization
Focus on enhanced eco-friendliness and energy efficiency
Expansion into higher voltage ratings and increased power density

14. Competitive Landscape

14.1 Overview

14.2

Overview on criticality of inputs and factors of differentiation

14.3 Landscape disruption

Overview on factors of disruption

14.4 Industry risks

Impact of key risks on business

15. Competitive Analysis

15.1 Companies profiled

Companies covered

15.2 Company ranking index

15.3 Market positioning of companies

Matrix on companies position and classification

15.4 ABB Ltd.

ABB Ltd. - Overview
ABB Ltd. - Business segments
ABB Ltd. - Key news
ABB Ltd. - Key offerings
ABB Ltd. - Segment focus
SWOT

15.5 Bharat Heavy Electricals Ltd.

Bharat Heavy Electricals Ltd. - Overview
Bharat Heavy Electricals Ltd. - Business segments
Bharat Heavy Electricals Ltd. - Key news
Bharat Heavy Electricals Ltd. - Key offerings
Bharat Heavy Electricals Ltd. - Segment focus
SWOT

15.6 CG Power and Industrial Ltd.

CG Power and Industrial Ltd. - Overview
CG Power and Industrial Ltd. - Business segments
CG Power and Industrial Ltd. - Key offerings
CG Power and Industrial Ltd. - Segment focus
SWOT

15.7 Eaton Corp. Plc

Eaton Corp. Plc - Overview
Eaton Corp. Plc - Business segments
Eaton Corp. Plc - Key news
Eaton Corp. Plc - Key offerings
Eaton Corp. Plc - Segment focus
SWOT

15.8 Fuji Electric Co. Ltd.

Fuji Electric Co. Ltd. - Overview
Fuji Electric Co. Ltd. - Business segments
Fuji Electric Co. Ltd. - Key news
Fuji Electric Co. Ltd. - Key offerings
Fuji Electric Co. Ltd. - Segment focus
SWOT

15.9 General Electric Co.

General Electric Co. - Overview
General Electric Co. - Business segments
General Electric Co. - Key news
General Electric Co. - Key offerings
General Electric Co. - Segment focus
SWOT

15.10 Hammond Power Inc.

Hammond Power Inc. - Overview
Hammond Power Inc. - Product / Service
Hammond Power Inc. - Key offerings
SWOT

15.11 Hitachi Ltd.

Hitachi Ltd. - Overview
Hitachi Ltd. - Business segments
Hitachi Ltd. - Key news
Hitachi Ltd. - Key offerings
Hitachi Ltd. - Segment focus
SWOT

15.12 Hyundai Motor Co.

Hyundai Motor Co. - Overview
Hyundai Motor Co. - Business segments
Hyundai Motor Co. - Key news
Hyundai Motor Co. - Key offerings
Hyundai Motor Co. - Segment focus
SWOT

15.13 Mitsubishi Electric Corp.

Mitsubishi Electric Corp. - Overview
Mitsubishi Electric Corp. - Business segments
Mitsubishi Electric Corp. - Key offerings
Mitsubishi Electric Corp. - Segment focus
SWOT

15.14 Schneider Electric SE

Schneider Electric SE - Overview
Schneider Electric SE - Business segments
Schneider Electric SE - Key news
Schneider Electric SE - Key offerings
Schneider Electric SE - Segment focus
SWOT

15.15 Siemens Energy AG

Siemens Energy AG - Overview
Siemens Energy AG - Business segments
Siemens Energy AG - Key news
Siemens Energy AG - Key offerings
Siemens Energy AG - Segment focus
SWOT

15.16 TBEA Co. Ltd.

TBEA Co. Ltd. - Overview
TBEA Co. Ltd. - Product / Service
TBEA Co. Ltd. - Key offerings
SWOT

15.17 Toshiba Corp.

Toshiba Corp. - Overview
Toshiba Corp. - Business segments
Toshiba Corp. - Key news
Toshiba Corp. - Key offerings
Toshiba Corp. - Segment focus
SWOT

15.18 WEG S.A

WEG S.A - Overview
WEG S.A - Business segments
WEG S.A - Key news
WEG S.A - Key offerings
WEG S.A - Segment focus
SWOT

16. Appendix

16.1 Scope of the report

Market definition
Objectives
Notes and caveats

16.2 Inclusions and exclusions checklist

Inclusions checklist
Exclusions checklist

16.3 Currency conversion rates for US$

16.4 Research methodology

16.5 Data procurement

Information sources

16.6 Data validation

16.7 Validation techniques employed for market sizing

16.8 Data synthesis

16.9 360 degree market analysis

16.10 List of abbreviations

Research Methodology

Technavio presents a detailed picture of the market by way of study, synthesis, and summation of data from multiple sources. The analysts have presented the various facets of the market with a particular focus on identifying the key industry influencers. The data thus presented is comprehensive, reliable, and the result of extensive research, both primary and secondary.

INFORMATION SOURCES

Primary sources

  • Manufacturers and suppliers
  • Channel partners
  • Industry experts
  • Strategic decision makers

Secondary sources

  • Industry journals and periodicals
  • Government data
  • Financial reports of key industry players
  • Historical data
  • Press releases

DATA ANALYSIS

Data Synthesis

  • Collation of data
  • Estimation of key figures
  • Analysis of derived insights

Data Validation

  • Triangulation with data models
  • Reference against proprietary databases
  • Corroboration with industry experts

REPORT WRITING

Qualitative

  • Market drivers
  • Market challenges
  • Market trends
  • Five forces analysis

Quantitative

  • Market size and forecast
  • Market segmentation
  • Geographical insights
  • Competitive landscape

Interested in this report?

Get your sample now to see our research methodology and insights!

Download Now

Frequently Asked Questions

Dry Type Transformer market growth will increase by USD 4040.9 million during 2026-2030 .

The Dry Type Transformer market is expected to grow at a CAGR of 6.2% during 2026-2030 .

Dry Type Transformer market is segmented by Type (Single phase, Three phase) Product (Medium voltage, Low voltage, High voltage) Technology (Cast resin, Vacuum pressure impregnated)

ABB Ltd., alfanar Group, Bharat Heavy Electricals Ltd., CG Power and Industrial Ltd., Eaton Corp. Plc, Fuji Electric Co. Ltd., General Electric Co., Hammond Power Inc., Hitachi Ltd., Hyundai Motor Co., Mitsubishi Electric Corp., Schneider Electric SE, Siemens Energy AG, TBEA Co. Ltd., Toshiba Corp., Voltamp Transformers Ltd, WEG S.A are a few of the key vendors in the Dry Type Transformer market.

APAC will register the highest growth rate of 47.8% among the other regions. Therefore, the Dry Type Transformer market in APAC is expected to garner significant business opportunities for the vendors during the forecast period.

China, Japan, India, South Korea, Australia, Indonesia, US, Canada, Mexico, Germany, France, UK, Italy, Spain, The Netherlands, Saudi Arabia, UAE, South Africa, Israel, Turkey, Brazil, Argentina, Colombia

  • Increasing emphasis on safety and stringent environmental regulations is the driving factor this market.

The Dry Type Transformer market vendors should focus on grabbing business opportunities from the Type segment as it accounted for the largest market share in the base year.