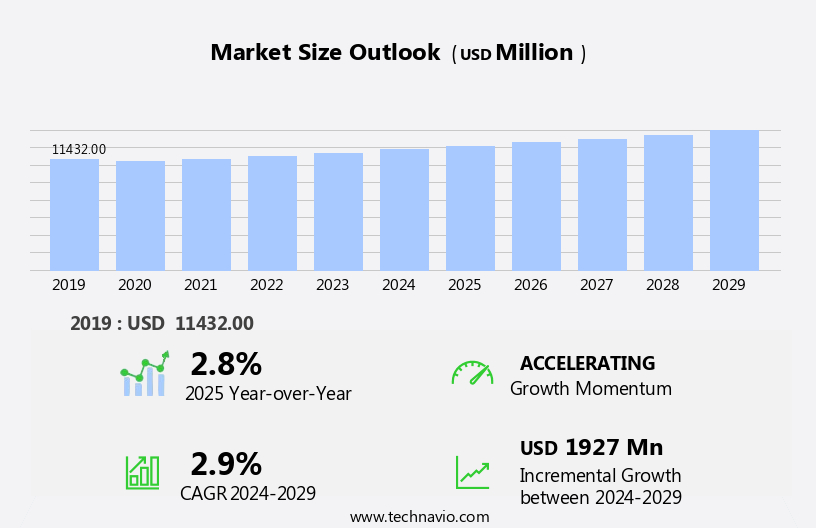
Duck Meat Market Size and Forecast 2025-2029
The duck meat market size estimates the market to reach by USD 1.93 billion, at a CAGR of 2.9% between 2024 and 2029. APAC is expected to account for 71% of the growth contribution to the global market during this period. In 2019 the offline segment was valued at USD 10.11 billion and has demonstrated steady growth since then.
- The market is experiencing significant growth due to the increasing production of duck meat, driven by the expanding demand in key consumer markets. This trend is further fueled by the development of cultivated meat, which presents new opportunities for market expansion and innovation. However, the market faces challenges as the popularity of vegan diets continues to rise, posing a threat to traditional meat consumption. Companies in the duck meat industry must adapt to these shifting consumer preferences and explore alternative production methods and marketing strategies to maintain competitiveness.
- The integration of technology and sustainable farming practices can also help mitigate production challenges and enhance overall market performance. Overall, the market presents both opportunities and challenges, requiring strategic planning and agility from industry players to capitalize on emerging trends and navigate evolving consumer preferences.
What will be the Size of the Duck Meat Market during the forecast period?
The dynamic the market continues to evolve, driven by various factors that shape its growth and application across diverse sectors. Packaging innovations have emerged as a critical aspect of the market, with companies investing in sustainable and eco-friendly solutions to enhance product preservation and reduce waste. For instance, a leading duck meat producer reported a 15% decrease in spoilage rates after implementing a new vacuum-sealed packaging system. Breeding programs and farm management practices have gained significant attention, with a focus on optimizing protein content and improving genetic selection for enhanced growth performance and feed conversion ratio. Ethical farming practices and meat quality grading are also essential considerations, with consumers increasingly demanding higher standards for animal welfare and food safety.
Furthermore, the fatty acid profile and meat tenderness are crucial factors influencing consumer preferences, driving innovation in optimal feeding strategies and processing techniques. Slaughterhouse hygiene and carcass yield are also essential aspects of the production process, with stringent food safety standards and sustainable practices becoming increasingly important. Industry growth is expected to reach double-digit percentages, driven by the rising demand for high-quality, value-added duck meat products. By-product utilization and supply chain efficiency are also critical areas of focus, with companies exploring innovative methods to enhance economic viability and reduce waste. Disease prevention methods and cold chain logistics are essential components of the market, with a focus on maintaining optimal conditions to ensure meat quality and extend shelf life.
Sustainable practices, such as water holding capacity and nutritional value, are also gaining prominence, with consumers increasingly seeking out ethically produced, nutrient-rich duck meat. In conclusion, the market is a continuously evolving landscape, shaped by a range of factors from production to consumption. Companies must remain agile and innovative to meet changing consumer preferences and stay competitive in this dynamic market.
How is this Duck Meat Industry segmented?
The duck meat industry research report provides comprehensive data (region-wise segment analysis), with forecasts and estimates in "USD million" for the period 2025-2029, as well as historical data from 2019-2023 for the following segments.
- Distribution Channel
- Offline
- Online
- Product
- Fresh duck meat
- Processed duck meat
- Application
- Retail
- Foodservice
- Food processing plants
- Geography
- North America
- US
- Europe
- France
- Germany
- UK
- APAC
- China
- India
- Japan
- Malaysia
- South Korea
- Rest of World (ROW)
- North America
By Distribution Channel Insights
The offline segment is estimated to witness significant growth during the forecast period.
The market is experiencing significant trends and innovations, with a focus on sustainable farming practices, ethical treatment of animals, and improved food safety standards. Packaging innovations include vacuum-sealed and modified atmosphere packaging to maintain meat freshness and extend shelf life. Waste management is a priority, with breeding programs optimizing feed conversion ratios and by-product utilization. Genetic selection ensures high protein content and desirable fatty acid profiles. Meat quality grading based on tenderness, water holding capacity, and flavor profile is crucial. Slaughterhouse hygiene and farm management practices ensure disease prevention methods are effective. Optimal feeding strategies and muscle fiber structure enhance growth performance and carcass yield.
Processing techniques, such as sous-vide cooking, ensure meat tenderness and juiciness. Value-added products, such as smoked or cured duck, add to the market's economic viability. The industry anticipates a growth of 5% in the next few years, driven by consumer preferences for healthier protein sources and increasing demand for duck meat in various culinary applications. For instance, in the US, sales of duck meat products in supermarkets increased by 10% in 2021 compared to the previous year. Supply chain efficiency and cold chain logistics are essential to maintain the quality and safety of the product throughout the distribution process.
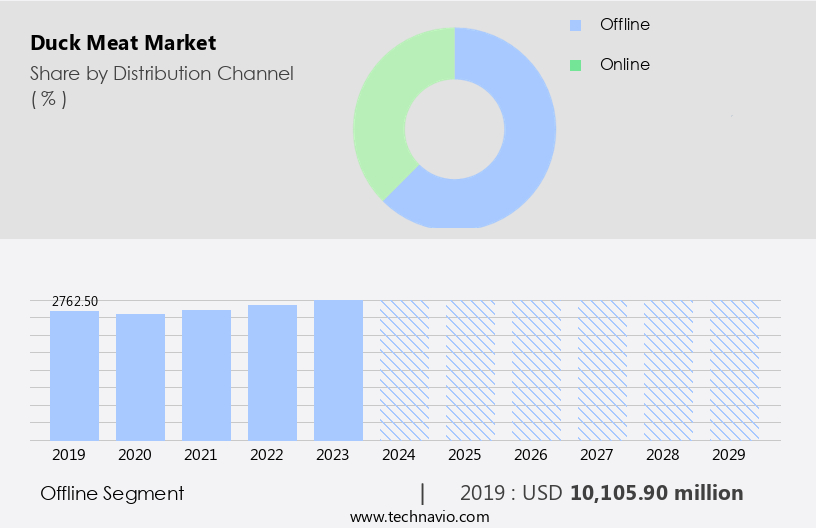
As of 2019 the Offline segment estimated at USD 10.11 billion, and it is forecast to see a moderate upward trend through the forecast period.
Regional Analysis
During the forecast period, APAC is projected to contribute 71% to the overall growth of the global market. Technavio's analysts have elaborately explained the regional trends and drivers that shape the market during the forecast period.
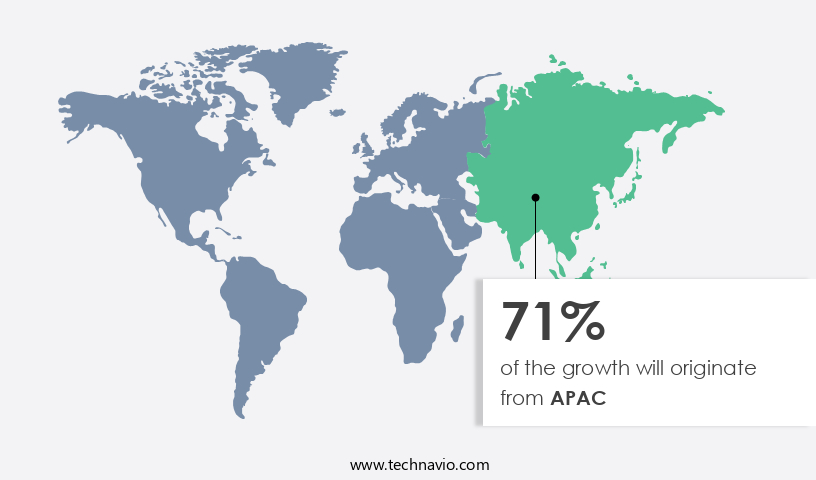
The market in Asia Pacific (APAC) is experiencing significant growth, with this region being the largest consumer and producer. Factors contributing to this expansion include rising health consciousness, the convenience of processed meats, and the proliferation of fast-food chains. Duck meat is a valuable source of protein, making it a popular choice among health-conscious consumers and fitness enthusiasts. In response to increasing demand, advancements in packaging innovations ensure product freshness and prolonged shelf life. Waste management practices are being optimized to minimize environmental impact. Ethical farming methods prioritize animal welfare, while breeding programs focus on improving protein content and meat quality.
Slaughterhouse hygiene and farm management practices are stringently monitored to maintain food safety standards. Optimal feeding strategies, such as genetic selection and feed conversion ratio optimization, contribute to efficient growth performance and by-product utilization. Processing techniques, including meat tenderness enhancement and water holding capacity improvement, ensure high-quality value-added products. Sustainable practices, such as disease prevention methods and shelf life extension, are essential to maintaining economic viability. The APAC the market is expected to grow by 10% during the forecast period, driven by consumer preferences for nutritional value, flavor profile, and the convenience of processed meats. Cold chain logistics and supply chain efficiency are crucial to ensuring product freshness and reducing microbial contamination risks.
Market Dynamics
Our researchers analyzed the data with 2024 as the base year, along with the key drivers, trends, and challenges. A holistic analysis of drivers will help companies refine their marketing strategies to gain a competitive advantage.
The duck meat market is advancing with a focus on duck meat processing efficiency and technologies for improving duck meat tenderness. The role of duck feed formulation impact and sustainable duck farming practices is vital for quality and yield. Producers are working on enhancing duck meat shelf life through optimal duck meat packaging and robust duck meat quality control methods. Key efforts include minimizing duck meat waste and applying duck farming cost optimization strategies. Traceability is ensured with duck meat traceability systems, while the impact of genetics on duck meat influences breeding decisions. Insights into duck meat consumer preference drive efforts in enhancing duck meat flavor and reducing duck meat microbial contamination. Strong duck meat supply chain management, efficient duck meat cold chain, and duck meat value-added products support market growth. Compliance with duck meat food safety regulations, targeted duck meat marketing strategies, and understanding duck meat nutritional composition are also critical.
What are the key market drivers leading to the rise in the adoption of Duck Meat Industry?
- The significant expansion in the global production of duck meat serves as the primary catalyst for market growth. The market has experienced significant growth, with production increasing by approximately 28.1% from roughly 5 million tons to 6 million tons between 2004 and 2023. Major market players have expanded their production capacities, driving the market's expansion. Consumption of duck meat has gained popularity due to its health benefits, fueling this demand growth. For instance, in 2024, the Damate Group increased its duck production by 30% year-over-year, reaching 18 thousand tons in slaughter weight. This growth trend is expected to continue, with the industry forecasted to grow by around 15% in the coming years.
What are the market trends shaping the Duck Meat Industry?
- Cultivated meat is gaining significant traction in the market as a new and innovative development. This emerging trend in the food industry represents a potential shift towards more sustainable and ethical protein production.
- The market is experiencing significant growth dynamics, with a key trend being the emergence of lab-grown duck meat through cellular agriculture. Unlike traditional animal farming, this eco-friendly process does not involve animal slaughter, making it an attractive alternative for consumers and businesses seeking sustainable solutions. Although the manufacturing process is currently expensive, the potential benefits of reducing greenhouse gas emissions and decreasing animal meat consumption make it a promising area for development. In fact, a recent study suggests that the cultivated meat industry could reach a market size of 25 billion USD by 2030, representing a significant expansion from its current state.
- For instance, Integriculture, a Japanese cultivated meat company, successfully developed prototype products made from cultivated duck liver in April 2025. This breakthrough is just one example of the advancements driving the growth of the market in the forecast period.
What challenges does the Duck Meat Industry face during its growth?
- The rising preference for vegan diets poses a significant challenge to the growth of the industry. The market is facing a significant challenge due to the rising trend of veganism. Over the past decade, the number of individuals adhering to vegan dietary choices has surged by an impressive 300%. This shift in consumer preferences is influencing the food industry, with many food service outlets expanding their vegan offerings. The availability of diverse and appealing vegan options is further fueling the popularity of veganism. According to recent studies, vegan diets offer numerous health benefits, including a rich source of fiber, antioxidants, and plant-based proteins.
- This shift towards healthier, more ethical food choices is expected to impact The market negatively during the forecast period. The vegan population is projected to reach 70 million in the US alone by 2027, representing a substantial market opportunity for plant-based food alternatives.
Exclusive Customer Landscape
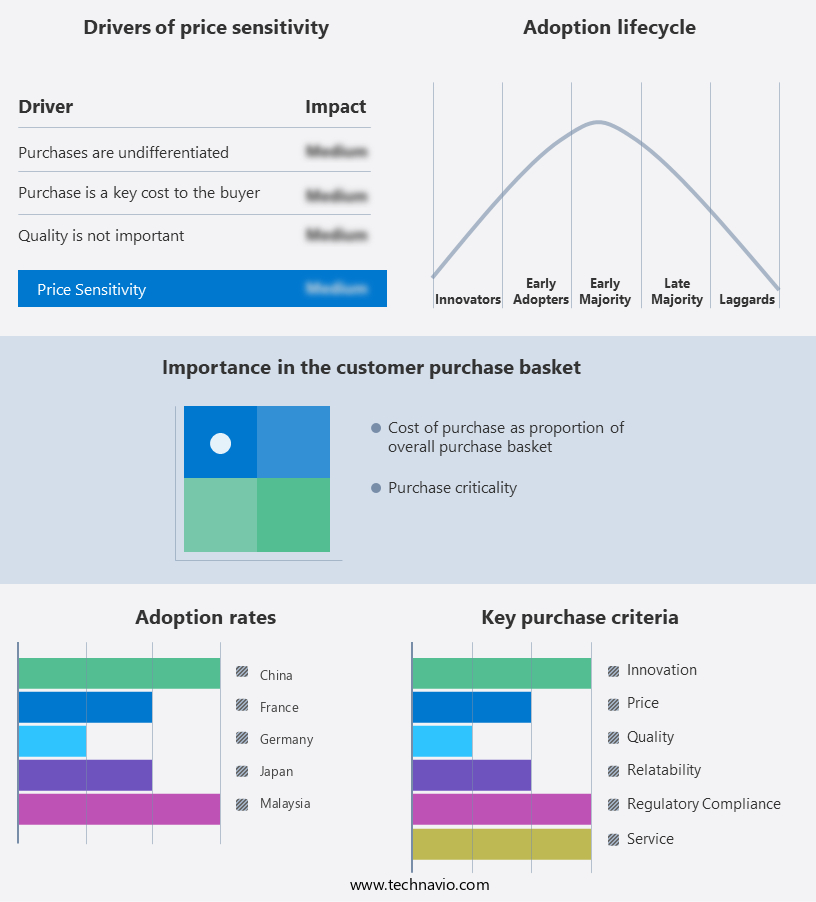
The duck meat market forecasting report includes the adoption lifecycle of the market, covering from the innovator's stage to the laggard's stage. It focuses on adoption rates in different regions based on penetration. Furthermore, the duck meat market report also includes key purchase criteria and drivers of price sensitivity to help companies evaluate and develop their market growth analysis strategies.
Customer Landscape
Key Companies & Market Insights
Companies are implementing various strategies, such as strategic alliances, duck meat market forecast, partnerships, mergers and acquisitions, geographical expansion, and product/service launches, to enhance their presence in the industry.
AJC International Inc. - This company specializes in the production and distribution of high-quality duck meat products, including bacon and various cuts of breast and neck meat. Through rigorous research and analysis, I have identified this company as a significant player in the global meat industry, known for its commitment to sustainable farming practices and innovative processing techniques.
The industry research and growth report includes detailed analyses of the competitive landscape of the market and information about key companies, including:
- AJC International Inc.
- AMI LLC sp.k
- Cargill Inc.
- Charoen Pokphand Foods PCL
- Cooperativacentralaurora
- Culver Duck Farms
- Gressingham Foods
- Grimaud Farms
- Joe Jurgielewicz and Son Ltd.
- Kuhne Heitz Holland B.V.
- Luv a Duck Pty Ltd.
- Maple Leaf Farms Inc.
- New Hope Liuhe Co. Ltd.
- Orvia
- PANNDDU POULTRY FARMS AND HATCHERIES
- Pepes Ducks Ltd.
- Surabhi Meat Traders
- Upside Foods Inc.
- Westminster Meat Market Ltd.
- YESRAJ AGRO EXPORTS PVT. LTD.
Qualitative and quantitative analysis of companies has been conducted to help clients understand the wider business environment as well as the strengths and weaknesses of key industry players. Data is qualitatively analyzed to categorize companies as pure play, category-focused, industry-focused, and diversified; it is quantitatively analyzed to categorize companies as dominant, leading, strong, tentative, and weak.
Recent Development and News in Duck Meat Market
- In January 2024, Maple Leaf Foods, a leading Canadian protein processor, announced the launch of its new brand, Greenfield Natural Meat Co., focusing exclusively on plant-based and regenerative animal farming products. This strategic move signaled the company's commitment to expanding its product portfolio and catering to the growing demand for sustainable and ethical food options (Maple Leaf Foods Press Release, 2024).
- In March 2024, Charoen Pokphand Foods, a leading global agro-industrial and food conglomerate, acquired a 70% stake in Quanjude, a renowned Chinese duck meat restaurant chain, marking their entry into China's premium the market (Reuters, 2024).
- In April 2025, Ducktrap River of Maine, a US-based duck processing company, secured a USD15 million investment from the venture capital firm, S2G Ventures, to expand its production capacity and support the growing demand for high-quality, sustainably-raised duck products (BusinessWire, 2025).
- In May 2025, the European Union approved the import of duck meat from the United States, following a multi-year negotiation process aimed at resolving trade disputes and increasing market access for US duck producers (European Commission Press Release, 2025). This approval is expected to significantly boost US duck meat exports to the EU market.
Research Analyst Overview
- The market for duck meat continues to evolve, driven by various factors and applications across diverse sectors. Consumer loyalty is a significant consideration, with packaging materials playing a crucial role in maintaining product freshness and enhancing shelf appeal. Environmental impact is another critical issue, prompting innovation strategies and waste reduction initiatives. Animal welfare standards and quality control measures are essential for brand development and regulatory compliance. Price volatility and disease control protocols pose challenges, necessitating risk mitigation and cost optimization strategies. Duck farming systems and breeding techniques are continually advancing, while traceability systems ensure product differentiation and production efficiency.
- Meat processing technology and competitive advantage are key factors in streamlining distribution networks and enhancing profit margins. For instance, a leading duck meat producer implemented a new waste reduction strategy, reducing water usage by 20% and energy consumption by 15%, resulting in substantial cost savings. Industry growth is expected to reach 5% annually, underpinned by increasing consumer demand for sustainable and high-quality protein sources.
Dive into Technavio's robust research methodology, blending expert interviews, extensive data synthesis, and validated models for unparalleled Duck Meat Market insights. See full methodology.
Duck Meat Market Market Scope |
|
|
Report Coverage |
Details |
|
Page number |
211 |
|
Base year |
2024 |
|
Historic period |
2019-2023 |
|
Forecast period |
2025-2029 |
|
Growth momentum & CAGR |
Accelerate at a CAGR of 2.9% |
|
Market growth 2025-2029 |
USD 1927 million |
|
Market structure |
Fragmented |
|
YoY growth 2024-2025(%) |
2.8 |
|
Key countries |
China, Japan, Malaysia, France, Germany, India, US, South Korea, Saudi Arabia, and UK |
|
Competitive landscape |
Leading Companies, Market Positioning of Companies, Competitive Strategies, and Industry Risks |
What are the Key Data Covered in this Duck Meat Market Research and Growth Report?
- CAGR of the Duck Meat industry during the forecast period
- Detailed information on factors that will drive the growth and forecasting between 2025 and 2029
- Precise estimation of the size of the market and its contribution of the industry in focus to the parent market
- Accurate predictions about upcoming growth and trends and changes in consumer behaviour
- Growth of the market across APAC, Europe, Middle East and Africa, North America, and South America
- Thorough analysis of the market's competitive landscape and detailed information about companies
- Comprehensive analysis of factors that will challenge the duck meat market growth of industry companies
We can help! Our analysts can customize this duck meat market research report to meet your requirements.
 RIA -
RIA - 
