Benelux E-bike Market Analysis - Size and Forecast 2023-2027

Benelux E-bike Market Analysis - Size and Forecast 2023-2027

Published: Mar 2023 147 Pages SKU: IRTNTR71134

Market Overview at a Glance

$887 units
Market Opportunity
16%
CAGR
14.42
YoY growth 2022-2023(%)

E-bike Market in Benelux Size 2023-2027

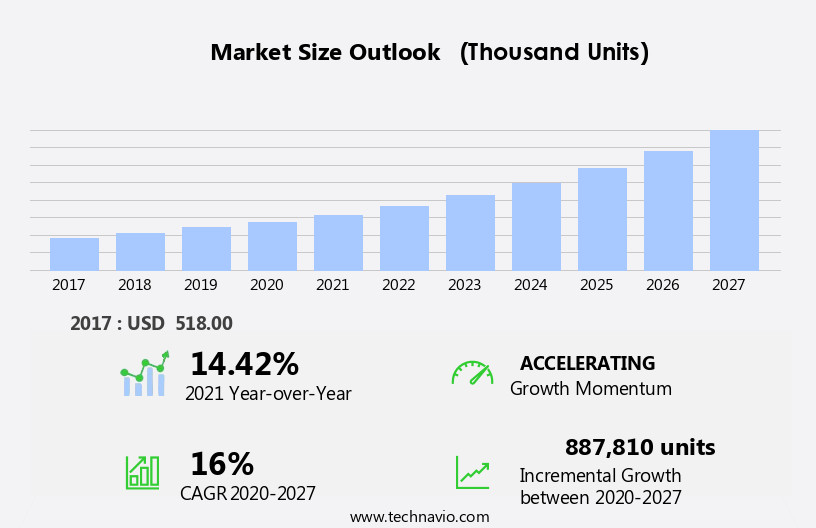
The e-bike market in benelux size is forecast to increase by 887,810 units, at a CAGR of 16% between 2022 and 2027.

  • The market is witnessing significant growth, driven primarily by the declining cost of Li-ion batteries. This cost reduction has made e-bikes increasingly affordable for consumers, broadening their appeal beyond the traditional cycling demographic. Additionally, the rising popularity of connected e-bikes, which offer features such as GPS tracking, smartphone integration, and real-time analytics, is further fueling market growth. However, the lack of adequate infrastructure, including charging stations and bike lanes, poses a significant challenge. Addressing this infrastructure gap will be crucial for market expansion and ensuring the long-term success of e-bike manufacturers and retailers in the Benelux region.
  • Companies seeking to capitalize on these opportunities should focus on developing innovative solutions to address infrastructure challenges and cater to the evolving needs of tech-savvy consumers.

What will be the Size of the E-bike Market in Benelux during the forecast period?

E-bike Market in Benelux Size

Explore in-depth regional segment analysis with market size data - historical 2017-2021 and forecasts 2023-2027 - in the full report.  
Request Free Sample

The e-bike market in the Benelux region continues to evolve, driven by various dynamic factors. Battery range and energy efficiency are key considerations for consumers, leading to advancements in lithium-ion batteries and innovative charging solutions. Brand loyalty is a significant factor, with users showing preference for specific brands based on user experience, display units, and pedal assist levels. E-bike rentals and bike sharing programs have gained popularity, offering flexible mobility solutions for urban commuters. The market is witnessing a shift towards mid-drive motors and disc brakes for improved performance and safety. Cargo racks and suspension systems cater to the growing demand for e-bikes as practical transportation options.

Environmental impact and price points are crucial factors influencing consumer decisions. Competitive advantage lies in product differentiation, with brands focusing on carbon fiber frames, internal hub gears, and suspension systems to attract customers. Online sales and repair services are essential components of the evolving e-bike market, ensuring customer satisfaction and convenience. The supply chain is undergoing transformation, with components sourcing and distribution channels adapting to meet the increasing demand for e-bikes. The innovation cycles are shortening, driven by technological advancements and changing consumer preferences. The e-bike market in the Benelux region is an exciting space, with continuous unfolding of market activities and evolving patterns.

How is this E-bike in Benelux Industry segmented?

The e-bike in benelux industry research report provides comprehensive data (region-wise segment analysis), with forecasts and estimates in "USD units" for the period 2023-2027, as well as historical data from 2017-2021 for the following segments.

  • Technology
    • Lithium-ion battery
    • Sealed lead acid battery
  • Geography
    • Europe
      • Belgium
      • Luxembourg
      • The Netherlands

By Technology Insights

The lithium-ion battery segment is estimated to witness significant growth during the forecast period.

The market exhibits dynamic trends, with lithium-ion batteries playing a pivotal role due to their high energy density. These batteries, consisting of lightweight lithium and carbon electrodes, facilitate long-lasting power and efficient energy transfer. Consumer preferences lean towards motor powers ranging from 250W to 500W for optimal performance. The supply chain ensures seamless distribution of components, including carbon fiber frames, mid-drive motors, and disc brakes, through various channels. E-bike manufacturers prioritize product differentiation through innovative gearing systems, such as internal hub gears and pedal assist levels, catering to diverse consumer needs. Online sales and repair services enhance convenience, while energy efficiency and battery range are key selling points.

Bike sharing programs and e-bike rentals contribute to market penetration and technology adoption, fostering urban mobility. Brand loyalty is a significant factor, with consumers valuing user experience and safety standards. Top speeds of up to 45 km/h and suspension systems cater to various terrains. Delivery services and marketing strategies ensure swift distribution and customer satisfaction. Tire size and type, cargo racks, and braking systems further add to the product's versatility. E-bikes' environmental impact is a growing concern, with aluminum alloy and hub motors being increasingly adopted for their sustainability. The market's competitive advantage lies in continuous innovation cycles and customer-centric offerings.

Lithium-ion batteries' charging time and price points remain crucial factors influencing consumer decisions.

E-bike Market in Benelux Size

Request Free Sample

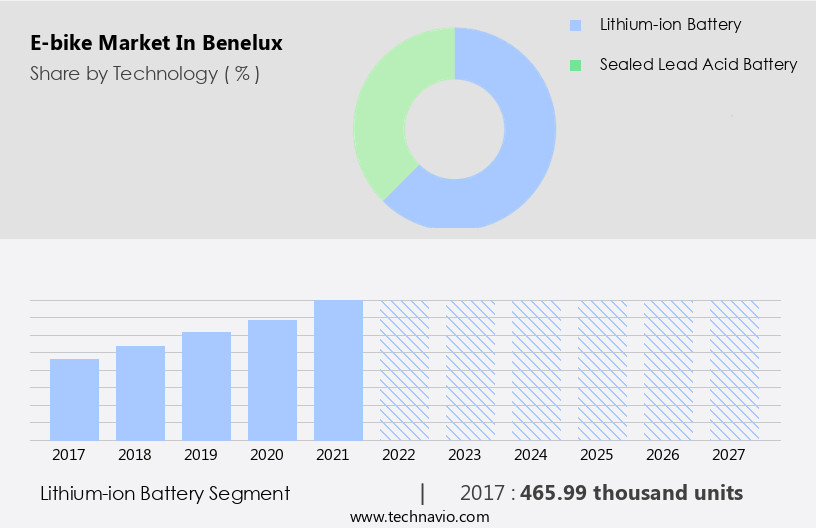
The Lithium-ion battery segment was valued at USD 465.99 units in 2017 and showed a gradual increase during the forecast period.

Regional Analysis

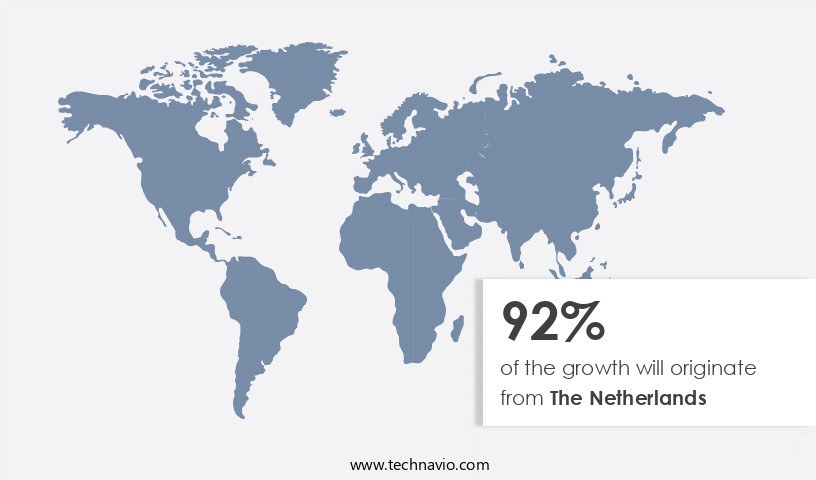
The Netherlands is estimated to contribute 92% to the growth of the global market during the forecast period. Technavio's analysts have elaborately explained the regional trends and drivers that shape the market during the forecast period.

E-bike Market in Benelux Share by Geography

 Request Free Sample

The market, with a significant focus on the Netherlands, experiences substantial growth due to increasing consumer preference for these vehicles as a sustainable and efficient mode of urban mobility. Motor power and electric assist systems have become essential features, driving demand for e-bikes. The supply chain is streamlined with advancements in carbon fiber frames, mid-drive motors, and lithium-ion batteries. Consumers prioritize energy efficiency, long battery range, and user experience, leading to product differentiation through features like pedal assist levels and suspension systems. Online sales and repair services are gaining popularity, while e-bike rentals and bike sharing programs cater to diverse target audiences.

Brands leverage marketing strategies to build brand loyalty, with competition intensifying through innovation cycles. Safety standards, user reviews, and price points further influence consumer decision-making. Hub motors and gearing systems, including internal hub gears, ensure smooth riding experiences. Tire size and type, top speed, and cargo racks cater to various use cases. The market penetration of e-bikes in the Netherlands is high, with a significant portion used for commuting, particularly among elderly demographics. E-bikes' environmental impact and technology adoption continue to shape the market dynamics.

Market Dynamics

Our researchers analyzed the data with 2022 as the base year, along with the key drivers, trends, and challenges. A holistic analysis of drivers will help companies refine their marketing strategies to gain a competitive advantage.

What are the key market drivers leading to the rise in the adoption of E-bike in Benelux Industry?

  • The significant decrease in the cost of Li-ion batteries serves as the primary driving force behind the market's growth. 
  • In the Benelux market, motor power is a significant factor driving the growth of the e-bike industry. The region's e-bike market is witnessing a shift towards Li-ion batteries, which offer higher energy efficiency compared to traditional lead-acid batteries. Although lead-acid batteries are still widely used due to their lower cost, the declining price of Li-ion batteries is making them increasingly attractive. This trend is particularly noticeable among bike-sharing companies, which require high-performance e-bikes. The supply chain for e-bikes in Benelux is undergoing transformation, with an increasing focus on product differentiation. Throttle control and internal hub gears are becoming popular features among consumers.
  • Carbon fiber frames offer a competitive advantage in terms of weight reduction and durability. Charging time is another critical factor influencing consumer preferences. Li-ion batteries offer faster charging times compared to lead-acid batteries, making them more convenient for urban commuters. Online sales are also gaining popularity, as consumers seek the convenience of home delivery and easy returns. Repair services are essential for maintaining the longevity of e-bikes. As the market grows, there is a growing need for specialized repair services to cater to the unique requirements of e-bikes. Overall, the Benelux e-bike market is poised for growth, driven by advances in battery technology, consumer preferences, and the growing popularity of e-mobility solutions.

What are the market trends shaping the E-bike in Benelux Industry?

  • The rising popularity of connected e-bikes represents a significant market trend in the transportation industry. These advanced bicycles, equipped with internet connectivity, offer enhanced functionality and convenience for users.
  • The market has experienced significant growth due to the increasing popularity of e-bike rentals and bike sharing programs. Connected e-bikes, which enable real-time tracking of battery range and location, have become integral to these services. This technology allows bike sharing companies to monitor battery status for timely maintenance and ensures an optimal user experience. Brands prioritize features such as disc brakes, gearing systems, and cargo racks to cater to diverse user needs. Environmental concerns have also influenced the market, with e-bikes offering a greener alternative to traditional vehicles.
  • Connected e-bikes are available at various price points, making them accessible to a wider audience. Yamaha Motor Europe SA is an example of a brand offering advanced features, including an integrated speed sensor for a natural power assist. The integration of technology into e-bikes is transforming urban mobility and enhancing the bike-sharing business model.

What challenges does the E-bike in Benelux Industry face during its growth?

  • The insufficient infrastructure represents a significant obstacle to the expansion and growth of the industry. 
  • The e-bike market in the Benelux region is experiencing notable growth due to increasing delivery services and innovative marketing strategies. Mid-drive motors and pedal assist levels have gained popularity among consumers, driving demand for these electric bikes. Tire size is another consideration, with larger tires providing better stability and comfort. Lithium-ion batteries are the preferred choice for powering e-bikes due to their long-lasting capacity and lightweight design. However, challenges persist in the market. The lack of dedicated infrastructure, such as bike lanes and charging stations, poses a significant barrier to widespread adoption. The need for investment in this area is crucial to meet the growing demand for e-bikes.
  • Additionally, customer satisfaction depends on factors like tire type, top speed, and ease of use. Distribution channels, including both online and offline, must be effectively managed to cater to the diverse needs of consumers. Innovation cycles in the e-bike industry are rapid, requiring continuous research and development to stay competitive.

Exclusive Customer Landscape

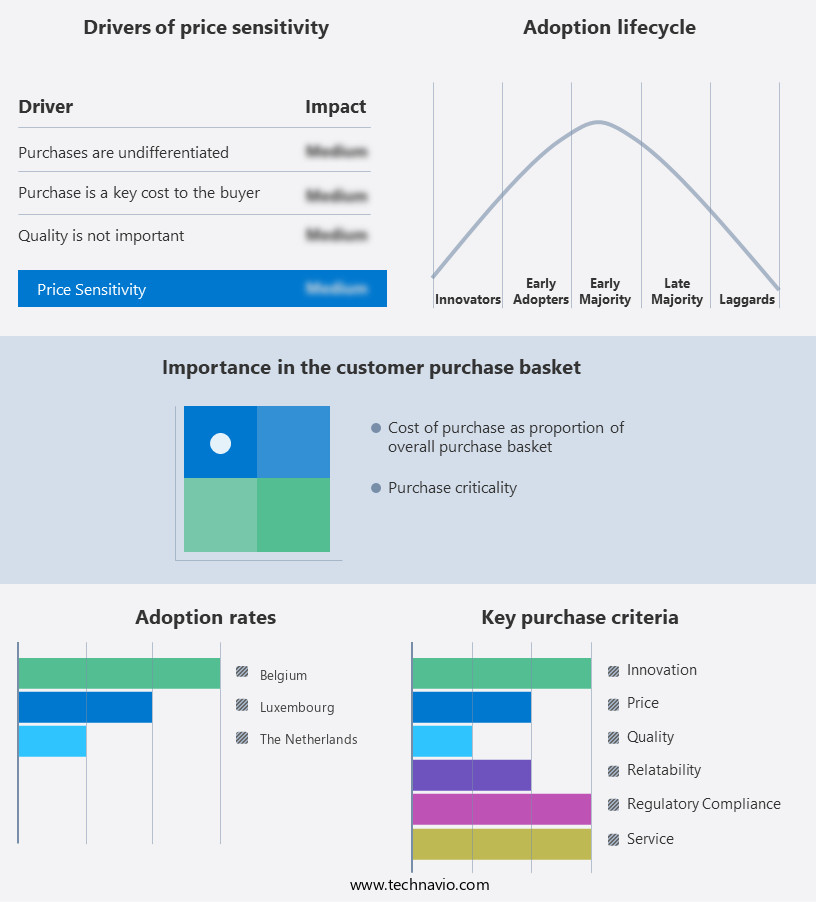
The e-bike market in benelux forecasting report includes the adoption lifecycle of the market, covering from the innovator's stage to the laggard's stage. It focuses on adoption rates in different regions based on penetration. Furthermore, the e-bike market in benelux report also includes key purchase criteria and drivers of price sensitivity to help companies evaluate and develop their market growth analysis strategies.

E-bike Market in Benelux Share by Geography

 Customer Landscape

Key Companies & Market Insights

Companies are implementing various strategies, such as strategic alliances, e-bike market in benelux forecast, partnerships, mergers and acquisitions, geographical expansion, and product/service launches, to enhance their presence in the industry.

Accell Group NV - Thrust vector control systems are a key innovation in solid propellant de-orbit motors, enhancing precision and efficiency in orbital adjustments for satellite repositioning and decommissioning. 

The industry research and growth report includes detailed analyses of the competitive landscape of the market and information about key companies, including:

  • Accell Group NV
  • Amsterdam Bicycle Co.
  • Belgian Bicycle Group
  • Canyon Bicycles GmbH
  • Cowboy SA
  • Georg Fritzmeier GmbH and Co. KG
  • Giant Manufacturing Co. Ltd.
  • Kruitbosch Zwolle BV
  • KSR Group GmbH
  • KWANG YANG MOTOR Co. Ltd.
  • Merida Industry Co. Ltd.
  • Pon Holdings BV
  • QWIC
  • Riese and Muller GmbH
  • SCOTT Sports SA
  • Smart Urban Mobility BV
  • Trek Bicycle Corp.
  • VanMoof BV
  • Yamaha Motor Co. Ltd.
  • Volkswagen AG

Qualitative and quantitative analysis of companies has been conducted to help clients understand the wider business environment as well as the strengths and weaknesses of key industry players. Data is qualitatively analyzed to categorize companies as pure play, category-focused, industry-focused, and diversified; it is quantitatively analyzed to categorize companies as dominant, leading, strong, tentative, and weak.

Recent Development and News in E-bike Market In Benelux

  • In January 2024, Dutch e-bike manufacturer VanMoof announced the launch of its latest product line, the S3 and X3, featuring an integrated motor and a sleek design, making a significant stride in the Benelux e-bike market (VanMoof Press Release, 2024).
  • In March 2024, Belgian e-bike retailer, Bicycle Academy, entered into a strategic partnership with German e-bike manufacturer, Haibike, to expand its product offerings and strengthen its market position (Bicycle Academy Press Release, 2024).
  • In April 2025, Luxembourg-based e-bike startup, GoSwift, secured € 10 million in Series A funding from investors, including Belgian investment firm PMV, to scale its production and expand its presence in the Benelux market (GoSwift Press Release, 2025).
  • In May 2025, the Belgian government introduced a new subsidy program, 'Green Wheels,' offering up to € 2,500 to residents purchasing an e-bike, aiming to reduce carbon emissions and promote sustainable transportation (Belgian Government Press Release, 2025).

Research Analyst Overview

  • The market is witnessing significant growth, driven by the expansion of electric vehicle infrastructure and government incentives. Charging networks and parking facilities are becoming increasingly common, ensuring convenient usage for consumers. Security features, such as GPS trackers and theft prevention systems, add to the appeal of e-bikes. Data analytics and smartphone integration enable users to monitor power consumption, fitness tracking, and traffic management. Government initiatives, including tax credits and lease programs, are spurring adoption. Air quality improvements and public health benefits are also key factors, as e-bikes offer a sustainable and active transportation alternative. The industry is prioritizing quality control and safety education to address consumer concerns.
  • Financing options, subscription models, and motor controllers are shaping the market's business landscape. Smart city integration, bike lanes, and economic impact are additional areas of focus. Battery disposal and aftermarket parts are also under consideration as the market matures. E-bike tours and guided rides offer unique experiences for consumers, further fueling demand.

Dive into Technavio's robust research methodology, blending expert interviews, extensive data synthesis, and validated models for unparalleled E-bike Market in Benelux insights. See full methodology.

Market Scope

Report Coverage

Details

Page number

147

Base year

2022

Historic period

2017-2021

Forecast period

2023-2027

Growth momentum & CAGR

Accelerate at a CAGR of 16%

Market growth 2023-2027

887,810 units

Market structure

Fragmented

YoY growth 2022-2023(%)

14.42

Key countries

The Netherlands, Belgium, and Luxembourg

Competitive landscape

Leading Companies, Market Positioning of Companies, Competitive Strategies, and Industry Risks

Request Free Sample

What are the Key Data Covered in this E-bike Market in Benelux Research and Growth Report?

  • CAGR of the E-bike in Benelux industry during the forecast period
  • Detailed information on factors that will drive the growth and forecasting between 2023 and 2027
  • Precise estimation of the size of the market and its contribution of the industry in focus to the parent market
  • Accurate predictions about upcoming growth and trends and changes in consumer behaviour
  • Growth of the market across Benelux
  • Thorough analysis of the market's competitive landscape and detailed information about companies
  • Comprehensive analysis of factors that will challenge the e-bike market in benelux growth of industry companies

We can help! Our analysts can customize this e-bike market in benelux research report to meet your requirements.

Get in touch

1 Executive Summary

  • 1.1 Market overview
    • Exhibit 01: Executive Summary – Chart on Market Overview
    • Exhibit 02: Executive Summary – Data Table on Market Overview
    • Exhibit 03: Executive Summary – Chart on Country Market Characteristics
    • Exhibit 04: Executive Summary – Chart on Market by Geography
    • Exhibit 05: Executive Summary – Chart on Market Segmentation by Technology
    • Exhibit 06: Executive Summary – Chart on Market Segmentation by Platform
    • Exhibit 07: Executive Summary – Chart on Incremental Growth
    • Exhibit 08: Executive Summary – Data Table on Incremental Growth
    • Exhibit 09: Executive Summary – Chart on Vendor Market Positioning

2 Market Landscape

  • 2.1 Market ecosystem
    • Exhibit 10: Parent market
    • Exhibit 11: Market Characteristics

3 Market Sizing

  • 3.1 Market definition
    • Exhibit 12: Offerings of vendors included in the market definition
  • 3.2 Market segment analysis
    • Exhibit 13: Market segments
  • 3.3 Market size 2022
    • 3.4 Market outlook: Forecast for 2022-2027
      • Exhibit 14: Chart on Benelux - Market size and forecast 2022-2027 (thousand units)
      • Exhibit 15: Data Table on Benelux - Market size and forecast 2022-2027 (thousand units)
      • Exhibit 16: Chart on Benelux: Year-over-year growth 2022-2027 (%)
      • Exhibit 17: Data Table on Benelux: Year-over-year growth 2022-2027 (%)

    4 Historic Market Size

    • 4.1 E-bike market in Benelux 2017 - 2021
      • Exhibit 18: Historic Market Size – Data Table on E-bike market in Benelux 2017 - 2021 (thousand units)
    • 4.2 Technology Segment Analysis 2017 - 2021
      • Exhibit 19: Historic Market Size – Technology Segment 2017 - 2021 (thousand units)
    • 4.3 Platform Segment Analysis 2017 - 2021
      • Exhibit 20: Historic Market Size – Platform Segment 2017 - 2021 (thousand units)
    • 4.4 Geography Segment Analysis 2017 - 2021
      • Exhibit 21: Historic Market Size – Geography Segment 2017 - 2021 (thousand units)

    5 Five Forces Analysis

    • 5.1 Five forces summary
      • Exhibit 22: Five forces analysis - Comparison between 2022 and 2027
    • 5.2 Bargaining power of buyers
      • Exhibit 23: Chart on Bargaining power of buyers – Impact of key factors 2022 and 2027
    • 5.3 Bargaining power of suppliers
      • Exhibit 24: Bargaining power of suppliers – Impact of key factors in 2022 and 2027
    • 5.4 Threat of new entrants
      • Exhibit 25: Threat of new entrants – Impact of key factors in 2022 and 2027
    • 5.5 Threat of substitutes
      • Exhibit 26: Threat of substitutes – Impact of key factors in 2022 and 2027
    • 5.6 Threat of rivalry
      • Exhibit 27: Threat of rivalry – Impact of key factors in 2022 and 2027
    • 5.7 Market condition
      • Exhibit 28: Chart on Market condition - Five forces 2022 and 2027

    6 Market Segmentation by Technology

    • 6.1 Market segments
      • Exhibit 29: Chart on Technology - Market share 2022-2027 (%)
      • Exhibit 30: Data Table on Technology - Market share 2022-2027 (%)
    • 6.2 Comparison by Technology
      • Exhibit 31: Chart on Comparison by Technology
      • Exhibit 32: Data Table on Comparison by Technology
    • 6.3 Lithium-ion battery - Market size and forecast 2022-2027
      • Exhibit 33: Chart on Lithium-ion battery - Market size and forecast 2022-2027 (thousand units)
      • Exhibit 34: Data Table on Lithium-ion battery - Market size and forecast 2022-2027 (thousand units)
      • Exhibit 35: Chart on Lithium-ion battery - Year-over-year growth 2022-2027 (%)
      • Exhibit 36: Data Table on Lithium-ion battery - Year-over-year growth 2022-2027 (%)
    • 6.4 Sealed lead acid battery - Market size and forecast 2022-2027
      • Exhibit 37: Chart on Sealed lead acid battery - Market size and forecast 2022-2027 (thousand units)
      • Exhibit 38: Data Table on Sealed lead acid battery - Market size and forecast 2022-2027 (thousand units)
      • Exhibit 39: Chart on Sealed lead acid battery - Year-over-year growth 2022-2027 (%)
      • Exhibit 40: Data Table on Sealed lead acid battery - Year-over-year growth 2022-2027 (%)
    • 6.5 Market opportunity by Technology
      • Exhibit 41: Market opportunity by Technology (thousand units)
      • Exhibit 42: Data Table on Market opportunity by Technology

    7 Market Segmentation by Platform

    • 7.1 Market segments
      • Exhibit 43: Chart on Platform - Market share 2022-2027 (%)
      • Exhibit 44: Data Table on Platform - Market share 2022-2027 (%)
    • 7.2 Comparison by Platform
      • Exhibit 45: Chart on Comparison by Platform
      • Exhibit 46: Data Table on Comparison by Platform
    • 7.3 Urban e-bikes - Market size and forecast 2022-2027
      • Exhibit 47: Chart on Urban e-bikes - Market size and forecast 2022-2027 (thousand units)
      • Exhibit 48: Data Table on Urban e-bikes - Market size and forecast 2022-2027 (thousand units)
      • Exhibit 49: Chart on Urban e-bikes - Year-over-year growth 2022-2027 (%)
      • Exhibit 50: Data Table on Urban e-bikes - Year-over-year growth 2022-2027 (%)
    • 7.4 Trekking e-bikes - Market size and forecast 2022-2027
      • Exhibit 51: Chart on Trekking e-bikes - Market size and forecast 2022-2027 (thousand units)
      • Exhibit 52: Data Table on Trekking e-bikes - Market size and forecast 2022-2027 (thousand units)
      • Exhibit 53: Chart on Trekking e-bikes - Year-over-year growth 2022-2027 (%)
      • Exhibit 54: Data Table on Trekking e-bikes - Year-over-year growth 2022-2027 (%)
    • 7.5 eMTBs - Market size and forecast 2022-2027
      • Exhibit 55: Chart on eMTBs - Market size and forecast 2022-2027 (thousand units)
      • Exhibit 56: Data Table on eMTBs - Market size and forecast 2022-2027 (thousand units)
      • Exhibit 57: Chart on eMTBs - Year-over-year growth 2022-2027 (%)
      • Exhibit 58: Data Table on eMTBs - Year-over-year growth 2022-2027 (%)
    • 7.6 Cargo e-bikes - Market size and forecast 2022-2027
      • Exhibit 59: Chart on Cargo e-bikes - Market size and forecast 2022-2027 (thousand units)
      • Exhibit 60: Data Table on Cargo e-bikes - Market size and forecast 2022-2027 (thousand units)
      • Exhibit 61: Chart on Cargo e-bikes - Year-over-year growth 2022-2027 (%)
      • Exhibit 62: Data Table on Cargo e-bikes - Year-over-year growth 2022-2027 (%)
    • 7.7 Others - Market size and forecast 2022-2027
      • Exhibit 63: Chart on Others - Market size and forecast 2022-2027 (thousand units)
      • Exhibit 64: Data Table on Others - Market size and forecast 2022-2027 (thousand units)
      • Exhibit 65: Chart on Others - Year-over-year growth 2022-2027 (%)
      • Exhibit 66: Data Table on Others - Year-over-year growth 2022-2027 (%)
    • 7.8 Market opportunity by Platform
      • Exhibit 67: Market opportunity by Platform (thousand units)
      • Exhibit 68: Data Table on Market opportunity by Platform

    8 Customer Landscape

    • 8.1 Customer landscape overview
      • Exhibit 69: Analysis of price sensitivity, lifecycle, customer purchase basket, adoption rates, and purchase criteria

    9 Geographic Landscape

    • 9.1 Geographic segmentation
      • Exhibit 70: Chart on Market share by geography - 2022-2027 (%)
      • Exhibit 71: Data Table on Market share by geography - 2022-2027 (%)
    • 9.2 Geographic comparison
      • Exhibit 72: Chart on Geographic comparison
      • Exhibit 73: Data Table on Geographic comparison
    • 9.3 The Netherlands - Market size and forecast 2022-2027
      • Exhibit 74: Chart on The Netherlands - Market size and forecast 2022-2027 (thousand units)
      • Exhibit 75: Data Table on The Netherlands - Market size and forecast 2022-2027 (thousand units)
      • Exhibit 76: Chart on The Netherlands - Year-over-year growth 2022-2027 (%)
      • Exhibit 77: Data Table on The Netherlands - Year-over-year growth 2022-2027 (%)
    • 9.4 Belgium - Market size and forecast 2022-2027
      • Exhibit 78: Chart on Belgium - Market size and forecast 2022-2027 (thousand units)
      • Exhibit 79: Data Table on Belgium - Market size and forecast 2022-2027 (thousand units)
      • Exhibit 80: Chart on Belgium - Year-over-year growth 2022-2027 (%)
      • Exhibit 81: Data Table on Belgium - Year-over-year growth 2022-2027 (%)
    • 9.5 Luxembourg - Market size and forecast 2022-2027
      • Exhibit 82: Chart on Luxembourg - Market size and forecast 2022-2027 (thousand units)
      • Exhibit 83: Data Table on Luxembourg - Market size and forecast 2022-2027 (thousand units)
      • Exhibit 84: Chart on Luxembourg - Year-over-year growth 2022-2027 (%)
      • Exhibit 85: Data Table on Luxembourg - Year-over-year growth 2022-2027 (%)
    • 9.6 Market opportunity by geography
      • Exhibit 86: Market opportunity by geography (thousand units)
      • Exhibit 87: Data Table on Market opportunity by geography (thousand units)

    10 Drivers, Challenges, and Trends

    • 10.1 Market drivers
      • 10.2 Market challenges
        • 10.3 Impact of drivers and challenges
          • Exhibit 88: Impact of drivers and challenges in 2022 and 2027
        • 10.4 Market trends

          11 Vendor Landscape

          • 11.1 Overview
            • 11.2 Vendor landscape
              • Exhibit 89: Overview on Criticality of inputs and Factors of differentiation
            • 11.3 Landscape disruption
              • Exhibit 90: Overview on factors of disruption
            • 11.4 Industry risks
              • Exhibit 91: Impact of key risks on business

            12 Vendor Analysis

            • 12.1 Vendors covered
              • Exhibit 92: Vendors covered
            • 12.2 Market positioning of vendors
              • Exhibit 93: Matrix on vendor position and classification
            • 12.3 Accell Group NV
              • Exhibit 94: Accell Group NV - Overview
              • Exhibit 95: Accell Group NV - Business segments
              • Exhibit 96: Accell Group NV - Key offerings
              • Exhibit 97: Accell Group NV - Segment focus
            • 12.4 Belgian Bicycle Group
              • Exhibit 98: Belgian Bicycle Group - Overview
              • Exhibit 99: Belgian Bicycle Group - Product / Service
              • Exhibit 100: Belgian Bicycle Group - Key offerings
            • 12.5 Georg Fritzmeier GmbH and Co. KG
              • Exhibit 101: Georg Fritzmeier GmbH and Co. KG - Overview
              • Exhibit 102: Georg Fritzmeier GmbH and Co. KG - Product / Service
              • Exhibit 103: Georg Fritzmeier GmbH and Co. KG - Key offerings
            • 12.6 Giant Manufacturing Co. Ltd.
              • Exhibit 104: Giant Manufacturing Co. Ltd. - Overview
              • Exhibit 105: Giant Manufacturing Co. Ltd. - Product / Service
              • Exhibit 106: Giant Manufacturing Co. Ltd. - Key offerings
            • 12.7 Kruitbosch Zwolle BV
              • Exhibit 107: Kruitbosch Zwolle BV - Overview
              • Exhibit 108: Kruitbosch Zwolle BV - Product / Service
              • Exhibit 109: Kruitbosch Zwolle BV - Key offerings
            • 12.8 KSR Group GmbH
              • Exhibit 110: KSR Group GmbH - Overview
              • Exhibit 111: KSR Group GmbH - Product / Service
              • Exhibit 112: KSR Group GmbH - Key offerings
            • 12.9 KWANG YANG MOTOR Co. Ltd.
              • Exhibit 113: KWANG YANG MOTOR Co. Ltd. - Overview
              • Exhibit 114: KWANG YANG MOTOR Co. Ltd. - Product / Service
              • Exhibit 115: KWANG YANG MOTOR Co. Ltd. - Key offerings
            • 12.10 Merida Industry Co. Ltd.
              • Exhibit 116: Merida Industry Co. Ltd. - Overview
              • Exhibit 117: Merida Industry Co. Ltd. - Business segments
              • Exhibit 118: Merida Industry Co. Ltd. - Key offerings
              • Exhibit 119: Merida Industry Co. Ltd. - Segment focus
            • 12.11 Pon Holdings BV
              • Exhibit 120: Pon Holdings BV - Overview
              • Exhibit 121: Pon Holdings BV - Product / Service
              • Exhibit 122: Pon Holdings BV - Key offerings
            • 12.12 QWIC
              • Exhibit 123: QWIC - Overview
              • Exhibit 124: QWIC - Product / Service
              • Exhibit 125: QWIC - Key offerings
            • 12.13 Riese and Muller GmbH
              • Exhibit 126: Riese and Muller GmbH - Overview
              • Exhibit 127: Riese and Muller GmbH - Product / Service
              • Exhibit 128: Riese and Muller GmbH - Key offerings
            • 12.14 SCOTT Sports SA
              • Exhibit 129: SCOTT Sports SA - Overview
              • Exhibit 130: SCOTT Sports SA - Product / Service
              • Exhibit 131: SCOTT Sports SA - Key offerings
            • 12.15 Smart Urban Mobility BV
              • Exhibit 132: Smart Urban Mobility BV - Overview
              • Exhibit 133: Smart Urban Mobility BV - Product / Service
              • Exhibit 134: Smart Urban Mobility BV - Key offerings
            • 12.16 Volkswagen AG
              • Exhibit 135: Volkswagen AG - Overview
              • Exhibit 136: Volkswagen AG - Business segments
              • Exhibit 137: Volkswagen AG - Key offerings
              • Exhibit 138: Volkswagen AG - Segment focus
            • 12.17 Yamaha Motor Co. Ltd.
              • Exhibit 139: Yamaha Motor Co. Ltd. - Overview
              • Exhibit 140: Yamaha Motor Co. Ltd. - Business segments
              • Exhibit 141: Yamaha Motor Co. Ltd. - Key news
              • Exhibit 142: Yamaha Motor Co. Ltd. - Key offerings
              • Exhibit 143: Yamaha Motor Co. Ltd. - Segment focus

            13 Appendix

            • 13.1 Scope of the report
              • 13.2 Inclusions and exclusions checklist
                • Exhibit 144: Inclusions checklist
                • Exhibit 145: Exclusions checklist
              • 13.3 Currency conversion rates for US$
                • Exhibit 146: Currency conversion rates for US$
              • 13.4 Research methodology
                • Exhibit 147: Research methodology
                • Exhibit 148: Validation techniques employed for market sizing
                • Exhibit 149: Information sources
              • 13.5 List of abbreviations
                • Exhibit 150: List of abbreviations

              Research Methodology

              Technavio presents a detailed picture of the market by way of study, synthesis, and summation of data from multiple sources. The analysts have presented the various facets of the market with a particular focus on identifying the key industry influencers. The data thus presented is comprehensive, reliable, and the result of extensive research, both primary and secondary.

              INFORMATION SOURCES

              Primary sources

              • Manufacturers and suppliers
              • Channel partners
              • Industry experts
              • Strategic decision makers

              Secondary sources

              • Industry journals and periodicals
              • Government data
              • Financial reports of key industry players
              • Historical data
              • Press releases

              DATA ANALYSIS

              Data Synthesis

              • Collation of data
              • Estimation of key figures
              • Analysis of derived insights

              Data Validation

              • Triangulation with data models
              • Reference against proprietary databases
              • Corroboration with industry experts

              REPORT WRITING

              Qualitative

              • Market drivers
              • Market challenges
              • Market trends
              • Five forces analysis

              Quantitative

              • Market size and forecast
              • Market segmentation
              • Geographical insights
              • Competitive landscape

              Interested in this report?

              Get your sample now to see our research methodology and insights!

              Download Now

              Frequently Asked Questions

              E-bikein Benelux market growth will increase by 887,810 units during 2023-2027.

              The E-bikein Benelux market is expected to grow at a CAGR of 16% during 2023-2027.

              E-bikein Benelux market is segmented by Technology( Lithium-ion battery, Sealed lead acid battery) Platform( Urban e-bikes, Trekking e-bikes, eMTBs, Cargo e-bikes, Others)

              Accell Group NV, Amsterdam Bicycle Co., Belgian Bicycle Group, Canyon Bicycles GmbH, Cowboy SA, Georg Fritzmeier GmbH and Co. KG, Giant Manufacturing Co. Ltd., Kruitbosch Zwolle BV, KSR Group GmbH, KWANG YANG MOTOR Co. Ltd., Merida Industry Co. Ltd., Pon Holdings BV, QWIC, Riese and Muller GmbH, SCOTT Sports SA, Smart Urban Mobility BV, Trek Bicycle Corp., VanMoof BV, Yamaha Motor Co. Ltd., Volkswagen AG are a few of the key vendors in the E-bikein Benelux market.

              The Netherlands will register the highest growth rate of 92% among the other regions. Therefore, the E-bikein Benelux market in The Netherlands is expected to garner significant business opportunities for the vendors during the forecast period.

              The Netherlands, Belgium, Luxembourg

              • Declining cost of Li-ion BatteriesBatteries are a key cost component in the manufacture of e-bikes. Lead-acid batteries are widely used in e-bikes across the Benelux region is the driving factor this market.
              • owing to the high cost of Li-ion batteries that are more efficient. However is the driving factor this market.
              • the cost of Li-ion batteries has been declining owing to industrial and technological advances is the driving factor this market.
              • such as improvements in mining practices and the optimal utilization of resources. Further is the driving factor this market.
              • the growth in the adoption of EVs in the region has provided economies of scale benefits to Li-ion battery manufacturers is the driving factor this market.
              • which has reduced the cost of Li-ion batteries and made them more feasible for use in e-bikes. Hence is the driving factor this market.
              • the use of Li-ion batteries in e-bikes is increasing is the driving factor this market.
              • especially among bike-sharing companies. For instance is the driving factor this market.
              • Royal Dutch Gazelle is the driving factor this market.
              • which is an e-bike manufactures-based in the Netherlands is the driving factor this market.
              • uses Li-ion batteries provided by Bosch in its e-bikes. Similarly is the driving factor this market.
              • major e-bike manufacturers in the region is the driving factor this market.
              • such as Bizbike is the driving factor this market.
              • Bergamont is the driving factor this market.
              • and others is the driving factor this market.
              • mostly use Li-ion batteries in their e-bikes. The rising use of Li-ion batteries enables manufacturers to achieve economies of scale is the driving factor this market.
              • which reduces the cost of Li-ion batteries and is the driving factor this market.
              • consequently is the driving factor this market.
              • drives the growth of the e-bike market in Benelux. The cost of Li-ion batteries has been declining steadily since 2010 is the driving factor this market.
              • and the trend is expected to continue during the forecast period. The declining cost of Li-ion batteries is reducing the cost of production of e-bikes is the driving factor this market.
              • which will increase their sales during the forecast period. The increasing volume of production of Li-ion batteries and improvements in manufacturing efficiency is reducing the cost of Li-ion batteries. For instance is the driving factor this market.
              • the average cost of Li-ion battery packs per kWh was $1 is the driving factor this market.
              • 160 per kWh in 2010 and $151 per kWh in 2022. The decline in the price of battery-grade lithium carbonate and lithium hydroxide is also leading to a decline in the cost of Li-ion batteries. Thus is the driving factor this market.
              • the decline in the cost of Li-ion batteries is expected to drive the growth of the e-bike market in Benelux during the forecast period. is the driving factor this market.

              The E-bikein Benelux market vendors should focus on grabbing business opportunities from the Lithium-ion battery segment as it accounted for the largest market share in the base year.
              RIA - Research AI Assistant
              Ask RIA