Electric Car Market Size 2025-2029
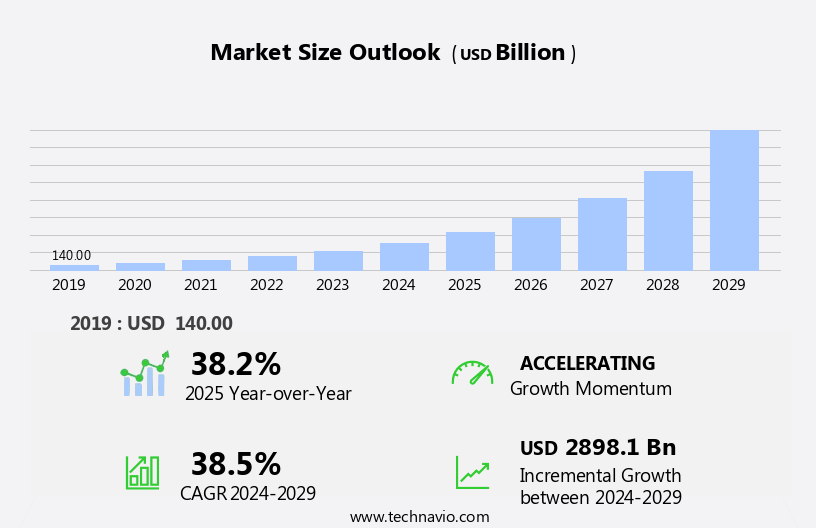
The electric car market size is forecast to increase by USD 2898.1 billion, at a CAGR of 38.5% between 2024 and 2029.
- The market witnesses a surging demand and sales of Battery Electric Vehicles (BEVs) globally, driven by increasing environmental concerns and government initiatives to reduce carbon emissions. This trend is further fueled by the continuous launch of new electric car models across various sectors, including luxury (Tesla Model S) and mass-market (Nissan Leaf) segments. However, the high cost of ownership of BEVs, primarily due to the expensive batteries, poses a significant challenge for market growth. Additionally, the infrastructure development for charging stations and the limited driving range of these vehicles are other obstacles that need to be addressed to accelerate market penetration.
- Companies seeking to capitalize on this market's potential must focus on reducing battery costs and expanding charging infrastructure while offering competitive pricing and improved driving range to attract more consumers.
What will be the Size of the Electric Car Market during the forecast period?

Request Free Sample
The electric vehicle market continues to evolve, driven by advancements in technology and shifting consumer preferences. Electric buses are increasingly adopted in public transportation systems, while electric vehicle policy encourages their use in various sectors. Fire safety and regenerative braking are crucial considerations in the design of these vehicles. Smart cities are integrating electric vehicles into their urban mobility plans, with charging infrastructure becoming a key component. Fuel cell technology and battery technology, including solid-state batteries, are advancing, offering potential solutions to range anxiety and battery life concerns. Commercial electric vehicles, from delivery trucks to utility vehicles, are gaining traction, and the supply chain is adapting to meet the growing demand.
Sustainable transportation and emissions reduction are primary objectives, with micro mobility options like electric scooters and bicycles also gaining popularity. The ongoing evolution of electric vehicle software, including over-the-air updates, and advancements in battery management systems are essential to optimizing performance and efficiency. The integration of electric vehicles into public transportation and workplace charging stations further expands their reach. Electric vehicle manufacturing is adapting to meet the demands of this dynamic market, with a focus on lightweight materials and efficient production processes. The market's continuous unfolding is shaped by government incentives, battery recycling, power electronics, and the development of electric vehicle maintenance and recycling programs.
The electric vehicle landscape is constantly shifting, with new applications and innovations emerging in the realm of electric motorcycles, electric bicycles, and electric trucks.
How is this Electric Car Industry segmented?
The electric car industry research report provides comprehensive data (region-wise segment analysis), with forecasts and estimates in "USD billion" for the period 2025-2029, as well as historical data from 2019-2023 for the following segments.
- Vehicle Type
- Type
- Distribution Channel
- OEMs
- Dealerships
- Online Retail
- Vehicle Class
- Passenger Cars
- Light Commercial Vehicles
- Heavy Commercial Vehicles
- Price Segment
- Economy
- Mid-range
- Premium
- Luxury
- Battery Technology
- Lithium-ion
- Solid-state
- Lithium-iron-phosphate
- Geography
- North America
- Europe
- APAC
- China
- India
- Japan
- South Korea
- Rest of World (ROW)
By Vehicle Type Insights
The bev segment is estimated to witness significant growth during the forecast period.
The Battery Electric Vehicle (BEV) segment is leading the market, fueled by growing environmental consciousness and stricter emission regulations. BEVs, which operate solely on electricity stored in batteries, present a cleaner alternative to conventional vehicles. This trend is reinforced by government incentives and advancements in battery technology, including solid-state and lithium-ion batteries, which enhance range, performance, and affordability. Additionally, the increasing investment in EV charging infrastructure globally supports the expansion of the BEV segment. Hybrid Electric Vehicles (HEVs) and other electric vehicles, such as electric scooters, motorcycles, utility vehicles, buses, trucks, and delivery vehicles, also contribute to the market's growth.
Innovations in electric vehicle software, design, and maintenance, including over-the-air updates, battery management systems, and recycling, further boost market momentum. The integration of electric vehicles into public transportation systems, workplaces, and smart cities, as well as the adoption of fuel cell technology and regenerative braking, are shaping the future of sustainable transportation. The electric vehicle industry's evolution is driven by a commitment to reducing emissions, improving fuel efficiency, and promoting urban mobility while minimizing the environmental impact.

Request Free Sample
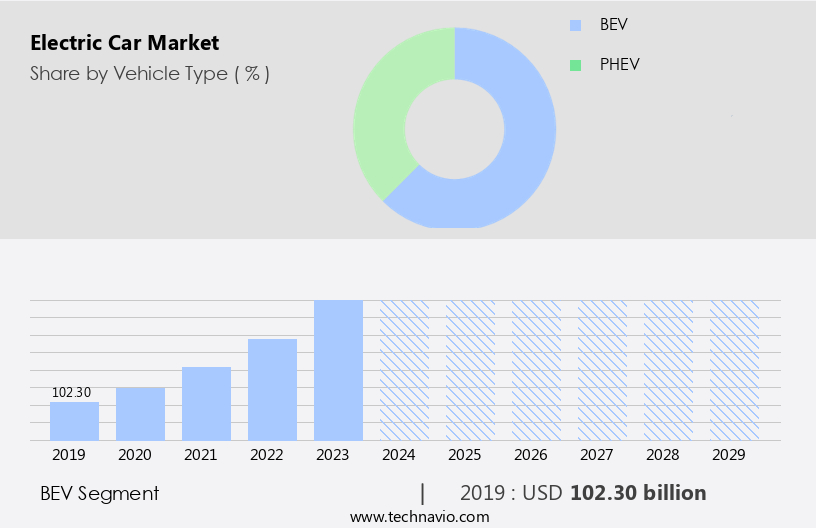
The BEV segment was valued at USD 102.30 billion in 2019 and showed a gradual increase during the forecast period.
Regional Analysis
Europe is estimated to contribute 46% to the growth of the global market during the forecast period.Technavio’s analysts have elaborately explained the regional trends and drivers that shape the market during the forecast period.

Request Free Sample
The market is experiencing significant growth, particularly in the Asia Pacific region. China, in particular, is leading the charge due to increasing sales of commercial vehicles and various government initiatives. Strict carbon emission norms, incentive schemes, and a focus on reducing pollution in densely populated cities like Beijing and Shanghai are driving the market forward. Additionally, the expansion of charging station networks and the participation of both foreign and local Original Equipment Manufacturers (OEMs) are enhancing the efficiency and effectiveness of electric vehicles (EVs) in China. The Chinese government views EVs as an essential tool in decreasing urban air pollution.
Beyond China, the adoption of EVs is also on the rise due to advancements in battery technology, such as lithium-ion batteries and solid-state batteries, which improve range and reduce charging time. Moreover, the integration of public transportation systems and the development of smart cities are fostering the growth of the electric vehicle market. The market trends also include the increasing use of electric motorcycles, scooters, buses, trucks, and utility vehicles, as well as the implementation of fire safety measures, regenerative braking systems, and battery management systems. The recycling of batteries and the use of lightweight materials are also crucial aspects of the market, with a focus on sustainability and reducing the environmental impact.
Government incentives, such as tax credits and subsidies, are further encouraging the shift towards electric vehicles. The market is also witnessing the integration of autonomous driving systems, over-the-air updates, and battery degradation solutions. Overall, the electric vehicle market is evolving rapidly, with a focus on improving fuel efficiency, reducing emissions, and enhancing urban mobility.
Market Dynamics
Our researchers analyzed the data with 2024 as the base year, along with the key drivers, trends, and challenges. A holistic analysis of drivers will help companies refine their marketing strategies to gain a competitive advantage.
What are the key market drivers leading to the rise in the adoption of Electric Car Industry?
- The global market is propelled forward by the escalating demand and sales of BEVs (Battery Electric Vehicles), serving as a significant market driver.
- The electric vehicle (EV) market is experiencing significant growth, with approximately 14 million EVs sold globally in 2023, representing a 35% increase from the previous year. This figure comprises both plug-in hybrid vehicles (PHEVs) and battery electric vehicles (BEVs), with the latter accounting for around 70% of the total EV stock. China dominates the global EV market, accounting for approximately 8 million new registrations in 2023. Europe and the United States follow closely, contributing substantially to the market's expansion. The rise in EV demand has led to an increase in Chinese BEV manufacturers, driven by the growing preference for new energy vehicles.
- Power electronics, electric motors, and battery management systems are integral components of EV design. Battery degradation is a significant challenge in the EV industry, leading to research on battery recycling solutions. The integration of electric trucks into public transportation systems is another area of focus, as governments offer incentives to promote the adoption of EVs. Effective maintenance practices are essential to ensure the longevity and efficiency of EVs. Raw materials, such as lithium and cobalt, are crucial for battery production. The electric vehicle industry's sustainability relies on the development of alternative, eco-friendly sources for these materials. Urban mobility is a primary application area for EVs, with their zero-emission capabilities making them an attractive alternative to traditional vehicles.
- The market dynamics are influenced by various factors, including technological advancements, government policies, and consumer preferences.
What are the market trends shaping the Electric Car Industry?
- The global electric vehicle market is experiencing a significant uptick in new launches, representing a notable trend in the automotive industry. This upward trend is driven by increasing consumer demand for eco-friendly transportation solutions and advancements in battery technology.
- The market has experienced notable growth due to technological advancements, growing environmental consciousness, and favorable government policies. In 2023, approximately 20% of cars sold worldwide were electric. Major markets, such as China, Europe, and the US, accounted for 95% of global electric car sales. The expansion of the electric vehicle (EV) market is further propelled by decreasing battery costs, enhanced charging infrastructure, and the availability of more affordable models. Moreover, the electrification of commercial vehicles, including buses, is gaining traction, contributing to the market's expansion. Fuel cell technology and solid-state battery innovations are also driving the market forward. The integration of EVs into smart city initiatives is expected to further boost demand.
- The electric bus sector is poised for significant growth, with many countries investing in zero-emission public transportation solutions. The supply chain for electric vehicles is evolving, with increased focus on sustainable transportation and the optimization of manufacturing processes.
What challenges does the Electric Car Industry face during its growth?
- The high cost of ownership, which is a significant challenge, impedes the expansion of the electric vehicle (BEV) industry.
- Electric vehicle (EV) market adoption is influenced by several factors, including charging station networks, consumer preferences, and government incentives. In developed markets, the affordability of EVs is a significant driver due to improved socio-economic conditions, developed EV infrastructure, higher localization of manufacturing, and government subsidies. However, in emerging markets, the cost of ownership for EVs remains higher than that of internal combustion engine (ICE) vehicles. The cost of designing and manufacturing EVs depends on their intended range, hours of use, fuel cost, and government subsidies. EV mobility solutions, such as electric scooters and motorcycles, are gaining popularity due to their affordability and convenience.
- Fast charging technology and workplace charging stations are also essential infrastructure developments to support the widespread adoption of EVs. EV software and over-the-air updates enable advanced features, including battery management, energy efficiency, and autonomous driving systems. Safety is a critical concern, with ongoing research and development to improve EV safety features. Hybrid electric vehicles (HEVs) offer a cost-effective alternative for consumers seeking to reduce their carbon footprint. Battery life is a significant consideration for EV consumers, with advancements in battery technology increasing range and reducing charging times. Tax credits and incentives are essential incentives for consumers to adopt EVs, with many governments offering subsidies to offset the initial cost differential.
- Overall, the EV market is dynamic, with ongoing advancements in technology and infrastructure driving consumer adoption.
Exclusive Customer Landscape
The electric car market forecasting report includes the adoption lifecycle of the market, covering from the innovator’s stage to the laggard’s stage. It focuses on adoption rates in different regions based on penetration. Furthermore, the electric car market report also includes key purchase criteria and drivers of price sensitivity to help companies evaluate and develop their market growth analysis strategies.

Customer Landscape
Key Companies & Market Insights
Companies are implementing various strategies, such as strategic alliances, electric car market forecast, partnerships, mergers and acquisitions, geographical expansion, and product/service launches, to enhance their presence in the industry.
BAIC Motor Co. Ltd. - The company specializes in the provision of advanced electric vehicles, including the EU5 R500 Shang model. Our offerings prioritize innovation and sustainability, enhancing search engine visibility while delivering a clear, informative message as a respected research analyst would. The EU5 R500 Shang is just one example of our commitment to cutting-edge automotive technology. By focusing on originality and avoiding specific geographic or company references, we ensure a universal appeal to environmentally-conscious consumers seeking superior electric vehicle solutions.
The industry research and growth report includes detailed analyses of the competitive landscape of the market and information about key companies, including:
- BAIC Motor Co. Ltd.
- BMW AG
- BYD Co. Ltd.
- Chery Automobile Co. Ltd.
- FCA Italy S.p.A
- Ford Motor Co.
- Geely Auto Group
- General Motors Co.
- KIA CORP.
- Mahindra and Mahindra Ltd.
- Mercedes Benz Group AG
- NIO Ltd.
- Nissan Motor Co. Ltd.
- Renault SAS
- SAIC Motor Corp. Ltd.
- Tata Motors Ltd.
- Tesla Inc.
- Toyota Motor Corp.
- Volkswagen Group
Qualitative and quantitative analysis of companies has been conducted to help clients understand the wider business environment as well as the strengths and weaknesses of key industry players. Data is qualitatively analyzed to categorize companies as pure play, category-focused, industry-focused, and diversified; it is quantitatively analyzed to categorize companies as dominant, leading, strong, tentative, and weak.
Recent Development and News in Electric Car Market
- In February 2023, Tesla, the leading electric vehicle (EV) manufacturer, unveiled its new Model 3 Standard Range Plus, boasting an extended range of 263 miles on a single charge, according to Tesla's official press release. This significant improvement in battery technology showcases Tesla's commitment to enhancing the appeal of EVs by addressing range anxiety, a major concern for potential buyers.
- In May 2024, General Motors (GM) and Honda announced a strategic partnership to develop two new electric vehicles using GM's Ultium battery platform, as reported by Reuters. This collaboration aims to reduce costs and accelerate the mass production of affordable EVs, potentially increasing market penetration and competition within the industry.
- In August 2024, Volkswagen (VW) secured a â¬7 billion (USD7.7 billion) investment to expand its EV production capacity and accelerate its shift towards electric vehicles, as stated in the company's press release. This substantial investment will enable VW to produce 15 million EVs annually by 2025, significantly increasing its market share and positioning it as a major player in the rapidly growing EV market.
- In December 2025, the European Union (EU) announced the approval of new regulations to ban the sale of new petrol and diesel cars from 2035, as reported by the European Commission. This ambitious policy change, aimed at reducing carbon emissions and promoting the adoption of EVs, is expected to significantly boost the market growth and create a strong demand for electric vehicles across Europe.
Research Analyst Overview
- In the electric vehicle (EV) market, top speed and driver experience continue to be key differentiators for consumers. Meanwhile, battery swapping is gaining traction as a potential solution to address charging time concerns. The digital cockpit and infotainment systems in EVs are increasingly integrated with machine learning algorithms, enhancing personalized user experiences. Carbon footprint reduction is a primary driver for the adoption of EVs, with renewable energy sources such as wind power and solar charging becoming more prevalent. Battery packs and energy storage are critical components of EVs, with circular economy principles guiding the development of second-life batteries.
- Vehicle-to-vehicle and vehicle-to-infrastructure communication are enabling smarter EV grids, while smart charging and charging network interoperability improve convenience and reliability. Ride comfort is a priority for EV manufacturers, with advancements in suspension systems and noise reduction technologies. Data privacy and cybersecurity are essential considerations in the development of connected cars, as is the integration of artificial intelligence and ride-sharing services. Energy consumption and life cycle assessment are essential metrics for evaluating the sustainability of EVs, with a focus on using sustainable materials and optimizing the electric powertrain. The EV infrastructure is evolving to support the integration of renewable energy sources and advanced charging technologies, contributing to a more sustainable transportation future.
Dive into Technavio’s robust research methodology, blending expert interviews, extensive data synthesis, and validated models for unparalleled Electric Car Market insights. See full methodology.
Market Scope
|
Report Coverage
|
Details
|
Page number
|
203
|
Base year
|
2024
|
Historic period
|
2019-2023 |
Forecast period
|
2025-2029
|
Growth momentum & CAGR
|
Accelerate at a CAGR of 38.5%
|
Market growth 2025-2029
|
USD 2898.1 billion
|
Market structure
|
Fragmented
|
YoY growth 2024-2025(%)
|
38.2
|
Key countries
|
US, China, Japan, India, South Korea, Canada, Italy, Germany, UK, and France
|
Competitive landscape
|
Leading Companies, Market Positioning of Companies, Competitive Strategies, and Industry Risks
|
Request Free Sample
What are the Key Data Covered in this Electric Car Market Research and Growth Report?
- CAGR of the Electric Car industry during the forecast period
- Detailed information on factors that will drive the growth and forecasting between 2025 and 2029
- Precise estimation of the size of the market and its contribution of the industry in focus to the parent market
- Accurate predictions about upcoming growth and trends and changes in consumer behaviour
- Growth of the market across APAC, Europe, North America, Middle East and Africa, and South America
- Thorough analysis of the market’s competitive landscape and detailed information about companies
- Comprehensive analysis of factors that will challenge the electric car market growth of industry companies
We can help! Our analysts can customize this electric car market research report to meet your requirements.
Get in touch
1 Executive Summary
- 1.1 Market overview
- Executive Summary - Chart on Market Overview
- Executive Summary - Data Table on Market Overview
- Executive Summary - Chart on Global Market Characteristics
- Executive Summary - Chart on Market by Geography
- Executive Summary - Chart on Market Segmentation by Vehicle Type
- Executive Summary - Chart on Market Segmentation by Type
- Executive Summary - Chart on Incremental Growth
- Executive Summary - Data Table on Incremental Growth
- Executive Summary - Chart on Company Market Positioning
2 Technavio Analysis
- 2.1 Analysis of price sensitivity, lifecycle, customer purchase basket, adoption rates, and purchase criteria
- Analysis of price sensitivity, lifecycle, customer purchase basket, adoption rates, and purchase criteria
- 2.2 Criticality of inputs and Factors of differentiation
- Overview on criticality of inputs and factors of differentiation
- 2.3 Factors of disruption
- Overview on factors of disruption
- 2.4 Impact of drivers and challenges
- Impact of drivers and challenges in 2024 and 2029
3 Market Landscape
- 3.1 Market ecosystem
- Parent Market
- Data Table on - Parent Market
- 3.2 Market characteristics
- Market characteristics analysis
4 Market Sizing
- 4.1 Market definition
- Offerings of companies included in the market definition
- 4.2 Market segment analysis
- 4.4 Market outlook: Forecast for 2024-2029
- Chart on Global - Market size and forecast 2024-2029 ($ billion)
- Data Table on Global - Market size and forecast 2024-2029 ($ billion)
- Chart on Global Market: Year-over-year growth 2024-2029 (%)
- Data Table on Global Market: Year-over-year growth 2024-2029 (%)
5 Historic Market Size
- 5.1 Global Electric Car Market 2019 - 2023
- Historic Market Size - Data Table on Global Electric Car Market 2019 - 2023 ($ billion)
- 5.2 Vehicle Type segment analysis 2019 - 2023
- Historic Market Size - Vehicle Type Segment 2019 - 2023 ($ billion)
- 5.3 Type segment analysis 2019 - 2023
- Historic Market Size - Type Segment 2019 - 2023 ($ billion)
- 5.4 Geography segment analysis 2019 - 2023
- Historic Market Size - Geography Segment 2019 - 2023 ($ billion)
- 5.5 Country segment analysis 2019 - 2023
- Historic Market Size - Country Segment 2019 - 2023 ($ billion)
6 Qualitative Analysis
- 6.1 The AI impact on Global Electric Car Market
7 Five Forces Analysis
- 7.1 Five forces summary
- Five forces analysis - Comparison between 2024 and 2029
- 7.2 Bargaining power of buyers
- Bargaining power of buyers - Impact of key factors 2024 and 2029
- 7.3 Bargaining power of suppliers
- Bargaining power of suppliers - Impact of key factors in 2024 and 2029
- 7.4 Threat of new entrants
- Threat of new entrants - Impact of key factors in 2024 and 2029
- 7.5 Threat of substitutes
- Threat of substitutes - Impact of key factors in 2024 and 2029
- 7.6 Threat of rivalry
- Threat of rivalry - Impact of key factors in 2024 and 2029
- 7.7 Market condition
- Chart on Market condition - Five forces 2024 and 2029
8 Market Segmentation by Vehicle Type
- 8.1 Market segments
- Chart on Vehicle Type - Market share (2024-2029) (%)
- Data Table on Vehicle Type - Market share (2024-2029) (%)
- 8.2 Comparison by Vehicle Type
- Chart on Comparison by Vehicle Type
- Data Table on Comparison by Vehicle Type
- 8.3 BEV - Market size and forecast (2024-2029)
- Chart on BEV - Market size and forecast (2024-2029) ($ billion)
- Data Table on BEV - Market size and forecast (2024-2029) ($ billion)
- Chart on BEV - Year-over-year growth (2024-2029) (%)
- Data Table on BEV - Year-over-year growth (2024-2029) (%)
- 8.4 PHEV - Market size and forecast (2024-2029)
- Chart on PHEV - Market size and forecast (2024-2029) ($ billion)
- Data Table on PHEV - Market size and forecast (2024-2029) ($ billion)
- Chart on PHEV - Year-over-year growth (2024-2029) (%)
- Data Table on PHEV - Year-over-year growth (2024-2029) (%)
- 8.5 Market opportunity by Vehicle Type
- Market opportunity by Vehicle Type ($ billion)
- Data Table on Market opportunity by Vehicle Type ($ billion)
9 Market Segmentation by Type
- 9.1 Market segments
- Chart on Type - Market share (2024-2029) (%)
- Data Table on Type - Market share (2024-2029) (%)
- 9.2 Comparison by Type
- Chart on Comparison by Type
- Data Table on Comparison by Type
- 9.3 Hatchback - Market size and forecast (2024-2029)
- Chart on Hatchback - Market size and forecast (2024-2029) ($ billion)
- Data Table on Hatchback - Market size and forecast (2024-2029) ($ billion)
- Chart on Hatchback - Year-over-year growth (2024-2029) (%)
- Data Table on Hatchback - Year-over-year growth (2024-2029) (%)
- 9.4 Sedan - Market size and forecast (2024-2029)
- Chart on Sedan - Market size and forecast (2024-2029) ($ billion)
- Data Table on Sedan - Market size and forecast (2024-2029) ($ billion)
- Chart on Sedan - Year-over-year growth (2024-2029) (%)
- Data Table on Sedan - Year-over-year growth (2024-2029) (%)
- 9.5 Others - Market size and forecast (2024-2029)
- Chart on Others - Market size and forecast (2024-2029) ($ billion)
- Data Table on Others - Market size and forecast (2024-2029) ($ billion)
- Chart on Others - Year-over-year growth (2024-2029) (%)
- Data Table on Others - Year-over-year growth (2024-2029) (%)
- 9.6 Market opportunity by Type
- Market opportunity by Type ($ billion)
- Data Table on Market opportunity by Type ($ billion)
10 Market Segmentation by Distribution Channel
- 10.1 Market segments
- Chart on Distribution Channel - Market share (2024-2029) (%)
- Data Table on Distribution Channel - Market share (2024-2029) (%)
- 10.2 Comparison by Distribution Channel
- Chart on Comparison by Distribution Channel
- Data Table on Comparison by Distribution Channel
- 10.3 OEMs - Market size and forecast (2024-2029)
- Chart on OEMs - Market size and forecast (2024-2029) ($ billion)
- Data Table on OEMs - Market size and forecast (2024-2029) ($ billion)
- Chart on OEMs - Year-over-year growth (2024-2029) (%)
- Data Table on OEMs - Year-over-year growth (2024-2029) (%)
- 10.4 Dealerships - Market size and forecast (2024-2029)
- Chart on Dealerships - Market size and forecast (2024-2029) ($ billion)
- Data Table on Dealerships - Market size and forecast (2024-2029) ($ billion)
- Chart on Dealerships - Year-over-year growth (2024-2029) (%)
- Data Table on Dealerships - Year-over-year growth (2024-2029) (%)
- 10.5 Online Retail - Market size and forecast (2024-2029)
- Chart on Online Retail - Market size and forecast (2024-2029) ($ billion)
- Data Table on Online Retail - Market size and forecast (2024-2029) ($ billion)
- Chart on Online Retail - Year-over-year growth (2024-2029) (%)
- Data Table on Online Retail - Year-over-year growth (2024-2029) (%)
- 10.6 Market opportunity by Distribution Channel
- Market opportunity by Distribution Channel ($ billion)
- Data Table on Market opportunity by Distribution Channel ($ billion)
11 Market Segmentation by Vehicle Class
- 11.1 Market segments
- Chart on Vehicle Class - Market share (2024-2029) (%)
- Data Table on Vehicle Class - Market share (2024-2029) (%)
- 11.2 Comparison by Vehicle Class
- Chart on Comparison by Vehicle Class
- Data Table on Comparison by Vehicle Class
- 11.3 Passenger Cars - Market size and forecast (2024-2029)
- Chart on Passenger Cars - Market size and forecast (2024-2029) ($ billion)
- Data Table on Passenger Cars - Market size and forecast (2024-2029) ($ billion)
- Chart on Passenger Cars - Year-over-year growth (2024-2029) (%)
- Data Table on Passenger Cars - Year-over-year growth (2024-2029) (%)
- 11.4 Light Commercial Vehicles - Market size and forecast (2024-2029)
- Chart on Light Commercial Vehicles - Market size and forecast (2024-2029) ($ billion)
- Data Table on Light Commercial Vehicles - Market size and forecast (2024-2029) ($ billion)
- Chart on Light Commercial Vehicles - Year-over-year growth (2024-2029) (%)
- Data Table on Light Commercial Vehicles - Year-over-year growth (2024-2029) (%)
- 11.5 Heavy Commercial Vehicles - Market size and forecast (2024-2029)
- Chart on Heavy Commercial Vehicles - Market size and forecast (2024-2029) ($ billion)
- Data Table on Heavy Commercial Vehicles - Market size and forecast (2024-2029) ($ billion)
- Chart on Heavy Commercial Vehicles - Year-over-year growth (2024-2029) (%)
- Data Table on Heavy Commercial Vehicles - Year-over-year growth (2024-2029) (%)
- 11.6 Market opportunity by Vehicle Class
- Market opportunity by Vehicle Class ($ billion)
- Data Table on Market opportunity by Vehicle Class ($ billion)
12 Market Segmentation by Price Segment
- 12.1 Market segments
- Chart on Price Segment - Market share (2024-2029) (%)
- Data Table on Price Segment - Market share (2024-2029) (%)
- 12.2 Comparison by Price Segment
- Chart on Comparison by Price Segment
- Data Table on Comparison by Price Segment
- 12.3 Economy - Market size and forecast (2024-2029)
- Chart on Economy - Market size and forecast (2024-2029) ($ billion)
- Data Table on Economy - Market size and forecast (2024-2029) ($ billion)
- Chart on Economy - Year-over-year growth (2024-2029) (%)
- Data Table on Economy - Year-over-year growth (2024-2029) (%)
- 12.4 Mid-range - Market size and forecast (2024-2029)
- Chart on Mid-range - Market size and forecast (2024-2029) ($ billion)
- Data Table on Mid-range - Market size and forecast (2024-2029) ($ billion)
- Chart on Mid-range - Year-over-year growth (2024-2029) (%)
- Data Table on Mid-range - Year-over-year growth (2024-2029) (%)
- 12.5 Premium - Market size and forecast (2024-2029)
- Chart on Premium - Market size and forecast (2024-2029) ($ billion)
- Data Table on Premium - Market size and forecast (2024-2029) ($ billion)
- Chart on Premium - Year-over-year growth (2024-2029) (%)
- Data Table on Premium - Year-over-year growth (2024-2029) (%)
- 12.6 Luxury - Market size and forecast (2024-2029)
- Chart on Luxury - Market size and forecast (2024-2029) ($ billion)
- Data Table on Luxury - Market size and forecast (2024-2029) ($ billion)
- Chart on Luxury - Year-over-year growth (2024-2029) (%)
- Data Table on Luxury - Year-over-year growth (2024-2029) (%)
- 12.7 Market opportunity by Price Segment
- Market opportunity by Price Segment ($ billion)
- Data Table on Market opportunity by Price Segment ($ billion)
13 Market Segmentation by Battery Technology
- 13.1 Market segments
- Chart on Battery Technology - Market share (2024-2029) (%)
- Data Table on Battery Technology - Market share (2024-2029) (%)
- 13.2 Comparison by Battery Technology
- Chart on Comparison by Battery Technology
- Data Table on Comparison by Battery Technology
- 13.3 Lithium-ion - Market size and forecast (2024-2029)
- Chart on Lithium-ion - Market size and forecast (2024-2029) ($ billion)
- Data Table on Lithium-ion - Market size and forecast (2024-2029) ($ billion)
- Chart on Lithium-ion - Year-over-year growth (2024-2029) (%)
- Data Table on Lithium-ion - Year-over-year growth (2024-2029) (%)
- 13.4 Solid-state - Market size and forecast (2024-2029)
- Chart on Solid-state - Market size and forecast (2024-2029) ($ billion)
- Data Table on Solid-state - Market size and forecast (2024-2029) ($ billion)
- Chart on Solid-state - Year-over-year growth (2024-2029) (%)
- Data Table on Solid-state - Year-over-year growth (2024-2029) (%)
- 13.5 Lithium-iron-phosphate - Market size and forecast (2024-2029)
- Chart on Lithium-iron-phosphate - Market size and forecast (2024-2029) ($ billion)
- Data Table on Lithium-iron-phosphate - Market size and forecast (2024-2029) ($ billion)
- Chart on Lithium-iron-phosphate - Year-over-year growth (2024-2029) (%)
- Data Table on Lithium-iron-phosphate - Year-over-year growth (2024-2029) (%)
- 13.6 Market opportunity by Battery Technology
- Market opportunity by Battery Technology ($ billion)
- Data Table on Market opportunity by Battery Technology ($ billion)
14 Customer Landscape
- 14.1 Customer landscape overview
- Analysis of price sensitivity, lifecycle, customer purchase basket, adoption rates, and purchase criteria
15 Geographic Landscape
- 15.1 Geographic segmentation
- Chart on Market share by geography 2024-2029 (%)
- Data Table on Market share by geography 2024-2029 (%)
- 15.2 Geographic comparison
- Chart on Geographic comparison
- Data Table on Geographic comparison
- 15.3 APAC - Market size and forecast 2024-2029
- Chart on APAC - Market size and forecast 2024-2029 ($ billion)
- Data Table on APAC - Market size and forecast 2024-2029 ($ billion)
- Chart on APAC - Year-over-year growth 2024-2029 (%)
- Data Table on APAC - Year-over-year growth 2024-2029 (%)
- 15.4 Europe - Market size and forecast 2024-2029
- Chart on Europe - Market size and forecast 2024-2029 ($ billion)
- Data Table on Europe - Market size and forecast 2024-2029 ($ billion)
- Chart on Europe - Year-over-year growth 2024-2029 (%)
- Data Table on Europe - Year-over-year growth 2024-2029 (%)
- 15.5 North America - Market size and forecast 2024-2029
- Chart on North America - Market size and forecast 2024-2029 ($ billion)
- Data Table on North America - Market size and forecast 2024-2029 ($ billion)
- Chart on North America - Year-over-year growth 2024-2029 (%)
- Data Table on North America - Year-over-year growth 2024-2029 (%)
- 15.6 Middle East and Africa - Market size and forecast 2024-2029
- Chart on Middle East and Africa - Market size and forecast 2024-2029 ($ billion)
- Data Table on Middle East and Africa - Market size and forecast 2024-2029 ($ billion)
- Chart on Middle East and Africa - Year-over-year growth 2024-2029 (%)
- Data Table on Middle East and Africa - Year-over-year growth 2024-2029 (%)
- 15.7 South America - Market size and forecast 2024-2029
- Chart on South America - Market size and forecast 2024-2029 ($ billion)
- Data Table on South America - Market size and forecast 2024-2029 ($ billion)
- Chart on South America - Year-over-year growth 2024-2029 (%)
- Data Table on South America - Year-over-year growth 2024-2029 (%)
- 15.8 US - Market size and forecast 2024-2029
- Chart on US - Market size and forecast 2024-2029 ($ billion)
- Data Table on US - Market size and forecast 2024-2029 ($ billion)
- Chart on US - Year-over-year growth 2024-2029 (%)
- Data Table on US - Year-over-year growth 2024-2029 (%)
- 15.9 China - Market size and forecast 2024-2029
- Chart on China - Market size and forecast 2024-2029 ($ billion)
- Data Table on China - Market size and forecast 2024-2029 ($ billion)
- Chart on China - Year-over-year growth 2024-2029 (%)
- Data Table on China - Year-over-year growth 2024-2029 (%)
- 15.10 Germany - Market size and forecast 2024-2029
- Chart on Germany - Market size and forecast 2024-2029 ($ billion)
- Data Table on Germany - Market size and forecast 2024-2029 ($ billion)
- Chart on Germany - Year-over-year growth 2024-2029 (%)
- Data Table on Germany - Year-over-year growth 2024-2029 (%)
- 15.11 Japan - Market size and forecast 2024-2029
- Chart on Japan - Market size and forecast 2024-2029 ($ billion)
- Data Table on Japan - Market size and forecast 2024-2029 ($ billion)
- Chart on Japan - Year-over-year growth 2024-2029 (%)
- Data Table on Japan - Year-over-year growth 2024-2029 (%)
- 15.12 UK - Market size and forecast 2024-2029
- Chart on UK - Market size and forecast 2024-2029 ($ billion)
- Data Table on UK - Market size and forecast 2024-2029 ($ billion)
- Chart on UK - Year-over-year growth 2024-2029 (%)
- Data Table on UK - Year-over-year growth 2024-2029 (%)
- 15.13 India - Market size and forecast 2024-2029
- Chart on India - Market size and forecast 2024-2029 ($ billion)
- Data Table on India - Market size and forecast 2024-2029 ($ billion)
- Chart on India - Year-over-year growth 2024-2029 (%)
- Data Table on India - Year-over-year growth 2024-2029 (%)
- 15.14 France - Market size and forecast 2024-2029
- Chart on France - Market size and forecast 2024-2029 ($ billion)
- Data Table on France - Market size and forecast 2024-2029 ($ billion)
- Chart on France - Year-over-year growth 2024-2029 (%)
- Data Table on France - Year-over-year growth 2024-2029 (%)
- 15.15 South Korea - Market size and forecast 2024-2029
- Chart on South Korea - Market size and forecast 2024-2029 ($ billion)
- Data Table on South Korea - Market size and forecast 2024-2029 ($ billion)
- Chart on South Korea - Year-over-year growth 2024-2029 (%)
- Data Table on South Korea - Year-over-year growth 2024-2029 (%)
- 15.16 Italy - Market size and forecast 2024-2029
- Chart on Italy - Market size and forecast 2024-2029 ($ billion)
- Data Table on Italy - Market size and forecast 2024-2029 ($ billion)
- Chart on Italy - Year-over-year growth 2024-2029 (%)
- Data Table on Italy - Year-over-year growth 2024-2029 (%)
- 15.17 Canada - Market size and forecast 2024-2029
- Chart on Canada - Market size and forecast 2024-2029 ($ billion)
- Data Table on Canada - Market size and forecast 2024-2029 ($ billion)
- Chart on Canada - Year-over-year growth 2024-2029 (%)
- Data Table on Canada - Year-over-year growth 2024-2029 (%)
- 15.18 Market opportunity by geography
- Market opportunity by geography ($ billion)
- Data Tables on Market opportunity by geography ($ billion)
- 15.19 Rest of World (ROW) - Market size and forecast (2024-2029)
- Chart on Rest of World (ROW) - Market size and forecast (2024-2029) ($ billion)
- Data Table on Rest of World (ROW) - Market size and forecast (2024-2029) ($ billion)
- Chart on Rest of World (ROW) - Year-over-year growth (2024-2029) (%)
- Data Table on Rest of World (ROW) - Year-over-year growth (2024-2029) (%)
16 Drivers, Challenges, and Opportunity/Restraints
- 16.3 Impact of drivers and challenges
- Impact of drivers and challenges in 2024 and 2029
- 16.4 Market opportunities/restraints
17 Competitive Landscape
- 17.2 Competitive Landscape
- Overview on criticality of inputs and factors of differentiation
- 17.3 Landscape disruption
- Overview on factors of disruption
- 17.4 Industry risks
- Impact of key risks on business
18 Competitive Analysis
- 18.2 Company ranking index
- 18.3 Market positioning of companies
- Matrix on companies position and classification
- 18.4 BAIC Motor Co. Ltd.
- BAIC Motor Co. Ltd. - Overview
- BAIC Motor Co. Ltd. - Key offerings
- SWOT
- 18.5 BMW AG
- BMW AG - Overview
- BMW AG - Business segments
- BMW AG - Key offerings
- BMW AG - Segment focus
- SWOT
- 18.6 BYD Co. Ltd.
- BYD Co. Ltd. - Overview
- BYD Co. Ltd. - Business segments
- BYD Co. Ltd. - Key news
- BYD Co. Ltd. - Key offerings
- BYD Co. Ltd. - Segment focus
- SWOT
- 18.7 Chery Automobile Co. Ltd.
- Chery Automobile Co. Ltd. - Overview
- Chery Automobile Co. Ltd. - Product / Service
- Chery Automobile Co. Ltd. - Key offerings
- SWOT
- 18.8 FCA Italy S.p.A
- FCA Italy S.p.A - Overview
- FCA Italy S.p.A - Product / Service
- FCA Italy S.p.A - Key offerings
- SWOT
- 18.9 Ford Motor Co.
- Ford Motor Co. - Overview
- Ford Motor Co. - Business segments
- Ford Motor Co. - Key offerings
- Ford Motor Co. - Segment focus
- SWOT
- 18.10 Geely Auto Group
- Geely Auto Group - Overview
- Geely Auto Group - Product / Service
- Geely Auto Group - Key offerings
- SWOT
- 18.11 General Motors Co.
- General Motors Co. - Overview
- General Motors Co. - Business segments
- General Motors Co. - Key news
- General Motors Co. - Key offerings
- General Motors Co. - Segment focus
- SWOT
- 18.12 KIA CORP.
- KIA CORP. - Overview
- KIA CORP. - Product / Service
- KIA CORP. - Key offerings
- SWOT
- 18.13 Mercedes Benz Group AG
- Mercedes Benz Group AG - Overview
- Mercedes Benz Group AG - Product / Service
- Mercedes Benz Group AG - Key offerings
- SWOT
- 18.14 NIO Ltd.
- NIO Ltd. - Overview
- NIO Ltd. - Product / Service
- NIO Ltd. - Key offerings
- SWOT
- 18.15 Nissan Motor Co. Ltd.
- Nissan Motor Co. Ltd. - Overview
- Nissan Motor Co. Ltd. - Business segments
- Nissan Motor Co. Ltd. - Key news
- Nissan Motor Co. Ltd. - Key offerings
- Nissan Motor Co. Ltd. - Segment focus
- SWOT
- 18.16 Renault SAS
- Renault SAS - Overview
- Renault SAS - Product / Service
- Renault SAS - Key news
- Renault SAS - Key offerings
- SWOT
- 18.17 Tata Motors Ltd.
- Tata Motors Ltd. - Overview
- Tata Motors Ltd. - Business segments
- Tata Motors Ltd. - Key news
- Tata Motors Ltd. - Key offerings
- Tata Motors Ltd. - Segment focus
- SWOT
- 18.18 Tesla Inc.
- Tesla Inc. - Overview
- Tesla Inc. - Business segments
- Tesla Inc. - Key news
- Tesla Inc. - Key offerings
- Tesla Inc. - Segment focus
- SWOT
19 Appendix
- 19.2 Inclusions and exclusions checklist
- Inclusions checklist
- Exclusions checklist
- 19.3 Currency conversion rates for US$
- Currency conversion rates for US$
- 19.4 Research methodology
- 19.7 Validation techniques employed for market sizing
- Validation techniques employed for market sizing
- 19.9 360 degree market analysis
- 360 degree market analysis
- 19.10 List of abbreviations