Electric Service Companies Market Analysis North America, APAC, Europe, South America, Middle East and Africa - US, China, India, Germany, France - Size and Forecast 2024-2028

Electric Service Companies Market Analysis North America, APAC, Europe, South America, Middle East and Africa - US, China, India, Germany, France - Size and Forecast 2024-2028

Published: Mar 2024 163 Pages SKU: IRTNTR77827

Market Overview at a Glance

$13.45 B
Market Opportunity
7.46%
CAGR
7.32
YoY growth 2023-2024(%)

Electric Service Companies Market Size 2024-2028 

The electric service companies market size is forecast to increase by USD 13.45 billion at a CAGR of 7.46% between 2023 and 2028.

  • The market is experiencing significant growth, driven by several key trends and factors. One of the primary drivers is the increasing deployment of smart grid technologies, which enable more efficient energy management and distribution. Another trend is the rising adoption of electrification, as more industries and sectors shift towards electric power to reduce carbon emissions and improve sustainability. However, this market also faces challenges, including the growing risk of cybersecurity threats, which can compromise the integrity of the power grid and disrupt services. As the demand for reliable and secure electric services continues to grow, electric service companies must adapt to these trends and challenges to remain competitive and meet the evolving needs of their customers.

What will the size of the market be during the forecast period?

Electric Service Companies Market Size

 Request Free Sample

  • The electric service industry encompasses various aspects of electrical power generation, transmission, distribution, and utilization. This sector plays a crucial role in meeting the energy demands of residential, commercial, and infrastructural developments. Energy efficiency and conservation are significant trends shaping the electric service industry. The increasing awareness of energy management and the need to reduce energy consumption have led to the widespread adoption of energy-efficient equipment, such as lighting systems and HVAC systems. Retrofitting buildings with energy-efficient solutions is a growing trend, as it not only helps reduce energy consumption but also lowers operational costs. Modern electrical systems are integrating advanced technologies to optimize energy usage. Renewable energy solutions, such as solar panels and wind turbines, are becoming increasingly popular for electrical power generation. These sources of energy are not only environmentally friendly but also offer cost savings in the long run. Renewable energy sources, including solar and wind, are gaining traction as viable alternatives to traditional energy sources, such as fossil fuels.
  • The development of electrical components and systems to effectively harness and distribute renewable energy is crucial for the growth of this sector. Electrical power transmission and distribution networks are undergoing significant upgrades to accommodate the integration of renewable energy sources into the grid. High-voltage transmission lines are being installed to efficiently transport electricity over long distances. The rise of smart buildings and the increasing popularity of electric vehicles are further driving the demand for advanced electrical systems. Energy management software is being used to optimize energy usage in buildings, while electrical infrastructure development is essential for the widespread adoption of electric vehicles. In conclusion, the electric service industry is undergoing a transformation, driven by the need for energy efficiency and the integration of renewable energy sources. The adoption of energy-efficient equipment, the development of advanced electrical systems, and the integration of renewable energy sources into the grid are key trends shaping the future of this sector.

How is this market segmented and which is the largest segment?

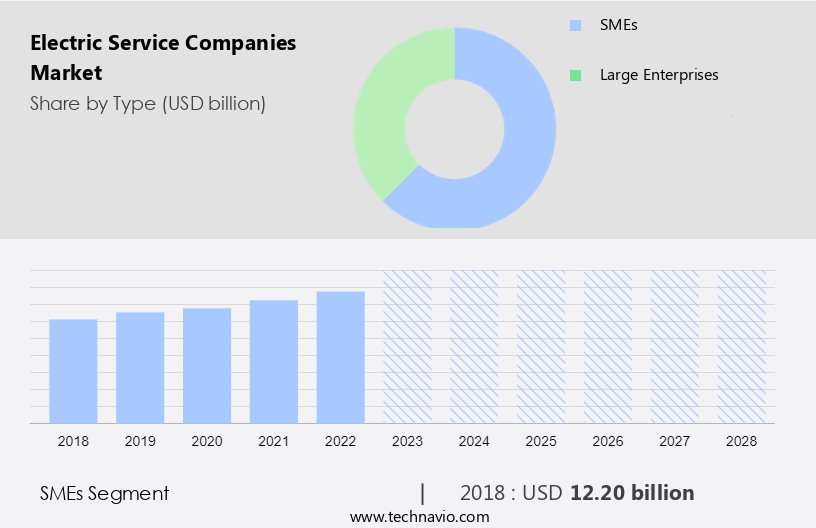
The market research report provides comprehensive data (region-wise segment analysis), with forecasts and estimates in "USD billion" for the period 2024-2028, as well as historical data from 2018-2022 for the following segments.

  • Type
    • SMEs
    • Large enterprises
  • End-user
    • Commercial
    • Industrial
    • Residential
  • Geography
    • North America
      • US
    • APAC
      • China
      • India
    • Europe
      • Germany
      • France
    • South America
    • Middle East and Africa

By Type Insights

  • The SMEs segment is estimated to witness significant growth during the forecast period.

Electric service companies in the United States are experiencing significant growth due to the increasing demand for installation, maintenance, and repair services for various electrical systems. Factors such as population growth, urbanization, industrial development, and infrastructure expansion are driving this demand. Advanced technologies, including smart homes, commercial systems, interconnected grids, and smart grid technology, are revolutionizing the power system integration and energy security landscape. SMEs can capitalize on these trends by offering value-added services such as troubleshooting, repairs, and maintenance for electrical components and systems. Moreover, the adoption of innovative technologies like energy management systems, renewable energy solutions, and electric vehicle infrastructure presents new business opportunities for SMEs.

Further, by embracing these technologies, SMEs can improve operational efficiency and offer energy-efficient solutions that cater to the growing awareness of energy conservation and sustainability. Furthermore, energy audit services, energy-efficient equipment, and energy management consulting are essential services that businesses and consumers are investing in to reduce their carbon footprint and contribute to environmental stewardship. In conclusion, the electric service industry in the US is witnessing a swell in demand for various services, from installation and maintenance to repairs and upgrades. SMEs that invest in innovative technologies and offer value-added services can capitalize on this trend and contribute to the development of a sustainable and efficient energy infrastructure.

Electric Service Companies Market Size

Get a glance at the market report of share of various segments Request Free Sample

The SMEs segment was valued at USD 12.20 billion in 2018 and showed a gradual increase during the forecast period.

Regional Analysis

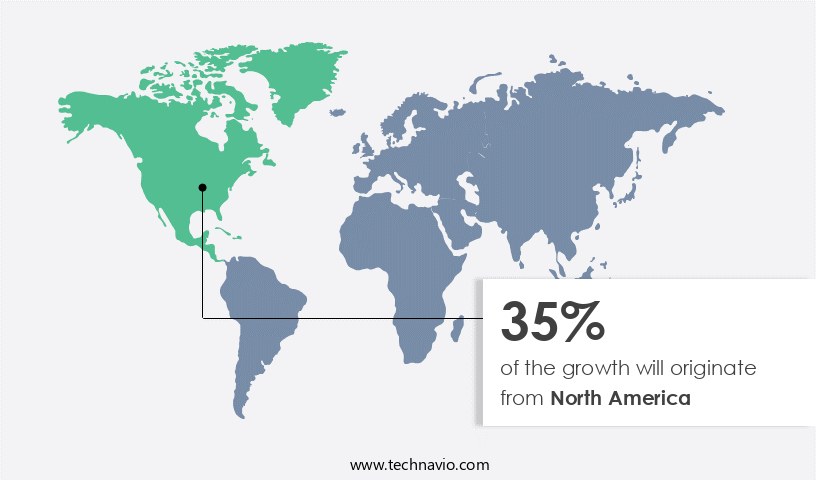
  • North America is estimated to contribute 35% to the growth of the global market during the forecast period.

Technavio's analysts have elaborately explained the regional trends and drivers that shape the market during the forecast period.

Electric Service Companies Market Share by Geography

For more insights on the market share of various regions Request Free Sample

The electrical grid forms the backbone of modern electrical systems, with substations, voltage transformers, distribution lines, and various electrical components playing crucial roles in stable power distribution. Electric service companies cater to diverse sectors, including residential settings, commercial establishments, and industrial operations, employing electricians, lighting specialists, and technicians for installations, maintenance, repairs, and troubleshooting. In residential settings, electricians install and maintain electrical panels, switches, circuit breakers, and lighting systems. Commercial and industrial electricians handle more complex installations, such as electrical systems for commercial buildings, interconnected grids, and smart grid technology for power system integration. The growing trend towards smart homes and smart buildings necessitates the development of modern electrical systems, which include electrical software services and energy management systems.

Additionally, the increasing adoption of electric vehicles (EVs) and charging infrastructure further boosts the demand for electrical services, as does the shift towards energy security and carbon reduction strategies. Institutional electrical service providers offer energy audits, electrical engineering, and electrical hardware solutions to help businesses and organizations reduce their electricity consumption patterns and improve energy efficiency. Maintenance services and repairs are essential to ensure the longevity and optimal performance of electrical systems, while smart city initiatives and infrastructure development create new opportunities for electrical service companies. Overall, the economic growth in North America, population expansion, and urbanization trends contribute to the increasing demand for electric services, making it a promising industry for investment and expansion.

Market Dynamics

Our researchers analyzed the data with 2023 as the base year, along with the key drivers, trends, and challenges. A holistic analysis of drivers will help companies refine their marketing strategies to gain a competitive advantage.

What are the key market drivers leading to the rise in adoption of Electric Service Companies Market?

The growing deployment of smart grid technologies is the key driver of the market.

  • Electric service companies in the US offer a range of specialized services to support the implementation and optimization of smart grid technologies. These services encompass the installation, integration, maintenance, and enhancement of advanced metering infrastructure (AMI), distribution automation, grid analytics, and demand response systems. By providing expertise in system design, engineering, and testing, electric service companies ensure the seamless integration and interoperability of these smart grid components and systems into existing infrastructure. Moreover, the deployment of smart grids is frequently part of larger grid modernization initiatives aimed at upgrading outdated infrastructure, increasing grid resilience, and improving operational efficiency. In this context, electric service companies play a vital role in integrating renewable energy sources, such as wind, solar, biomass, and clean energy technologies, into the grid.
  • They also specialize in the installation and maintenance of energy-saving systems, energy management solutions, and electrical power generation systems, including solar panels, wind turbines, and high-voltage transmission lines. Electric service companies' services are essential for enhancing the overall performance and reliability of the electrical power grid. Their expertise in electrical power generation, residential wiring, and electrical service ensures that businesses and households can effectively manage their energy consumption and reduce their carbon footprint. By partnering with electric service companies, organizations and individuals can optimize their energy usage, minimize costs, and contribute to a more sustainable energy future.

What are the market trends shaping the Electric Service Companies Market?

Increasing adoption of electrification is the upcoming trend in the market.

  • Electric service companies in the United States are experiencing growth due to the increasing adoption of electric vehicles (EVs) and the electrification of transportation infrastructure. These companies offer services related to the installation, maintenance, and management of EV charging stations and grid integration. The expansion of EV charging infrastructure opens up opportunities for electric service providers to offer specialized services and broaden their customer base. Moreover, the shift towards electric heating, cooling, and HVAC systems in residential, commercial, and industrial buildings fuels demand for electric service companies. They provide installation, maintenance, and repair services for electric heating systems, heat pumps, and air conditioning units.
  • As buildings adopt electric heating and cooling solutions, electric service companies can leverage this trend to offer energy-efficient solutions and enhance their service offerings. The electrical industry encompasses various components such as lighting, switches, circuit breakers, electrical panels, and electrical engineering. Electrical hardware and software services are essential for stable power distribution and efficient electrical systems. Commercial and industrial electricians play a crucial role in installing and maintaining electrical systems for businesses, while institutional electrical service caters to schools, hospitals, and other large institutions.

What challenges does Electric Service Companies Market face during the growth?

Rising cybersecurity risks is a key challenge affecting the market growth.

  • Electric service companies play a vital role in providing energy to homes and businesses across the United States. They utilize various energy sources, including fossil fuels such as coal and natural gas, nuclear energy, hydroelectric power, wind energy, solar energy, and geothermal energy, to generate electricity. The electrical grid, which consists of power plants, substations, voltage transformers, distribution lines, and other infrastructure, is essential for delivering electricity to residential and commercial settings. However, the increasing digitization and connectivity of electric grids have introduced new vulnerabilities. Malicious actors, including hackers, cybercriminals, and state-sponsored groups, may target electric service companies to disrupt operations, steal sensitive information, or cause physical damage.
  • These cyber-attacks can lead to power outages, equipment failures, and service interruptions, negatively impacting customers. Critical systems such as Supervisory Control and Data Acquisition (SCADA) systems, grid control centers, and communication networks are particularly vulnerable. Disruptions to these systems can cause significant disruptions to electric service delivery. For instance, a cyber-attack on a SCADA system could lead to the mismanagement of power generation and distribution, resulting in power outages or even equipment damage. In conclusion, electric service companies face a growing threat from cyber-attacks. These attacks can cause significant disruptions to electric service delivery, negatively impacting customers and the economy.

Exclusive Customer Landscape

The market forecasting report includes the adoption lifecycle of the market, covering from the innovator's stage to the laggard's stage. It focuses on adoption rates in different regions based on penetration. Furthermore, the market report also includes key purchase criteria and drivers of price sensitivity to help companies evaluate and develop their market growth analysis strategies.

Electric Service Companies Market Share by Geography

 Customer Landscape

Key Companies & Market Insights

Companies are implementing various strategies, such as strategic alliances, market forecast, partnerships, mergers and acquisitions, geographical expansion, and product/service launches, to enhance their presence in the market.

The market research and growth report includes detailed analyses of the competitive landscape of the market and information about key companies, including:

  • Alpiq Holding Ltd.
  • Center Line Electric Inc.
  • Eaton Corp. Plc
  • Electric Services Inc.
  • Enel Spa
  • Facility Solutions Group
  • General Electric Co.
  • George Brazil Plumbing and Electrical
  • GREENWAY ELECTRICAL
  • Helix Electric
  • Honeywell International Inc.
  • Johnson Controls
  • MMR Group
  • Nextera Energy Inc.
  • Schneider Electric SE
  • Toko Electrical Construction Co. Ltd.
  • Veolia Environnement SA
  • Iberdrola SA
  • Mister Sparky Franchising SPE LLC
  • Siemens AG

Qualitative and quantitative analysis of companies has been conducted to help clients understand the wider business environment as well as the strengths and weaknesses of key market players. Data is qualitatively analyzed to categorize companies as pure play, category-focused, industry-focused, and diversified; it is quantitatively analyzed to categorize companies as dominant, leading, strong, tentative, and weak.

Research Analyst Overview

Electric service companies play a crucial role in meeting the energy demands of modern society. With the increasing focus on energy conservation and efficiency, these companies are at the forefront of providing solutions for both residential and commercial settings. They offer a range of services from electrical power generation using renewable energy sources like wind and solar, to energy management and optimization. Energy efficiency projects, such as retrofitting buildings with energy-efficient equipment and lighting systems, are a key area of focus. HVAC systems and lighting retrofits are common practices to reduce energy consumption and improve performance. Renewable energy integration, including the installation and maintenance of solar panels and wind turbines, is another important service. Electric service companies also provide energy management software and services, including energy consumption tracking and performance optimization. They offer energy audit services to help identify areas of improvement and provide solutions for energy security measures during energy crises.

In addition to electrical power generation and management, these companies provide electrical engineering services for stable power distribution and maintenance of electrical components. They employ electricians, technicians, and maintenance services for repairs and troubleshooting in both residential and commercial settings. Electric service companies are also involved in the development of modern electrical systems, including smart homes and buildings, and the integration of electric vehicles and charging infrastructure. They provide installation, maintenance, and repair services for electrical hardware and components, as well as smart grid technologies like self-healing grids and power system integration. Investment in infrastructure development and the integration of renewable energy systems, energy storage systems, and industrial automation are key areas of growth for electric service companies. They offer a range of solutions for energy security, power conversion, and battery storage systems to prevent equipment failure and ensure reliable power distribution.

Market Scope

Report Coverage

Details

Page number

163

Base year

2023

Historic period

2018-2022

Forecast period

2024-2028

Growth momentum & CAGR

Accelerate at a CAGR of 7.46%

Market growth 2024-2028

USD 13.45 billion

Market structure

Fragmented

YoY growth 2023-2024(%)

7.32

Key countries

US, China, India, Germany, and France

Competitive landscape

Leading Companies, Market Positioning of Companies, Competitive Strategies, and Industry Risks

Request Free Sample

What are the Key Data Covered in this Market Research and Growth Report?

  • CAGR of the market during the forecast period
  • Detailed information on factors that will drive the market growth and forecasting between 2024 and 2028
  • Precise estimation of the size of the market  and its contribution of the market in focus to the parent market
  • Accurate predictions about upcoming market growth and trends and changes in consumer behaviour
  • Growth of the market across North America, APAC, Europe, South America, and Middle East and Africa
  • Thorough analysis of the market's competitive landscape and detailed information about companies
  • Comprehensive analysis of factors that will challenge the growth of market companies

We can help! Our analysts can customize this market research report to meet your requirements. Get in touch

1 Executive Summary

  • 1.1 Market overview
    • Exhibit 01: Executive Summary – Chart on Market Overview
    • Exhibit 02: Executive Summary – Data Table on Market Overview
    • Exhibit 03: Executive Summary – Chart on Global Market Characteristics
    • Exhibit 04: Executive Summary – Chart on Market by Geography
    • Exhibit 05: Executive Summary – Chart on Market Segmentation by Type
    • Exhibit 06: Executive Summary – Chart on Market Segmentation by End-user
    • Exhibit 07: Executive Summary – Chart on Incremental Growth
    • Exhibit 08: Executive Summary – Data Table on Incremental Growth
    • Exhibit 09: Executive Summary – Chart on Vendor Market Positioning

2 Market Landscape

  • 2.1 Market ecosystem
    • Exhibit 10: Parent market
    • Exhibit 11: Market Characteristics

3 Market Sizing

  • 3.1 Market definition
    • Exhibit 12: Offerings of vendors included in the market definition
  • 3.2 Market segment analysis
    • Exhibit 13: Market segments
  • 3.3 Market size 2023
    • 3.4 Market outlook: Forecast for 2023-2028
      • Exhibit 14: Chart on Global - Market size and forecast 2023-2028 ($ billion)
      • Exhibit 15: Data Table on Global - Market size and forecast 2023-2028 ($ billion)
      • Exhibit 16: Chart on Global Market: Year-over-year growth 2023-2028 (%)
      • Exhibit 17: Data Table on Global Market: Year-over-year growth 2023-2028 (%)

    4 Historic Market Size

    • 4.1 Global electric service companies market 2018 - 2022
      • Exhibit 18: Historic Market Size – Data Table on global electric service companies market 2018 - 2022 ($ billion)
    • 4.2 Type Segment Analysis 2018 - 2022
      • Exhibit 19: Historic Market Size – Type Segment 2018 - 2022 ($ billion)
    • 4.3 End-user Segment Analysis 2018 - 2022
      • Exhibit 20: Historic Market Size – End-user Segment 2018 - 2022 ($ billion)
    • 4.4 Geography Segment Analysis 2018 - 2022
      • Exhibit 21: Historic Market Size – Geography Segment 2018 - 2022 ($ billion)
    • 4.5 Country Segment Analysis 2018 - 2022
      • Exhibit 22: Historic Market Size – Country Segment 2018 - 2022 ($ billion)

    5 Five Forces Analysis

    • 5.1 Five forces summary
      • Exhibit 23: Five forces analysis - Comparison between 2023 and 2028
    • 5.2 Bargaining power of buyers
      • Exhibit 24: Chart on Bargaining power of buyers – Impact of key factors 2023 and 2028
    • 5.3 Bargaining power of suppliers
      • Exhibit 25: Bargaining power of suppliers – Impact of key factors in 2023 and 2028
    • 5.4 Threat of new entrants
      • Exhibit 26: Threat of new entrants – Impact of key factors in 2023 and 2028
    • 5.5 Threat of substitutes
      • Exhibit 27: Threat of substitutes – Impact of key factors in 2023 and 2028
    • 5.6 Threat of rivalry
      • Exhibit 28: Threat of rivalry – Impact of key factors in 2023 and 2028
    • 5.7 Market condition
      • Exhibit 29: Chart on Market condition - Five forces 2023 and 2028

    6 Market Segmentation by Type

    • 6.1 Market segments
      • Exhibit 30: Chart on Type - Market share 2023-2028 (%)
      • Exhibit 31: Data Table on Type - Market share 2023-2028 (%)
    • 6.2 Comparison by Type
      • Exhibit 32: Chart on Comparison by Type
      • Exhibit 33: Data Table on Comparison by Type
    • 6.3 SMEs - Market size and forecast 2023-2028
      • Exhibit 34: Chart on SMEs - Market size and forecast 2023-2028 ($ billion)
      • Exhibit 35: Data Table on SMEs - Market size and forecast 2023-2028 ($ billion)
      • Exhibit 36: Chart on SMEs - Year-over-year growth 2023-2028 (%)
      • Exhibit 37: Data Table on SMEs - Year-over-year growth 2023-2028 (%)
    • 6.4 Large enterprises - Market size and forecast 2023-2028
      • Exhibit 38: Chart on Large enterprises - Market size and forecast 2023-2028 ($ billion)
      • Exhibit 39: Data Table on Large enterprises - Market size and forecast 2023-2028 ($ billion)
      • Exhibit 40: Chart on Large enterprises - Year-over-year growth 2023-2028 (%)
      • Exhibit 41: Data Table on Large enterprises - Year-over-year growth 2023-2028 (%)
    • 6.5 Market opportunity by Type
      • Exhibit 42: Market opportunity by Type ($ billion)
      • Exhibit 43: Data Table on Market opportunity by Type ($ billion)

    7 Market Segmentation by End-user

    • 7.1 Market segments
      • Exhibit 44: Chart on End-user - Market share 2023-2028 (%)
      • Exhibit 45: Data Table on End-user - Market share 2023-2028 (%)
    • 7.2 Comparison by End-user
      • Exhibit 46: Chart on Comparison by End-user
      • Exhibit 47: Data Table on Comparison by End-user
    • 7.3 Commercial - Market size and forecast 2023-2028
      • Exhibit 48: Chart on Commercial - Market size and forecast 2023-2028 ($ billion)
      • Exhibit 49: Data Table on Commercial - Market size and forecast 2023-2028 ($ billion)
      • Exhibit 50: Chart on Commercial - Year-over-year growth 2023-2028 (%)
      • Exhibit 51: Data Table on Commercial - Year-over-year growth 2023-2028 (%)
    • 7.4 Industrial - Market size and forecast 2023-2028
      • Exhibit 52: Chart on Industrial - Market size and forecast 2023-2028 ($ billion)
      • Exhibit 53: Data Table on Industrial - Market size and forecast 2023-2028 ($ billion)
      • Exhibit 54: Chart on Industrial - Year-over-year growth 2023-2028 (%)
      • Exhibit 55: Data Table on Industrial - Year-over-year growth 2023-2028 (%)
    • 7.5 Residential - Market size and forecast 2023-2028
      • Exhibit 56: Chart on Residential - Market size and forecast 2023-2028 ($ billion)
      • Exhibit 57: Data Table on Residential - Market size and forecast 2023-2028 ($ billion)
      • Exhibit 58: Chart on Residential - Year-over-year growth 2023-2028 (%)
      • Exhibit 59: Data Table on Residential - Year-over-year growth 2023-2028 (%)
    • 7.6 Market opportunity by End-user
      • Exhibit 60: Market opportunity by End-user ($ billion)
      • Exhibit 61: Data Table on Market opportunity by End-user ($ billion)

    8 Customer Landscape

    • 8.1 Customer landscape overview
      • Exhibit 62: Analysis of price sensitivity, lifecycle, customer purchase basket, adoption rates, and purchase criteria

    9 Geographic Landscape

    • 9.1 Geographic segmentation
      • Exhibit 63: Chart on Market share by geography 2023-2028 (%)
      • Exhibit 64: Data Table on Market share by geography 2023-2028 (%)
    • 9.2 Geographic comparison
      • Exhibit 65: Chart on Geographic comparison
      • Exhibit 66: Data Table on Geographic comparison
    • 9.3 North America - Market size and forecast 2023-2028
      • Exhibit 67: Chart on North America - Market size and forecast 2023-2028 ($ billion)
      • Exhibit 68: Data Table on North America - Market size and forecast 2023-2028 ($ billion)
      • Exhibit 69: Chart on North America - Year-over-year growth 2023-2028 (%)
      • Exhibit 70: Data Table on North America - Year-over-year growth 2023-2028 (%)
    • 9.4 APAC - Market size and forecast 2023-2028
      • Exhibit 71: Chart on APAC - Market size and forecast 2023-2028 ($ billion)
      • Exhibit 72: Data Table on APAC - Market size and forecast 2023-2028 ($ billion)
      • Exhibit 73: Chart on APAC - Year-over-year growth 2023-2028 (%)
      • Exhibit 74: Data Table on APAC - Year-over-year growth 2023-2028 (%)
    • 9.5 Europe - Market size and forecast 2023-2028
      • Exhibit 75: Chart on Europe - Market size and forecast 2023-2028 ($ billion)
      • Exhibit 76: Data Table on Europe - Market size and forecast 2023-2028 ($ billion)
      • Exhibit 77: Chart on Europe - Year-over-year growth 2023-2028 (%)
      • Exhibit 78: Data Table on Europe - Year-over-year growth 2023-2028 (%)
    • 9.6 South America - Market size and forecast 2023-2028
      • Exhibit 79: Chart on South America - Market size and forecast 2023-2028 ($ billion)
      • Exhibit 80: Data Table on South America - Market size and forecast 2023-2028 ($ billion)
      • Exhibit 81: Chart on South America - Year-over-year growth 2023-2028 (%)
      • Exhibit 82: Data Table on South America - Year-over-year growth 2023-2028 (%)
    • 9.7 Middle East and Africa - Market size and forecast 2023-2028
      • Exhibit 83: Chart on Middle East and Africa - Market size and forecast 2023-2028 ($ billion)
      • Exhibit 84: Data Table on Middle East and Africa - Market size and forecast 2023-2028 ($ billion)
      • Exhibit 85: Chart on Middle East and Africa - Year-over-year growth 2023-2028 (%)
      • Exhibit 86: Data Table on Middle East and Africa - Year-over-year growth 2023-2028 (%)
    • 9.8 US - Market size and forecast 2023-2028
      • Exhibit 87: Chart on US - Market size and forecast 2023-2028 ($ billion)
      • Exhibit 88: Data Table on US - Market size and forecast 2023-2028 ($ billion)
      • Exhibit 89: Chart on US - Year-over-year growth 2023-2028 (%)
      • Exhibit 90: Data Table on US - Year-over-year growth 2023-2028 (%)
    • 9.9 China - Market size and forecast 2023-2028
      • Exhibit 91: Chart on China - Market size and forecast 2023-2028 ($ billion)
      • Exhibit 92: Data Table on China - Market size and forecast 2023-2028 ($ billion)
      • Exhibit 93: Chart on China - Year-over-year growth 2023-2028 (%)
      • Exhibit 94: Data Table on China - Year-over-year growth 2023-2028 (%)
    • 9.10 Germany - Market size and forecast 2023-2028
      • Exhibit 95: Chart on Germany - Market size and forecast 2023-2028 ($ billion)
      • Exhibit 96: Data Table on Germany - Market size and forecast 2023-2028 ($ billion)
      • Exhibit 97: Chart on Germany - Year-over-year growth 2023-2028 (%)
      • Exhibit 98: Data Table on Germany - Year-over-year growth 2023-2028 (%)
    • 9.11 France - Market size and forecast 2023-2028
      • Exhibit 99: Chart on France - Market size and forecast 2023-2028 ($ billion)
      • Exhibit 100: Data Table on France - Market size and forecast 2023-2028 ($ billion)
      • Exhibit 101: Chart on France - Year-over-year growth 2023-2028 (%)
      • Exhibit 102: Data Table on France - Year-over-year growth 2023-2028 (%)
    • 9.12 India - Market size and forecast 2023-2028
      • Exhibit 103: Chart on India - Market size and forecast 2023-2028 ($ billion)
      • Exhibit 104: Data Table on India - Market size and forecast 2023-2028 ($ billion)
      • Exhibit 105: Chart on India - Year-over-year growth 2023-2028 (%)
      • Exhibit 106: Data Table on India - Year-over-year growth 2023-2028 (%)
    • 9.13 Market opportunity by geography
      • Exhibit 107: Market opportunity by geography ($ billion)
      • Exhibit 108: Data Tables on Market opportunity by geography ($ billion)

    10 Drivers, Challenges, and Trends

    • 10.1 Market drivers
      • 10.2 Market challenges
        • 10.3 Impact of drivers and challenges
          • Exhibit 109: Impact of drivers and challenges in 2023 and 2028
        • 10.4 Market trends

          11 Vendor Landscape

          • 11.1 Overview
            • 11.2 Vendor landscape
              • Exhibit 110: Overview on Criticality of inputs and Factors of differentiation
            • 11.3 Landscape disruption
              • Exhibit 111: Overview on factors of disruption
            • 11.4 Industry risks
              • Exhibit 112: Impact of key risks on business

            12 Vendor Analysis

            • 12.1 Vendors covered
              • Exhibit 113: Vendors covered
            • 12.2 Market positioning of vendors
              • Exhibit 114: Matrix on vendor position and classification
            • 12.3 Alpiq Holding Ltd.
              • Exhibit 115: Alpiq Holding Ltd. - Overview
              • Exhibit 116: Alpiq Holding Ltd. - Business segments
              • Exhibit 117: Alpiq Holding Ltd. - Key offerings
              • Exhibit 118: Alpiq Holding Ltd. - Segment focus
            • 12.4 Center Line Electric Inc.
              • Exhibit 119: Center Line Electric Inc. - Overview
              • Exhibit 120: Center Line Electric Inc. - Product / Service
              • Exhibit 121: Center Line Electric Inc. - Key offerings
            • 12.5 Eaton Corp. Plc
              • Exhibit 122: Eaton Corp. Plc - Overview
              • Exhibit 123: Eaton Corp. Plc - Business segments
              • Exhibit 124: Eaton Corp. Plc - Key offerings
              • Exhibit 125: Eaton Corp. Plc - Segment focus
            • 12.6 Enel Spa
              • Exhibit 126: Enel Spa - Overview
              • Exhibit 127: Enel Spa - Product / Service
              • Exhibit 128: Enel Spa - Key offerings
            • 12.7 General Electric Co.
              • Exhibit 129: General Electric Co. - Overview
              • Exhibit 130: General Electric Co. - Business segments
              • Exhibit 131: General Electric Co. - Key news
              • Exhibit 132: General Electric Co. - Key offerings
              • Exhibit 133: General Electric Co. - Segment focus
            • 12.8 GREENWAY ELECTRICAL
              • Exhibit 134: GREENWAY ELECTRICAL - Overview
              • Exhibit 135: GREENWAY ELECTRICAL - Product / Service
              • Exhibit 136: GREENWAY ELECTRICAL - Key offerings
            • 12.9 Helix Electric
              • Exhibit 137: Helix Electric - Overview
              • Exhibit 138: Helix Electric - Product / Service
              • Exhibit 139: Helix Electric - Key offerings
            • 12.10 Honeywell International Inc.
              • Exhibit 140: Honeywell International Inc. - Overview
              • Exhibit 141: Honeywell International Inc. - Business segments
              • Exhibit 142: Honeywell International Inc. - Key news
              • Exhibit 143: Honeywell International Inc. - Key offerings
              • Exhibit 144: Honeywell International Inc. - Segment focus
            • 12.11 Johnson Controls
              • Exhibit 145: Johnson Controls - Overview
              • Exhibit 146: Johnson Controls - Business segments
              • Exhibit 147: Johnson Controls - Key news
              • Exhibit 148: Johnson Controls - Key offerings
              • Exhibit 149: Johnson Controls - Segment focus
            • 12.12 Mister Sparky Franchising SPE LLC
              • Exhibit 150: Mister Sparky Franchising SPE LLC - Overview
              • Exhibit 151: Mister Sparky Franchising SPE LLC - Product / Service
              • Exhibit 152: Mister Sparky Franchising SPE LLC - Key offerings
            • 12.13 MMR Group
              • Exhibit 153: MMR Group - Overview
              • Exhibit 154: MMR Group - Product / Service
              • Exhibit 155: MMR Group - Key offerings
            • 12.14 Schneider Electric SE
              • Exhibit 156: Schneider Electric SE - Overview
              • Exhibit 157: Schneider Electric SE - Business segments
              • Exhibit 158: Schneider Electric SE - Key offerings
              • Exhibit 159: Schneider Electric SE - Segment focus
            • 12.15 Siemens AG
              • Exhibit 160: Siemens AG - Overview
              • Exhibit 161: Siemens AG - Business segments
              • Exhibit 162: Siemens AG - Key news
              • Exhibit 163: Siemens AG - Key offerings
              • Exhibit 164: Siemens AG - Segment focus
            • 12.16 Toko Electrical Construction Co. Ltd.
              • Exhibit 165: Toko Electrical Construction Co. Ltd. - Overview
              • Exhibit 166: Toko Electrical Construction Co. Ltd. - Product / Service
              • Exhibit 167: Toko Electrical Construction Co. Ltd. - Key offerings
            • 12.17 Veolia Environnement SA
              • Exhibit 168: Veolia Environnement SA - Overview
              • Exhibit 169: Veolia Environnement SA - Business segments
              • Exhibit 170: Veolia Environnement SA - Key news
              • Exhibit 171: Veolia Environnement SA - Key offerings
              • Exhibit 172: Veolia Environnement SA - Segment focus

            13 Appendix

            • 13.1 Scope of the report
              • 13.2 Inclusions and exclusions checklist
                • Exhibit 173: Inclusions checklist
                • Exhibit 174: Exclusions checklist
              • 13.3 Currency conversion rates for US$
                • Exhibit 175: Currency conversion rates for US$
              • 13.4 Research methodology
                • Exhibit 176: Research methodology
                • Exhibit 177: Validation techniques employed for market sizing
                • Exhibit 178: Information sources
              • 13.5 List of abbreviations
                • Exhibit 179: List of abbreviations

              Research Methodology

              Technavio presents a detailed picture of the market by way of study, synthesis, and summation of data from multiple sources. The analysts have presented the various facets of the market with a particular focus on identifying the key industry influencers. The data thus presented is comprehensive, reliable, and the result of extensive research, both primary and secondary.

              INFORMATION SOURCES

              Primary sources

              • Manufacturers and suppliers
              • Channel partners
              • Industry experts
              • Strategic decision makers

              Secondary sources

              • Industry journals and periodicals
              • Government data
              • Financial reports of key industry players
              • Historical data
              • Press releases

              DATA ANALYSIS

              Data Synthesis

              • Collation of data
              • Estimation of key figures
              • Analysis of derived insights

              Data Validation

              • Triangulation with data models
              • Reference against proprietary databases
              • Corroboration with industry experts

              REPORT WRITING

              Qualitative

              • Market drivers
              • Market challenges
              • Market trends
              • Five forces analysis

              Quantitative

              • Market size and forecast
              • Market segmentation
              • Geographical insights
              • Competitive landscape

              Interested in this report?

              Get your sample now to see our research methodology and insights!

              Download Now

              Frequently Asked Questions

              Electric Service Companies market growth will increase by $ 13.45 bn during 2024-2028 .

              The Electric Service Companies market is expected to grow at a CAGR of 7.46% during 2024-2028 .

              Electric Service Companies market is segmented by Type( SMEs, Large enterprises) End-user( Commercial, Industrial, Residential)

              Alpiq Holding Ltd., Center Line Electric Inc., Eaton Corp. Plc, Electric Services Inc., Enel Spa, Facility Solutions Group, General Electric Co., George Brazil Plumbing and Electrical, GREENWAY ELECTRICAL, Helix Electric, Honeywell International Inc., Johnson Controls, MMR Group, Nextera Energy Inc., Schneider Electric SE, Toko Electrical Construction Co. Ltd., Veolia Environnement SA, Iberdrola SA, Mister Sparky Franchising SPE LLC, Siemens AG are a few of the key vendors in the Electric Service Companies market.

              North America will register the highest growth rate of 35% among the other regions. Therefore, the Electric Service Companies market in North America is expected to garner significant business opportunities for the vendors during the forecast period.

              US, China, India, Germany, France

              • Growing deployment of smart grid technologiesThe implementation of smart grid technology is the driving factor this market.
              • such as advanced metering infrastructure (AMI) is the driving factor this market.
              • distribution automation is the driving factor this market.
              • grid analytics is the driving factor this market.
              • and demand response systems is the driving factor this market.
              • generates demand for specialized services given by electric service companies. These services include installation is the driving factor this market.
              • integration is the driving factor this market.
              • maintenance is the driving factor this market.
              • and optimization of smart grid components and systems. Electric service companies play a crucial role in integrating various smart grid components and systems into existing infrastructure. They provide expertise in system design is the driving factor this market.
              • engineering is the driving factor this market.
              • installation is the driving factor this market.
              • and testing to ensure seamless integration and interoperability of smart grid technologies across the grid. Additionally is the driving factor this market.
              • smart grid deployment is often part of broader grid modernization initiatives aimed at upgrading aging infrastructure is the driving factor this market.
              • enhancing grid resilience is the driving factor this market.
              • and improving operational efficiency. Electric service companies are involved in implementing grid modernization projects is the driving factor this market.
              • including equipment upgrades is the driving factor this market.
              • substation automation is the driving factor this market.
              • and network optimization. Moreover is the driving factor this market.
              • smart grid technologies enable utilities to implement demand response programs and energy management solutions is the driving factor this market.
              • which rely on real-time data and analytics to optimize energy usage and reduce peak demand. Electric service companies provide demand response services is the driving factor this market.
              • energy audits is the driving factor this market.
              • and energy management solutions to help customers optimize their energy consumption and participate in demand response programs. Furthermore is the driving factor this market.
              • smart grid technologies facilitate the integration of renewable energy resources is the driving factor this market.
              • such as solar and wind power is the driving factor this market.
              • into the grid by enabling better forecasting is the driving factor this market.
              • monitoring is the driving factor this market.
              • and control of distributed energy resources. Electric service companies offer services related to renewable energy integration is the driving factor this market.
              • including grid interconnection is the driving factor this market.
              • integration studies is the driving factor this market.
              • and distributed energy resource management. Smart grid technologies improve grid reliability and resilience by enabling real-time monitoring is the driving factor this market.
              • predictive maintenance is the driving factor this market.
              • and automated fault detection and restoration. Electric service companies provide services to enhance grid reliability is the driving factor this market.
              • such as asset management is the driving factor this market.
              • predictive maintenance is the driving factor this market.
              • and outage management systems. Thus is the driving factor this market.
              • the growing deployment of smart grid technologies will enhance the growth of the global electric service companies market during the forecast period. is the driving factor this market.

              The Electric Service Companies market vendors should focus on grabbing business opportunities from the SMEs segment as it accounted for the largest market share in the base year.