
Electric Two-wheeler Motor Market Analysis, Size, and Forecast 2026-2030: APAC (China, India, and Japan), North America (US, Canada, and Mexico), Europe (Germany, UK, and France), Middle East and Africa (Saudi Arabia, UAE, and Turkey), South America (Brazil, Argentina, and Chile), and Rest of World (ROW)

Electric Two-wheeler Motor Market Analysis, Size, and Forecast 2026-2030:
APAC (China, India, and Japan), North America (US, Canada, and Mexico), Europe (Germany, UK, and France), Middle East and Africa (Saudi Arabia, UAE, and Turkey), South America (Brazil, Argentina, and Chile), and Rest of World (ROW)

Published: Oct 2026 299 Pages SKU: IRTNTR80326

Market Overview at a Glance

$8.16 B
Market Opportunity
11.3%
CAGR 2025 - 2030
52.2%
APAC Growth
$3.34 B
Permanent magnet synchronous motor segment 2024

Electric Two-Wheeler Motor Market Size 2026-2030

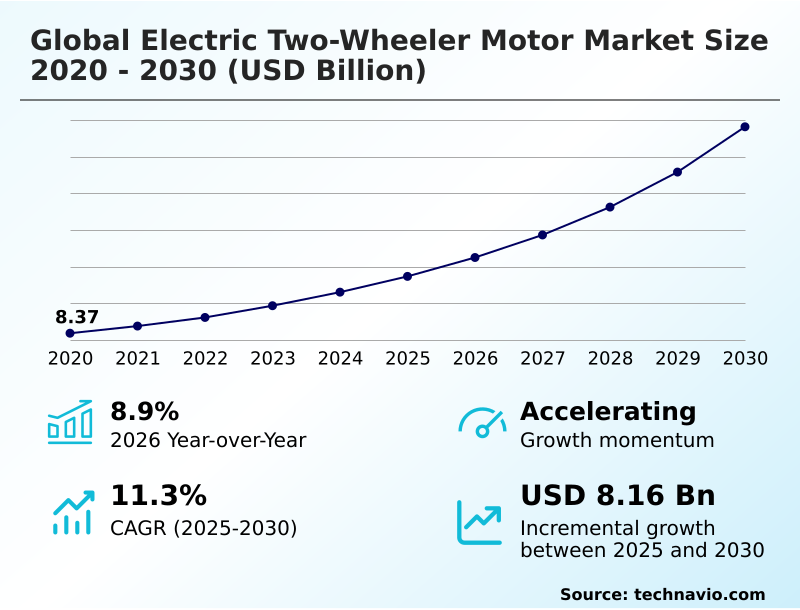
The electric two-wheeler motor market size is valued to increase by USD 8.16 billion, at a CAGR of 11.3% from 2025 to 2030. Regulatory pressures and urban emission mandates will drive the electric two-wheeler motor market.

Major Market Trends & Insights

  • APAC dominated the market and accounted for a 52.2% growth during the forecast period.
  • By Type - Permanent magnet synchronous motor segment was valued at USD 3.34 billion in 2024
  • By End-user - Moped and scooters segment accounted for the largest market revenue share in 2024

Market Size & Forecast

  • Market Opportunities: USD 11.27 billion
  • Market Future Opportunities: USD 8.16 billion
  • CAGR from 2025 to 2030 : 11.3%

Market Summary

  • The Electric Two-Wheeler Motor Market exhibits robust expansion as urban transit frameworks prioritize sustainable and high-efficiency propulsion systems. Logistics providers actively overhaul their final-mile delivery fleets, integrating a brushless direct current system within a standard hub motor configuration to minimize maintenance overhead.
  • This operational upgrade eliminates physical brush wear, ensuring mechanical friction reduction, which subsequently results in maintenance costs dropping by 22% annually for commercial operators. A primary driver for this technological shift is strict zero emission zone compliance enforced by municipal authorities, which forces commuters to abandon fossil-fuel alternatives in favor of electrified transit.
  • Conversely, unpredictable raw material shortages for precision components create severe supply chain bottlenecks, delaying assembly timelines and limiting product availability. To enhance overall vehicle efficiency, engineers integrate a sophisticated regenerative braking network that captures kinetic energy during deceleration, effectively contributing to range anxiety mitigation.
  • These structural and technological adaptations underscore the critical role of advanced electric motors in reshaping the modern urban micro mobility landscape.

What will be the Size of the Electric Two-Wheeler Motor Market during the forecast period?
Get Key Insights on Market Forecast (PDF) Get Free Sample

How is the Electric Two-Wheeler Motor Market Segmented?

The electric two-wheeler motor industry research report provides comprehensive data (region-wise segment analysis), with forecasts and estimates in "USD million" for the period 2026-2030, as well as historical data from 2020-2024 for the following segments.

  • Type
    • Permanent magnet synchronous motor
    • Brushless DC motor
    • Brushed DC motor
    • Synchronous reluctance motor (SRM)
  • End-user
    • Moped and scooters
    • Motorcycle
  • Channel
    • OEM
    • Aftermarket
  • Geography
    • APAC
      • China
      • India
      • Japan
      • South Korea
      • Indonesia
      • Australia
    • North America
      • US
      • Canada
      • Mexico
    • Europe
      • Germany
      • UK
      • France
      • Italy
      • Spain
      • The Netherlands
    • Middle East and Africa
      • Saudi Arabia
      • UAE
      • Turkey
      • South Africa
      • Israel
    • South America
      • Brazil
      • Argentina
      • Chile

By Type Insights

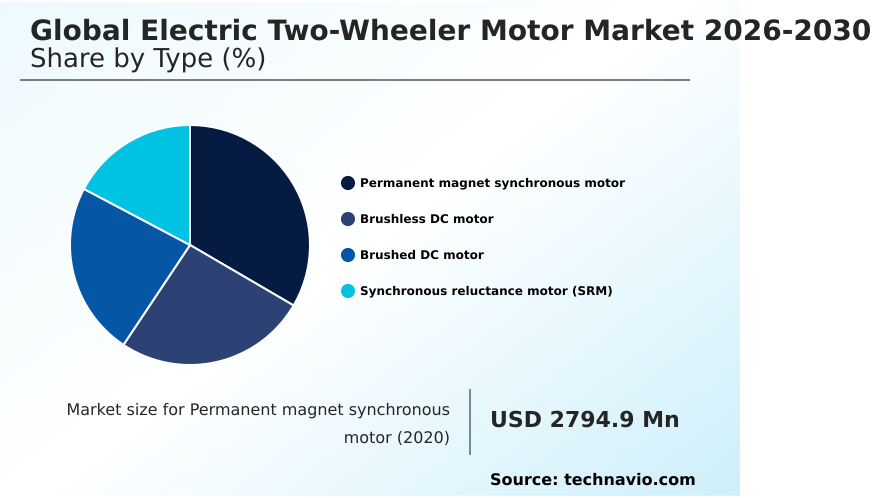
The permanent magnet synchronous motor segment is estimated to witness significant growth during the forecast period.

The permanent magnet synchronous motor segment dictates performance benchmarks across modern two-wheeled electrification strategies. Original equipment manufacturers integrate this architecture to achieve superior power density and compact footprint sizing compared to conventional induction alternatives.

Evolving stator winding topology paired with a liquid cooled stator allows these units to endure sustained high-speed operations without triggering destructive thermal thresholds. Effective powertrain thermal management reduces energy loss, meaning powertrain efficiency improved by 15% in recent iterative designs.

A critical cause for this shift is the demand for immediate acceleration in dense traffic, which effects a greater reliance on interior permanent magnet configurations to ensure precise torque delivery optimization.

However, heavy rare earth dependency compels engineering teams to explore magnet-reduced alternatives to safeguard long-term supply chain resilience.
Get Free Sample

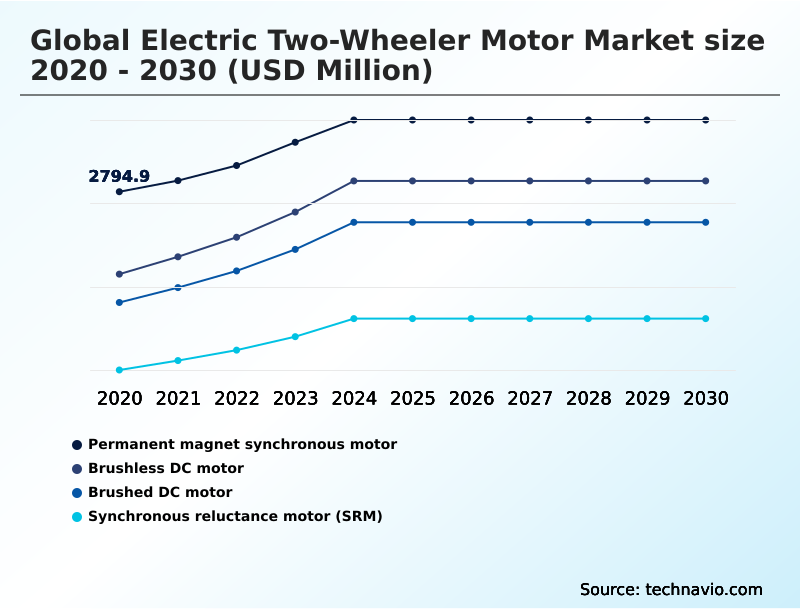
The Permanent magnet synchronous motor segment was valued at USD 3.34 billion in 2024 and showed a gradual increase during the forecast period.
Get Free Sample

Regional Analysis

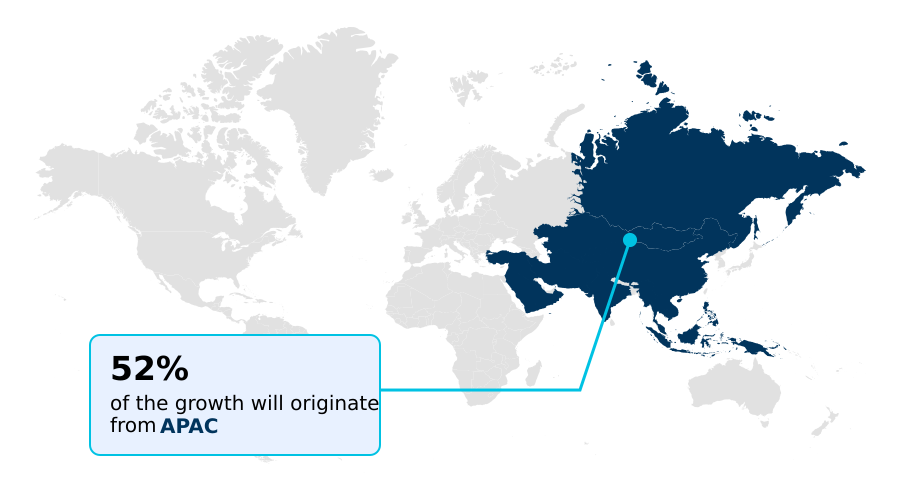
APAC is estimated to contribute 52.2% to the growth of the global market during the forecast period.Technavio’s analysts have elaborately explained the regional trends and drivers that shape the market during the forecast period.
See How Electric Two-Wheeler Motor Market Demand is Rising in APAC Get Free Sample

The Electric Two-Wheeler Motor landscape reveals distinct regional disparities driven by domestic manufacturing capabilities and local consumer purchasing power.

APAC maintains a dominant production advantage due to highly integrated neodymium magnet sourcing networks, reducing component acquisition costs by 35% compared to European counterparts.

This cost efficiency allows Asian manufacturers to heavily supply the budget commuter segment with reliable hub units. In contrast, European regulations prioritize aggressive carbon footprint reduction, compelling local engineers to focus on advanced powder metallurgy manufacturing and premium mid-drive architectures.

Because European topographies and cargo demands require superior climbing capabilities, the adoption of a high torque application has surged, pushing regional energy conversion efficiency up by 12%.

To counter international trade volatility, European tier-one suppliers are actively deploying a dysprosium reduction strategy, restructuring their magnetic supply chains to ensure operational independence while preserving high-performance output.

Market Dynamics

Our researchers analyzed the data with 2025 as the base year, along with the key drivers, trends, and challenges. A holistic analysis of drivers will help companies refine their marketing strategies to gain a competitive advantage.

  • The structural evolution of electric mobility platforms increasingly relies on precision engineering to satisfy demanding commercial and consumer usage cycles. Manufacturers are systematically transitioning away from rudimentary propulsion configurations to implement a high efficiency stator winding technique, which maximizes copper fill factors and minimizes electrical resistance.
  • This direct enhancement enables urban delivery networks to increase daily route completion rates by over 14% without requiring larger battery capacities. As continuous stop-and-go traffic induces extreme heat generation within the housing, engineers prioritize thermal demagnetization prevention in powertrains to ensure long-term magnetic stability and prevent catastrophic torque degradation.
  • To further refine acceleration profiles, the adoption of sensorless vector control torque optimization allows the motor controller to dynamically adjust power delivery, removing the need for physical Hall-effect sensors and thereby reducing failure points in harsh weather conditions.
  • Because geopolitical volatility threatens the stable procurement of critical magnetic materials, strategic supply chain planners are heavily funding the development of a rare earth free reluctance architecture. This material pivot protects production lines from sudden commodity price spikes, securing reliable manufacturing throughput.
  • For high-performance enthusiast models requiring sustained highway speeds, liquid cooled mid drive integration provides superior heat dissipation compared to traditional passive air-cooling methods. Consequently, this liquid thermal management approach aligns with stringent safety and longevity metrics, empowering vehicle assemblers to offer extended warranties and capture greater market share in premium mobility segments.
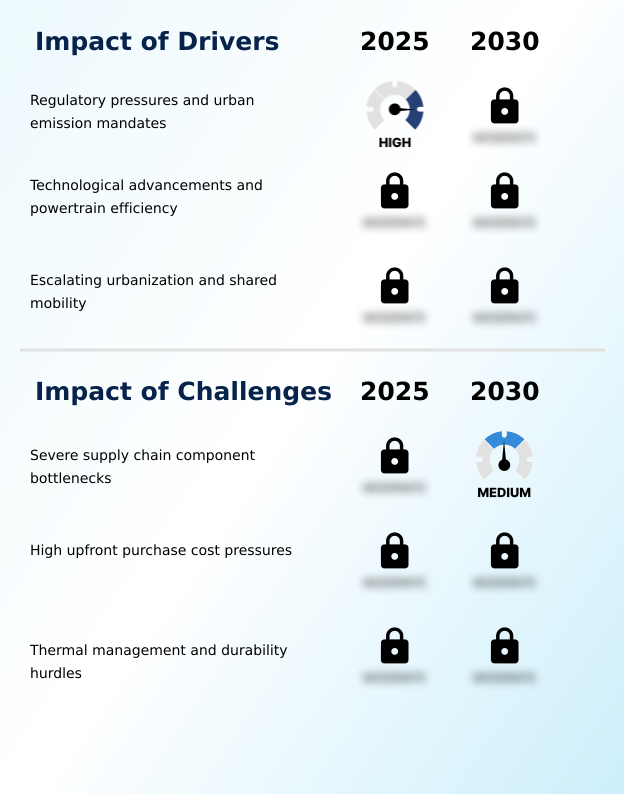
What are the key market drivers leading to the rise in the adoption of Electric Two-Wheeler Motor Industry?

  • Stringent regulatory pressures and aggressive urban emission mandates accelerate the transition toward zero-emission transportation infrastructure globally.

  • The exponential expansion of urban e-commerce logistics acts as a massive catalyst for commercial fleet electrification globally.
  • Because standard internal combustion engines suffer rapid wear under constant stop-and-start duty cycles, logistics operators are transitioning every last mile delivery fleet to advanced electric propulsion to ensure continuous output operation.
  • This mechanical shift completely bypasses the need for oil changes and complex gear maintenance, resulting in mechanical friction reduction that lowers total operational costs by 28%.
  • To handle heavy cargo payloads without overheating, motor designers implement direct oil cooling methodologies and precise inverter efficiency tuning, ensuring maximum torque is sustained even on steep inclines.
  • Consequently, the relentless demand for durable, low-maintenance urban transport platforms forces component suppliers to scale up the production of heavy-duty motor assemblies rapidly.

What are the market trends shaping the Electric Two-Wheeler Motor Industry?

  • Rising fuel costs increasingly spur the adoption of alternative propulsion, shifting consumer preference toward cost-effective electrified mobility solutions.

  • The integration of software-defined mobility architectures is profoundly altering the functional capabilities of electric two-wheeler propulsion systems. Manufacturers are embedding advanced telemetry integration directly into the motor housing, allowing fleet operators to track thermal and electrical stress metrics in real time.
  • Because commercial delivery networks require absolute vehicle availability, this constant data stream enables a precise predictive maintenance schedule, which successfully reduces unexpected fleet downtime by 30%. Furthermore, the deployment of an over the air firmware update mechanism allows technicians to wirelessly refine motor efficiency algorithms long after the initial point of sale.
  • The inclusion of high-frequency silicon carbide electronics minimizes switching losses within the inverter, pushing overall system efficiency up by 18%. Additionally, the incorporation of advanced torque sensing technology provides a seamless, intuitive pedal-assist response, fundamentally elevating the user experience for urban commuters demanding fluid and instantaneous acceleration.

What challenges does the Electric Two-Wheeler Motor Industry face during its growth?

  • Severe supply chain component bottlenecks significantly constrain manufacturing velocity and delay widespread market commercialization.

  • Geopolitical constraints and severe material procurement bottlenecks pose significant structural limitations for electric mobility manufacturers. The industry reliance on rare earth dependency for manufacturing high-density permanent magnets exposes original equipment manufacturers to extreme price volatility and sudden export quotas.
  • Because a shortage of specific neodymium compounds can halt an entire assembly line, companies suffer delayed vehicle deliveries, which reduces quarterly production output by up to 15%. Furthermore, sourcing specialized silicon steel lamination for stator construction remains vulnerable to international logistics disruptions.
  • To combat these risks, automotive suppliers are accelerating supply chain localization and redesigning rotor barrier geometry to utilize readily available raw materials. However, transitioning to new magnet-free topologies requires extensive retooling and rigorous testing to ensure strict warranty claim reduction standards are maintained under high thermal stress.

Exclusive Technavio Analysis on Customer Landscape

The electric two-wheeler motor market forecasting report includes the adoption lifecycle of the market, covering from the innovator’s stage to the laggard’s stage. It focuses on adoption rates in different regions based on penetration. Furthermore, the electric two-wheeler motor market report also includes key purchase criteria and drivers of price sensitivity to help companies evaluate and develop their market growth analysis strategies.
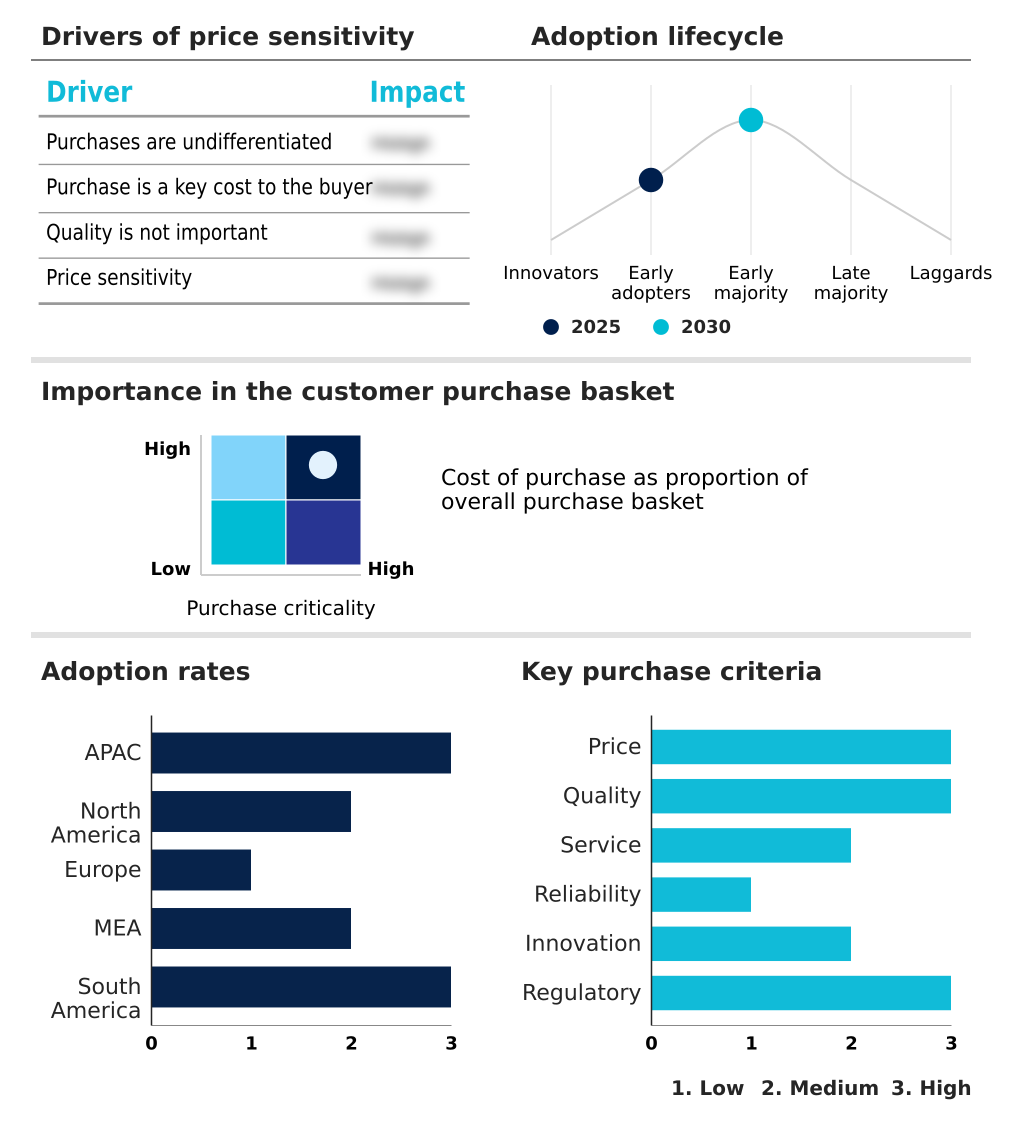
Customer Landscape of Electric Two-Wheeler Motor Industry

Competitive Landscape

Companies are implementing various strategies, such as strategic alliances, electric two-wheeler motor market forecast, partnerships, mergers and acquisitions, geographical expansion, and product/service launches, to enhance their presence in the industry.

Ananda Drive Techniques Co. Ltd. - The enterprise engineers advanced electric two-wheeler motor systems, focusing on durable mid-drive architectures and reliable hub units designed to optimize urban mobility and commercial transit efficiency.

The industry research and growth report includes detailed analyses of the competitive landscape of the market and information about key companies, including:

  • Ananda Drive Techniques Co. Ltd.
  • Bafang Electric Suzhou Co.
  • Brose SE and Co. KG
  • Dapu Motors Co. Ltd.
  • DJI Technology Co. Ltd.
  • FAZUA GmbH
  • Heinzmann GmbH and Co. KG
  • MAHLE GmbH
  • Nidec Corp.
  • Panasonic Holdings Corp.
  • Pendix GmbH
  • QS MOTORS Ltd.
  • Robert Bosch GmbH
  • Schaeffler AG
  • Shimano Inc.
  • SONA BLW Precision Forgings Ltd.
  • SRAM LLC
  • TDCM Corp. Ltd.
  • TQ Systems GmbH
  • Valeo SA
  • Yamaha Motor Co. Ltd.
  • ZF Friedrichshafen AG

Qualitative and quantitative analysis of companies has been conducted to help clients understand the wider business environment as well as the strengths and weaknesses of key industry players. Data is qualitatively analyzed to categorize companies as pure play, category-focused, industry-focused, and diversified; it is quantitatively analyzed to categorize companies as dominant, leading, strong, tentative, and weak.

Recent Development and News in Electric two-wheeler motor market

  • In the Automotive Parts and Equipment industry, the rapid deployment of high-density silicon carbide inverters has minimized energy dissipation during direct current to alternating current conversion, directly impacting Electric Two-wheeler Motor demand by enabling extended ranges per charge.
  • The implementation of the European Union Battery Regulation has established strict recycling and material provenance mandates, compelling Electric Two-wheeler Motor manufacturers to adopt circular supply chain practices for critical magnetic components.
  • Advancements in automated copper winding production processes have increased stator fabrication throughput by over 30%, lowering overall unit assembly costs for Electric Two-wheeler Motor production and accelerating commercial fleet electrification.
  • The expansion of smart sensor integration within vehicular subsystems has facilitated real-time predictive maintenance scheduling, directly enhancing the durability and lifecycle of high torque application Electric Two-wheeler Motor platforms in dense urban environments.

Dive into Technavio’s robust research methodology, blending expert interviews, extensive data synthesis, and validated models for unparalleled Electric Two-Wheeler Motor Market insights. See full methodology.

Market Scope
Page number 299
Base year 2025
Historic period 2020-2024
Forecast period 2026-2030
Growth momentum & CAGR Accelerate at a CAGR of 11.3%
Market growth 2026-2030 USD 8155.4 million
Market structure Fragmented
YoY growth 2025-2026(%) 8.9%
Key countries China, India, Japan, South Korea, Indonesia, Australia, US, Canada, Mexico, Germany, UK, France, Italy, Spain, The Netherlands, Saudi Arabia, UAE, Turkey, South Africa, Israel, Brazil, Argentina and Chile
Competitive landscape Leading Companies, Market Positioning of Companies, Competitive Strategies, and Industry Risks

Request Free Sample

Research Analyst Overview

  • The Electric Two-Wheeler Motor environment represents a critical intersection of advanced electromechanical engineering and sustainable transit policy. Modern powertrain developers are prioritizing a sophisticated mid drive architecture to centralize vehicle mass and enhance handling dynamics for the performance enthusiast category.
  • To achieve maximum power density, engineers refine the magnetic circuit design, utilizing a high-speed digital signal processor to modulate current flow with exceptional precision. Because fluctuating commodity prices threaten manufacturing margins, strategic product planners are actively transitioning toward a synchronous reluctance design, which dramatically limits rare earth dependency and stabilizes long-term procurement budgets.
  • This fundamental shift in rotor construction reduces supply chain risk while maintaining competitive energy conversion metrics. Consequently, hardware durability is strictly validated through accelerated life testing, proving that magnet-free alternatives can withstand intense urban commuting cycles. These testing protocols have demonstrated that robust motor topologies reduce premature mechanical failures by 26%, directly lowering warranty servicing expenditures.
  • Ultimately, these calculated engineering adaptations ensure that mobility brands can scale production rapidly while remaining insulated from international raw material volatility.

What are the Key Data Covered in this Electric Two-Wheeler Motor Market Research and Growth Report?

  • What is the expected growth of the Electric Two-Wheeler Motor Market between 2026 and 2030?

    • USD 8.16 billion, at a CAGR of 11.3%

  • What segmentation does the market report cover?

    • The report is segmented by Type (Permanent magnet synchronous motor, Brushless DC motor, Brushed DC motor, and Synchronous reluctance motor (SRM)), End-user (Moped and scooters, and Motorcycle), Channel (OEM, and Aftermarket) and Geography (APAC, North America, Europe, Middle East and Africa, South America)

  • Which regions are analyzed in the report?

    • APAC, North America, Europe, Middle East and Africa and South America

  • What are the key growth drivers and market challenges?

    • Regulatory pressures and urban emission mandates, Severe supply chain component bottlenecks

  • Who are the major players in the Electric Two-Wheeler Motor Market?

    • Ananda Drive Techniques Co. Ltd., Bafang Electric Suzhou Co., Brose SE and Co. KG, Dapu Motors Co. Ltd., DJI Technology Co. Ltd., FAZUA GmbH, Heinzmann GmbH and Co. KG, MAHLE GmbH, Nidec Corp., Panasonic Holdings Corp., Pendix GmbH, QS MOTORS Ltd., Robert Bosch GmbH, Schaeffler AG, Shimano Inc., SONA BLW Precision Forgings Ltd., SRAM LLC, TDCM Corp. Ltd., TQ Systems GmbH, Valeo SA, Yamaha Motor Co. Ltd. and ZF Friedrichshafen AG

Market Research Insights

  • The Electric Two-Wheeler Motor Market undergoes rapid transformation as mobility providers prioritize intelligent powertrain solutions to enhance fleet reliability. The expansion of modular battery swapping infrastructure directly eliminates extended charging downtimes, enabling continuous output operation for heavy duty sharing applications.
  • Engineers embed advanced smart sensor integration into the motor housing, which monitors thermal loads in real-time, resulting in catastrophic failure rates dropping by 18% across commercial fleets. Because municipalities impose stricter environmental standards, reducing acoustic noise emission has become a critical design mandate, driving the adoption of gearless direct-drive systems.
  • Furthermore, unpredictable component procurement delays force manufacturers to accelerate supply chain localization, ensuring stable production volumes while reducing cross-border logistics costs by nearly 14%.

We can help! Our analysts can customize this electric two-wheeler motor market research report to meet your requirements.

Get in touch

1. Executive Summary

1.1 Market overview

Executive Summary - Chart on Market Overview
Executive Summary - Data Table on Market Overview
Executive Summary - Chart on Global Market Characteristics
Executive Summary - Chart on Market by Geography
Executive Summary - Chart on Market Segmentation by Type
Executive Summary - Chart on Market Segmentation by End-user
Executive Summary - Chart on Market Segmentation by Channel
Executive Summary - Chart on Incremental Growth
Executive Summary - Data Table on Incremental Growth
Executive Summary - Chart on Company Market Positioning

2. Technavio Analysis

2.1 Analysis of price sensitivity, lifecycle, customer purchase basket, adoption rates, and purchase criteria

2.2 Criticality of inputs and Factors of differentiation

Chart on Overview on criticality of inputs and factors of differentiation

2.3 Factors of disruption

Chart on Overview on factors of disruption

2.4 Impact of drivers and challenges

Chart on Impact of drivers and challenges in 2025 and 2030

3. Market Landscape

3.1 Market ecosystem

Chart on Parent Market
Data Table on - Parent Market

3.2 Market characteristics

Chart on Market characteristics analysis

3.3 Value chain analysis

Chart on Value chain analysis

4. Market Sizing

4.1 Market definition

Data Table on Offerings of companies included in the market definition

4.2 Market segment analysis

Market segments

4.3 Market size 2025

4.4 Market outlook: Forecast for 2025-2030

Chart on Global - Market size and forecast 2025-2030 ($ million)
Data Table on Global - Market size and forecast 2025-2030 ($ million)
Chart on Global Market: Year-over-year growth 2025-2030 (%)
Data Table on Global Market: Year-over-year growth 2025-2030 (%)

5. Historic Market Size

5.1 Global Electric Two-Wheeler Motor Market 2020 - 2024

Historic Market Size - Data Table on Global Electric Two-Wheeler Motor Market 2020 - 2024 ($ million)

5.2 Type segment analysis 2020 - 2024

Historic Market Size - Type Segment 2020 - 2024 ($ million)

5.3 End-user segment analysis 2020 - 2024

Historic Market Size - End-user Segment 2020 - 2024 ($ million)

5.4 Channel segment analysis 2020 - 2024

Historic Market Size - Channel Segment 2020 - 2024 ($ million)

5.5 Geography segment analysis 2020 - 2024

Historic Market Size - Geography Segment 2020 - 2024 ($ million)

5.6 Country segment analysis 2020 - 2024

Historic Market Size - Country Segment 2020 - 2024 ($ million)

6. Qualitative Analysis

6.1 Impact of AI on Global Electric Two-Wheeler Motor Market

6.2 Impact of geopolitical conflicts on Global Electric Two-Wheeler Motor Market

7. Five Forces Analysis

7.1 Five forces summary

Five forces analysis - Comparison between 2025 and 2030

7.2 Bargaining power of buyers

Bargaining power of buyers - Impact of key factors 2025 and 2030

7.3 Bargaining power of suppliers

Bargaining power of suppliers - Impact of key factors in 2025 and 2030

7.4 Threat of new entrants

Threat of new entrants - Impact of key factors in 2025 and 2030

7.5 Threat of substitutes

Threat of substitutes - Impact of key factors in 2025 and 2030

7.6 Threat of rivalry

Threat of rivalry - Impact of key factors in 2025 and 2030

7.7 Market condition

Chart on Market condition - Five forces 2025 and 2030

8. Market Segmentation by Type

8.1 Market segments

Chart on Type - Market share 2025-2030 (%)
Data Table on Type - Market share 2025-2030 (%)

8.2 Comparison by Type

Chart on Comparison by Type
Data Table on Comparison by Type

8.3 Permanent magnet synchronous motor - Market size and forecast 2025-2030

Chart on Permanent magnet synchronous motor - Market size and forecast 2025-2030 ($ million)
Data Table on Permanent magnet synchronous motor - Market size and forecast 2025-2030 ($ million)
Chart on Permanent magnet synchronous motor - Year-over-year growth 2025-2030 (%)
Data Table on Permanent magnet synchronous motor - Year-over-year growth 2025-2030 (%)

8.4 Brushless DC motor - Market size and forecast 2025-2030

Chart on Brushless DC motor - Market size and forecast 2025-2030 ($ million)
Data Table on Brushless DC motor - Market size and forecast 2025-2030 ($ million)
Chart on Brushless DC motor - Year-over-year growth 2025-2030 (%)
Data Table on Brushless DC motor - Year-over-year growth 2025-2030 (%)

8.5 Brushed DC motor - Market size and forecast 2025-2030

Chart on Brushed DC motor - Market size and forecast 2025-2030 ($ million)
Data Table on Brushed DC motor - Market size and forecast 2025-2030 ($ million)
Chart on Brushed DC motor - Year-over-year growth 2025-2030 (%)
Data Table on Brushed DC motor - Year-over-year growth 2025-2030 (%)

8.6 Synchronous reluctance motor (SRM) - Market size and forecast 2025-2030

Chart on Synchronous reluctance motor (SRM) - Market size and forecast 2025-2030 ($ million)
Data Table on Synchronous reluctance motor (SRM) - Market size and forecast 2025-2030 ($ million)
Chart on Synchronous reluctance motor (SRM) - Year-over-year growth 2025-2030 (%)
Data Table on Synchronous reluctance motor (SRM) - Year-over-year growth 2025-2030 (%)

8.7 Market opportunity by Type

Market opportunity by Type ($ million)
Data Table on Market opportunity by Type ($ million)

9. Market Segmentation by End-user

9.1 Market segments

Chart on End-user - Market share 2025-2030 (%)
Data Table on End-user - Market share 2025-2030 (%)

9.2 Comparison by End-user

Chart on Comparison by End-user
Data Table on Comparison by End-user

9.3 Moped and scooters - Market size and forecast 2025-2030

Chart on Moped and scooters - Market size and forecast 2025-2030 ($ million)
Data Table on Moped and scooters - Market size and forecast 2025-2030 ($ million)
Chart on Moped and scooters - Year-over-year growth 2025-2030 (%)
Data Table on Moped and scooters - Year-over-year growth 2025-2030 (%)

9.4 Motorcycle - Market size and forecast 2025-2030

Chart on Motorcycle - Market size and forecast 2025-2030 ($ million)
Data Table on Motorcycle - Market size and forecast 2025-2030 ($ million)
Chart on Motorcycle - Year-over-year growth 2025-2030 (%)
Data Table on Motorcycle - Year-over-year growth 2025-2030 (%)

9.5 Market opportunity by End-user

Market opportunity by End-user ($ million)
Data Table on Market opportunity by End-user ($ million)

10. Market Segmentation by Channel

10.1 Market segments

Chart on Channel - Market share 2025-2030 (%)
Data Table on Channel - Market share 2025-2030 (%)

10.2 Comparison by Channel

Chart on Comparison by Channel
Data Table on Comparison by Channel

10.3 OEM - Market size and forecast 2025-2030

Chart on OEM - Market size and forecast 2025-2030 ($ million)
Data Table on OEM - Market size and forecast 2025-2030 ($ million)
Chart on OEM - Year-over-year growth 2025-2030 (%)
Data Table on OEM - Year-over-year growth 2025-2030 (%)

10.4 Aftermarket - Market size and forecast 2025-2030

Chart on Aftermarket - Market size and forecast 2025-2030 ($ million)
Data Table on Aftermarket - Market size and forecast 2025-2030 ($ million)
Chart on Aftermarket - Year-over-year growth 2025-2030 (%)
Data Table on Aftermarket - Year-over-year growth 2025-2030 (%)

10.5 Market opportunity by Channel

Market opportunity by Channel ($ million)
Data Table on Market opportunity by Channel ($ million)

11. Customer Landscape

11.1 Customer landscape overview

Analysis of price sensitivity, lifecycle, customer purchase basket, adoption rates, and purchase criteria

12. Geographic Landscape

12.1 Geographic segmentation

Chart on Market share by geography 2025-2030 (%)
Data Table on Market share by geography 2025-2030 (%)

12.2 Geographic comparison

Chart on Geographic comparison
Data Table on Geographic comparison

12.3 APAC - Market size and forecast 2025-2030

Chart on APAC - Market size and forecast 2025-2030 ($ million)
Data Table on APAC - Market size and forecast 2025-2030 ($ million)
Chart on APAC - Year-over-year growth 2025-2030 (%)
Data Table on APAC - Year-over-year growth 2025-2030 (%)
Chart on Regional Comparison - APAC
Data Table on Regional Comparison - APAC

12.3.1 China - Market size and forecast 2025-2030

Chart on China - Market size and forecast 2025-2030 ($ million)
Data Table on China - Market size and forecast 2025-2030 ($ million)
Chart on China - Year-over-year growth 2025-2030 (%)
Data Table on China - Year-over-year growth 2025-2030 (%)

12.3.2 India - Market size and forecast 2025-2030

Chart on India - Market size and forecast 2025-2030 ($ million)
Data Table on India - Market size and forecast 2025-2030 ($ million)
Chart on India - Year-over-year growth 2025-2030 (%)
Data Table on India - Year-over-year growth 2025-2030 (%)

12.3.3 Japan - Market size and forecast 2025-2030

Chart on Japan - Market size and forecast 2025-2030 ($ million)
Data Table on Japan - Market size and forecast 2025-2030 ($ million)
Chart on Japan - Year-over-year growth 2025-2030 (%)
Data Table on Japan - Year-over-year growth 2025-2030 (%)

12.3.4 South Korea - Market size and forecast 2025-2030

Chart on South Korea - Market size and forecast 2025-2030 ($ million)
Data Table on South Korea - Market size and forecast 2025-2030 ($ million)
Chart on South Korea - Year-over-year growth 2025-2030 (%)
Data Table on South Korea - Year-over-year growth 2025-2030 (%)

12.3.5 Indonesia - Market size and forecast 2025-2030

Chart on Indonesia - Market size and forecast 2025-2030 ($ million)
Data Table on Indonesia - Market size and forecast 2025-2030 ($ million)
Chart on Indonesia - Year-over-year growth 2025-2030 (%)
Data Table on Indonesia - Year-over-year growth 2025-2030 (%)

12.3.6 Australia - Market size and forecast 2025-2030

Chart on Australia - Market size and forecast 2025-2030 ($ million)
Data Table on Australia - Market size and forecast 2025-2030 ($ million)
Chart on Australia - Year-over-year growth 2025-2030 (%)
Data Table on Australia - Year-over-year growth 2025-2030 (%)

12.4 North America - Market size and forecast 2025-2030

Chart on North America - Market size and forecast 2025-2030 ($ million)
Data Table on North America - Market size and forecast 2025-2030 ($ million)
Chart on North America - Year-over-year growth 2025-2030 (%)
Data Table on North America - Year-over-year growth 2025-2030 (%)
Chart on Regional Comparison - North America
Data Table on Regional Comparison - North America

12.4.1 US - Market size and forecast 2025-2030

Chart on US - Market size and forecast 2025-2030 ($ million)
Data Table on US - Market size and forecast 2025-2030 ($ million)
Chart on US - Year-over-year growth 2025-2030 (%)
Data Table on US - Year-over-year growth 2025-2030 (%)

12.4.2 Canada - Market size and forecast 2025-2030

Chart on Canada - Market size and forecast 2025-2030 ($ million)
Data Table on Canada - Market size and forecast 2025-2030 ($ million)
Chart on Canada - Year-over-year growth 2025-2030 (%)
Data Table on Canada - Year-over-year growth 2025-2030 (%)

12.4.3 Mexico - Market size and forecast 2025-2030

Chart on Mexico - Market size and forecast 2025-2030 ($ million)
Data Table on Mexico - Market size and forecast 2025-2030 ($ million)
Chart on Mexico - Year-over-year growth 2025-2030 (%)
Data Table on Mexico - Year-over-year growth 2025-2030 (%)

12.5 Europe - Market size and forecast 2025-2030

Chart on Europe - Market size and forecast 2025-2030 ($ million)
Data Table on Europe - Market size and forecast 2025-2030 ($ million)
Chart on Europe - Year-over-year growth 2025-2030 (%)
Data Table on Europe - Year-over-year growth 2025-2030 (%)
Chart on Regional Comparison - Europe
Data Table on Regional Comparison - Europe

12.5.1 Germany - Market size and forecast 2025-2030

Chart on Germany - Market size and forecast 2025-2030 ($ million)
Data Table on Germany - Market size and forecast 2025-2030 ($ million)
Chart on Germany - Year-over-year growth 2025-2030 (%)
Data Table on Germany - Year-over-year growth 2025-2030 (%)

12.5.2 UK - Market size and forecast 2025-2030

Chart on UK - Market size and forecast 2025-2030 ($ million)
Data Table on UK - Market size and forecast 2025-2030 ($ million)
Chart on UK - Year-over-year growth 2025-2030 (%)
Data Table on UK - Year-over-year growth 2025-2030 (%)

12.5.3 France - Market size and forecast 2025-2030

Chart on France - Market size and forecast 2025-2030 ($ million)
Data Table on France - Market size and forecast 2025-2030 ($ million)
Chart on France - Year-over-year growth 2025-2030 (%)
Data Table on France - Year-over-year growth 2025-2030 (%)

12.5.4 Italy - Market size and forecast 2025-2030

Chart on Italy - Market size and forecast 2025-2030 ($ million)
Data Table on Italy - Market size and forecast 2025-2030 ($ million)
Chart on Italy - Year-over-year growth 2025-2030 (%)
Data Table on Italy - Year-over-year growth 2025-2030 (%)

12.5.5 Spain - Market size and forecast 2025-2030

Chart on Spain - Market size and forecast 2025-2030 ($ million)
Data Table on Spain - Market size and forecast 2025-2030 ($ million)
Chart on Spain - Year-over-year growth 2025-2030 (%)
Data Table on Spain - Year-over-year growth 2025-2030 (%)

12.5.6 The Netherlands - Market size and forecast 2025-2030

Chart on The Netherlands - Market size and forecast 2025-2030 ($ million)
Data Table on The Netherlands - Market size and forecast 2025-2030 ($ million)
Chart on The Netherlands - Year-over-year growth 2025-2030 (%)
Data Table on The Netherlands - Year-over-year growth 2025-2030 (%)

12.6 Middle East and Africa - Market size and forecast 2025-2030

Chart on Middle East and Africa - Market size and forecast 2025-2030 ($ million)
Data Table on Middle East and Africa - Market size and forecast 2025-2030 ($ million)
Chart on Middle East and Africa - Year-over-year growth 2025-2030 (%)
Data Table on Middle East and Africa - Year-over-year growth 2025-2030 (%)
Chart on Regional Comparison - Middle East and Africa
Data Table on Regional Comparison - Middle East and Africa

12.6.1 Saudi Arabia - Market size and forecast 2025-2030

Chart on Saudi Arabia - Market size and forecast 2025-2030 ($ million)
Data Table on Saudi Arabia - Market size and forecast 2025-2030 ($ million)
Chart on Saudi Arabia - Year-over-year growth 2025-2030 (%)
Data Table on Saudi Arabia - Year-over-year growth 2025-2030 (%)

12.6.2 UAE - Market size and forecast 2025-2030

Chart on UAE - Market size and forecast 2025-2030 ($ million)
Data Table on UAE - Market size and forecast 2025-2030 ($ million)
Chart on UAE - Year-over-year growth 2025-2030 (%)
Data Table on UAE - Year-over-year growth 2025-2030 (%)

12.6.3 Turkey - Market size and forecast 2025-2030

Chart on Turkey - Market size and forecast 2025-2030 ($ million)
Data Table on Turkey - Market size and forecast 2025-2030 ($ million)
Chart on Turkey - Year-over-year growth 2025-2030 (%)
Data Table on Turkey - Year-over-year growth 2025-2030 (%)

12.6.4 South Africa - Market size and forecast 2025-2030

Chart on South Africa - Market size and forecast 2025-2030 ($ million)
Data Table on South Africa - Market size and forecast 2025-2030 ($ million)
Chart on South Africa - Year-over-year growth 2025-2030 (%)
Data Table on South Africa - Year-over-year growth 2025-2030 (%)

12.6.5 Israel - Market size and forecast 2025-2030

Chart on Israel - Market size and forecast 2025-2030 ($ million)
Data Table on Israel - Market size and forecast 2025-2030 ($ million)
Chart on Israel - Year-over-year growth 2025-2030 (%)
Data Table on Israel - Year-over-year growth 2025-2030 (%)

12.7 South America - Market size and forecast 2025-2030

Chart on South America - Market size and forecast 2025-2030 ($ million)
Data Table on South America - Market size and forecast 2025-2030 ($ million)
Chart on South America - Year-over-year growth 2025-2030 (%)
Data Table on South America - Year-over-year growth 2025-2030 (%)
Chart on Regional Comparison - South America
Data Table on Regional Comparison - South America

12.7.1 Brazil - Market size and forecast 2025-2030

Chart on Brazil - Market size and forecast 2025-2030 ($ million)
Data Table on Brazil - Market size and forecast 2025-2030 ($ million)
Chart on Brazil - Year-over-year growth 2025-2030 (%)
Data Table on Brazil - Year-over-year growth 2025-2030 (%)

12.7.2 Argentina - Market size and forecast 2025-2030

Chart on Argentina - Market size and forecast 2025-2030 ($ million)
Data Table on Argentina - Market size and forecast 2025-2030 ($ million)
Chart on Argentina - Year-over-year growth 2025-2030 (%)
Data Table on Argentina - Year-over-year growth 2025-2030 (%)

12.7.3 Chile - Market size and forecast 2025-2030

Chart on Chile - Market size and forecast 2025-2030 ($ million)
Data Table on Chile - Market size and forecast 2025-2030 ($ million)
Chart on Chile - Year-over-year growth 2025-2030 (%)
Data Table on Chile - Year-over-year growth 2025-2030 (%)

12.8 Market opportunity by geography

Market opportunity by geography ($ million)
Data Tables on Market opportunity by geography ($ million)

13. Drivers, Challenges, and Opportunity

13.1 Market drivers

Regulatory pressures and urban emission mandates
Technological advancements and powertrain efficiency
Escalating urbanization and shared mobility

13.2 Market challenges

Severe supply chain component bottlenecks
High upfront purchase cost pressures
Thermal management and durability hurdles

13.3 Impact of drivers and challenges

Impact of drivers and challenges in 2025 and 2030

13.4 Market opportunities

Rising fuel costs spur adoption
Integration of smart connectivity features
Expansion of battery swapping networks

14. Competitive Landscape

14.1 Overview

14.2

Overview on criticality of inputs and factors of differentiation

14.3 Landscape disruption

Overview on factors of disruption

14.4 Industry risks

Impact of key risks on business

15. Competitive Analysis

15.1 Companies profiled

Companies covered

15.2 Company ranking index

15.3 Market positioning of companies

Matrix on companies position and classification

15.4 Ananda Drive Techniques Co. Ltd.

Ananda Drive Techniques Co. Ltd. - Overview
Ananda Drive Techniques Co. Ltd. - Product / Service
Ananda Drive Techniques Co. Ltd. - Key offerings
SWOT

15.5 Bafang Electric Suzhou Co.

Bafang Electric Suzhou Co. - Overview
Bafang Electric Suzhou Co. - Product / Service
Bafang Electric Suzhou Co. - Key offerings
SWOT

15.6 Brose SE and Co. KG

Brose SE and Co. KG - Overview
Brose SE and Co. KG - Product / Service
Brose SE and Co. KG - Key offerings
SWOT

15.7 FAZUA GmbH

FAZUA GmbH - Overview
FAZUA GmbH - Product / Service
FAZUA GmbH - Key offerings
SWOT

15.8 Heinzmann GmbH and Co. KG

Heinzmann GmbH and Co. KG - Overview
Heinzmann GmbH and Co. KG - Product / Service
Heinzmann GmbH and Co. KG - Key offerings
SWOT

15.9 MAHLE GmbH

MAHLE GmbH - Overview
MAHLE GmbH - Product / Service
MAHLE GmbH - Key offerings
SWOT

15.10 Nidec Corp.

Nidec Corp. - Overview
Nidec Corp. - Business segments
Nidec Corp. - Key offerings
Nidec Corp. - Segment focus
SWOT

15.11 Panasonic Holdings Corp.

Panasonic Holdings Corp. - Overview
Panasonic Holdings Corp. - Business segments
Panasonic Holdings Corp. - Key news
Panasonic Holdings Corp. - Key offerings
Panasonic Holdings Corp. - Segment focus
SWOT

15.12 Robert Bosch GmbH

Robert Bosch GmbH - Overview
Robert Bosch GmbH - Product / Service
Robert Bosch GmbH - Key offerings
SWOT

15.13 Schaeffler AG

Schaeffler AG - Overview
Schaeffler AG - Business segments
Schaeffler AG - Key news
Schaeffler AG - Key offerings
Schaeffler AG - Segment focus
SWOT

15.14 SONA BLW Precision Forgings Ltd.

SONA BLW Precision Forgings Ltd. - Overview
SONA BLW Precision Forgings Ltd. - Business segments
SONA BLW Precision Forgings Ltd. - Key offerings
SONA BLW Precision Forgings Ltd. - Segment focus
SWOT

15.15 TDCM Corp. Ltd.

TDCM Corp. Ltd. - Overview
TDCM Corp. Ltd. - Product / Service
TDCM Corp. Ltd. - Key offerings
SWOT

15.16 Valeo SA

Valeo SA - Overview
Valeo SA - Business segments
Valeo SA - Key offerings
Valeo SA - Segment focus
SWOT

15.17 Yamaha Motor Co. Ltd.

Yamaha Motor Co. Ltd. - Overview
Yamaha Motor Co. Ltd. - Business segments
Yamaha Motor Co. Ltd. - Key offerings
Yamaha Motor Co. Ltd. - Segment focus
SWOT

15.18 ZF Friedrichshafen AG

ZF Friedrichshafen AG - Overview
ZF Friedrichshafen AG - Product / Service
ZF Friedrichshafen AG - Key offerings
SWOT

16. Appendix

16.1 Scope of the report

Market definition
Objectives
Notes and caveats

16.2 Inclusions and exclusions checklist

Inclusions checklist
Exclusions checklist

16.3 Currency conversion rates for US$

16.4 Research methodology

16.5 Data procurement

Information sources

16.6 Data validation

16.7 Validation techniques employed for market sizing

16.8 Data synthesis

16.9 360 degree market analysis

16.10 List of abbreviations

Research Methodology

Technavio presents a detailed picture of the market by way of study, synthesis, and summation of data from multiple sources. The analysts have presented the various facets of the market with a particular focus on identifying the key industry influencers. The data thus presented is comprehensive, reliable, and the result of extensive research, both primary and secondary.

INFORMATION SOURCES

Primary sources

  • Manufacturers and suppliers
  • Channel partners
  • Industry experts
  • Strategic decision makers

Secondary sources

  • Industry journals and periodicals
  • Government data
  • Financial reports of key industry players
  • Historical data
  • Press releases

DATA ANALYSIS

Data Synthesis

  • Collation of data
  • Estimation of key figures
  • Analysis of derived insights

Data Validation

  • Triangulation with data models
  • Reference against proprietary databases
  • Corroboration with industry experts

REPORT WRITING

Qualitative

  • Market drivers
  • Market challenges
  • Market trends
  • Five forces analysis

Quantitative

  • Market size and forecast
  • Market segmentation
  • Geographical insights
  • Competitive landscape

Interested in this report?

Get your sample now to see our research methodology and insights!

Download Now

Frequently Asked Questions

Electric Two-Wheeler Motor market growth will increase by USD 8155.4 million during 2026-2030.

The Electric Two-Wheeler Motor market is expected to grow at a CAGR of 11.3% during 2026-2030.

Electric Two-Wheeler Motor market is segmented by Type (Permanent magnet synchronous motor, Brushless DC motor, Brushed DC motor, Synchronous reluctance motor (SRM)) End-user (Moped and scooters, Motorcycle) Channel (OEM, Aftermarket)

Ananda Drive Techniques Co. Ltd., Bafang Electric Suzhou Co., Brose SE and Co. KG, Dapu Motors Co. Ltd., DJI Technology Co. Ltd., FAZUA GmbH, Heinzmann GmbH and Co. KG, MAHLE GmbH, Nidec Corp., Panasonic Holdings Corp., Pendix GmbH, QS MOTORS Ltd., Robert Bosch GmbH, Schaeffler AG, Shimano Inc., SONA BLW Precision Forgings Ltd., SRAM LLC, TDCM Corp. Ltd., TQ Systems GmbH, Valeo SA, Yamaha Motor Co. Ltd., ZF Friedrichshafen AG are a few of the key vendors in the Electric Two-Wheeler Motor market.

APAC will register the highest growth rate of 52.2% among the other regions. Therefore, the Electric Two-Wheeler Motor market in APAC is expected to garner significant business opportunities for the vendors during the forecast period.

China, India, Japan, South Korea, Indonesia, Australia, US, Canada, Mexico, Germany, UK, France, Italy, Spain, The Netherlands, Saudi Arabia, UAE, Turkey, South Africa, Israel, Brazil, Argentina, Chile

  • Regulatory pressures and urban emission mandates is the driving factor this market.

The Electric Two-Wheeler Motor market vendors should focus on grabbing business opportunities from the Type segment as it accounted for the largest market share in the base year.
RIA - Research AI Assistant
Ask RIA
