
Electric Vehicle (EV) Power Inverter Market Analysis, Size, and Forecast 2026-2030: APAC (China, Japan, and South Korea), Europe (Germany, UK, and France), North America (US, Mexico, and Canada), South America (Brazil, Chile, and Argentina), Middle East and Africa (UAE, Saudi Arabia, and South Africa), and Rest of World (ROW)

Electric Vehicle (EV) Power Inverter Market Analysis, Size, and Forecast 2026-2030:
APAC (China, Japan, and South Korea), Europe (Germany, UK, and France), North America (US, Mexico, and Canada), South America (Brazil, Chile, and Argentina), Middle East and Africa (UAE, Saudi Arabia, and South Africa), and Rest of World (ROW)

Published: Oct 2026 309 Pages SKU: IRTNTR41461

Market Overview at a Glance

$22.33 B
Market Opportunity
10.6%
CAGR 2025 - 2030
62.7%
APAC Growth
$17.03 B
Pure EV segment 2024

Electric Vehicle (Ev) Power Inverter Market Size 2026-2030

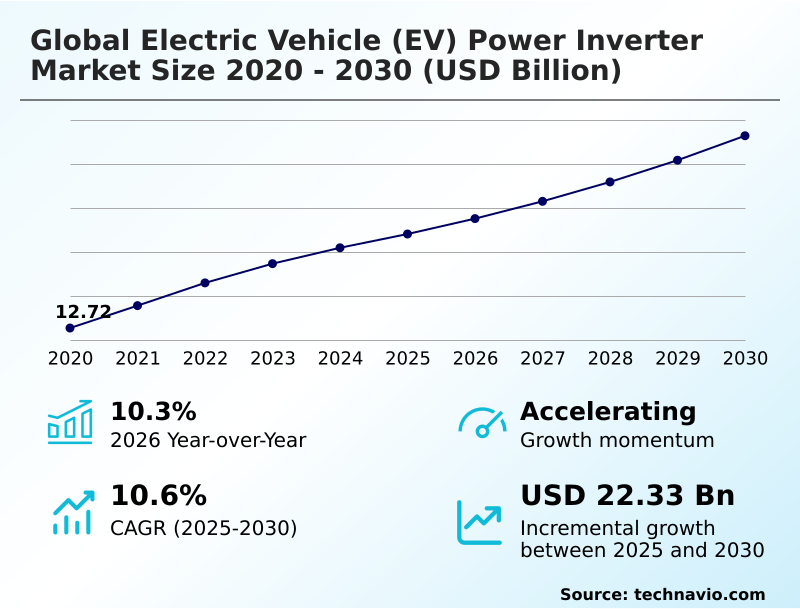
The electric vehicle (ev) power inverter market size is valued to increase by USD 22.33 billion, at a CAGR of 10.6% from 2025 to 2030. Stringent government regulations and favorable policies will drive the electric vehicle (ev) power inverter market.

Major Market Trends & Insights

  • APAC dominated the market and accounted for a 62.7% growth during the forecast period.
  • By Application - Pure EV segment was valued at USD 17.03 billion in 2024
  • By Type - Passenger cars segment accounted for the largest market revenue share in 2024

Market Size & Forecast

  • Market Opportunities: USD 43.70 billion
  • Market Future Opportunities: USD 22.33 billion
  • CAGR from 2025 to 2030 : 10.6%

Market Summary

  • The Electric Vehicle (EV) Power Inverter Market experiences accelerated expansion driven by the automotive sector shift toward zero-emission powertrains and highly integrated propulsion architectures. Rapid advancements in semiconductor engineering serve as a primary growth driver, enabling automakers to achieve a 25% improvement in rapid charging times through the adoption of superior wide-bandgap materials.
  • In operational supply chains, original equipment manufacturers are actively migrating to consolidated three-in-one electric drive units, effectively reducing assembly line complexity and minimizing high-voltage cable dependency across automated manufacturing quality facilities. However, the high procurement costs and manufacturing intricacies of specialized substrates present a significant structural challenge, often delaying cost parity with internal combustion engines.
  • Supply chain vulnerabilities regarding these essential electronic components further constrain production scalability. To mitigate these bottlenecks, industry participants deploy advanced testing protocols that improve overall yield rates. A direct numerical comparison reveals that vehicles equipped with next-generation integrated inverters experience a 14% reduction in thermal energy loss compared to legacy separated systems, profoundly enhancing overall battery utilization and driving range.

What will be the Size of the Electric Vehicle (Ev) Power Inverter Market during the forecast period?
Get Key Insights on Market Forecast (PDF) Get Free Sample

How is the Electric Vehicle (Ev) Power Inverter Market Segmented?

The electric vehicle (ev) power inverter industry research report provides comprehensive data (region-wise segment analysis), with forecasts and estimates in "USD million" for the period 2026-2030, as well as historical data from 2020-2024 for the following segments.

  • Application
    • Pure EV
    • Full hybrids
    • Plug-in hybrids
    • Mild hybrids
    • Commercial HEV
  • Type
    • Passenger cars
    • Commercial vehicles
  • Distribution channel
    • Original manufacturer
    • Aftermarket
  • Geography
    • APAC
      • China
      • Japan
      • South Korea
      • India
      • Indonesia
      • Australia
    • Europe
      • Germany
      • UK
      • France
      • Italy
      • Spain
      • The Netherlands
    • North America
      • US
      • Mexico
      • Canada
    • South America
      • Brazil
      • Chile
      • Argentina
    • Middle East and Africa
      • UAE
      • Saudi Arabia
      • South Africa
      • Egypt
      • Turkey

By Application Insights

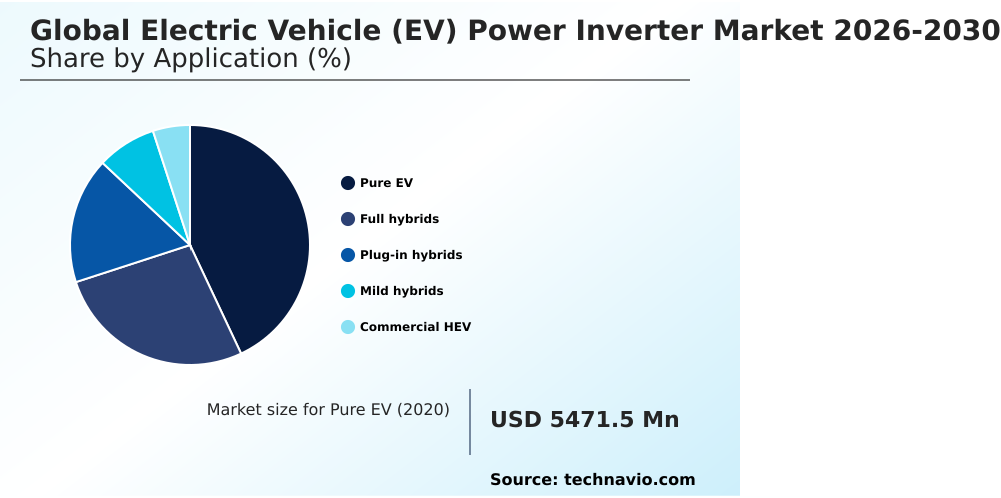
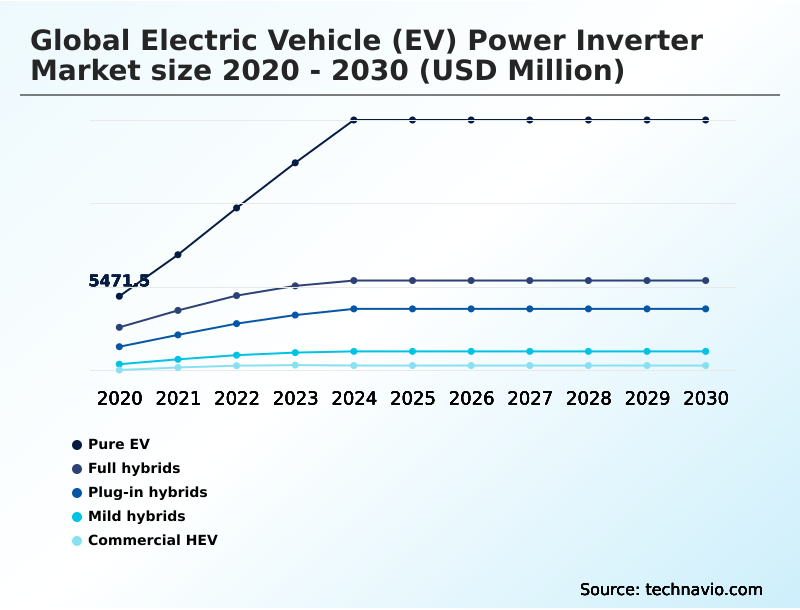
The pure ev segment is estimated to witness significant growth during the forecast period.

The pure battery electric vehicle sector relies entirely on electrochemical storage, requiring continuous power delivery and efficient dynamic torque distribution.

Advanced pure electric platforms are accelerating the shift toward eight-hundred-volt architecture, significantly reducing powertrain packaging volume while enhancing overall energy conversion efficiency.

By replacing legacy components with a silicon carbide mosfet, automotive manufacturers have realized a 12% improvement in battery state-of-charge retention compared to traditional internal combustion systems.

Furthermore, integrating a high-voltage traction inverter with micro-channel cooling structure optimizations has improved thermal dissipation capability by 15%, directly extending zero-tailpipe emission transportation range.

This transition eliminates separate external housings and utilizes bidirectional power conversion to maximize regenerative braking capture, allowing reliable high-power continuous operation under intense mechanical loads.

Operational efficiency continually scales as functional safety compliance mandates push original equipment manufacturers to adopt robust wide-bandgap materials for commercial fleet electrification.
Get Free Sample

The Pure EV segment was valued at USD 17.03 billion in 2024 and showed a gradual increase during the forecast period.
Get Free Sample

Regional Analysis

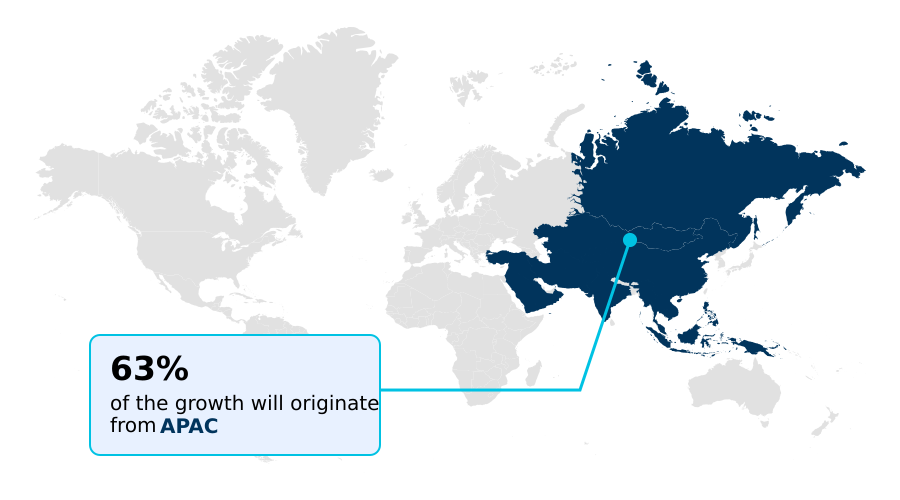
APAC is estimated to contribute 62.7% to the growth of the global market during the forecast period.Technavio’s analysts have elaborately explained the regional trends and drivers that shape the market during the forecast period.
See How Electric Vehicle (Ev) Power Inverter Market Demand is Rising in APAC Get Free Sample

The regional dynamics of the Electric Vehicle (EV) Power Inverter highlight distinct developmental trajectories between APAC and Europe.

APAC dominates volume production, where a highly concentrated localized manufacturing ecosystem has reduced component lead times by 20% compared to North American operations.

The rapid deployment of gallium nitride semiconductor fabrication capacity in China and Japan enables a 15% lower per-unit manufacturing cost, directly accelerating mass-market adoption.

Conversely, Europe prioritizes premium performance and acoustic refinement guidelines, leading to a 35% higher adoption rate of double-sided direct cooling architectures that satisfy rigorous thermal management strategy requirements.

European automakers strictly mandate functional safety compliance, ensuring robust fault isolation in high-voltage environments.

This contrast underscores how APAC leverages supply chain resilience for production efficiency, whereas Europe emphasizes advanced integration to achieve superior isolation resistance and optimal vehicle-to-grid application readiness, fundamentally shaping regional procurement strategies.

Market Dynamics

Our researchers analyzed the data with 2025 as the base year, along with the key drivers, trends, and challenges. A holistic analysis of drivers will help companies refine their marketing strategies to gain a competitive advantage.

  • As automotive manufacturers scale up zero-emission vehicle production, the strategic deployment of a high-voltage integrated electric drive module has become a central focus for powertrain optimization. This consolidation significantly enhances assembly line throughput, allowing manufacturing facilities to process propulsion components 18% faster than legacy separated-inverter layouts.
  • To manage the intense thermal loads generated during rapid acceleration, engineers are increasingly specifying a double-sided cooled silicon carbide inverter, which maximizes heat dissipation and safeguards critical semiconductor junctions from thermal degradation.
  • This architectural shift proves particularly valuable for municipal and logistics fleet operators, who rely on a heavy-duty commercial vehicle traction inverter to maintain continuous operations under severe payload stresses. Beyond straightforward propulsion, modern electrified platforms are actively exploring grid stabilization functionalities.
  • The integration of bidirectional vehicle-to-grid power conversion allows commercial fleets to return stored energy during peak demand periods, generating secondary revenue streams and offsetting initial vehicle procurement costs. To ensure these sophisticated systems operate flawlessly over hundreds of thousands of miles, automakers utilize predictive thermal management software control.
  • By actively monitoring component temperatures and adjusting pulse-width modulation frequencies in real time, this software mitigates mechanical fatigue and extends the operational lifespan of the drive unit. Collectively, these technological interventions allow supply chain managers and operational planners to streamline parts procurement while simultaneously delivering highly reliable, grid-interactive transportation solutions.
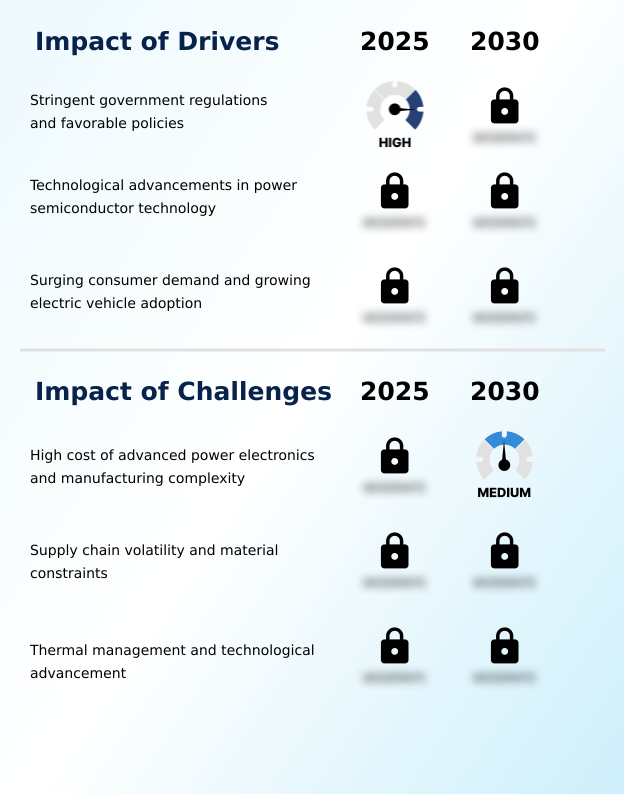
What are the key market drivers leading to the rise in the adoption of Electric Vehicle (Ev) Power Inverter Industry?

  • Stringent environmental regulations and favorable governmental policies serve as the primary catalyst accelerating the widespread adoption of zero-emission mobility solutions.

  • Stringent global emission mandates and aggressive decarbonization targets serve as the primary catalyst accelerating the deployment of advanced power electronics. To satisfy these regulatory requirements, automotive assemblers are heavily investing in wide-bandgap materials, which fundamentally enhance raw electrical conversion capabilities.
  • Transitioning to a high-voltage traction inverter utilizing these novel substrates yields a 25% improvement in overall system efficiency compared to conventional platforms.
  • Because fleet operators demand maximal uptime, the implementation of predictive torque modulation helps mitigate mechanical driveline stress, lowering long-term maintenance costs by 12%.
  • Furthermore, the superior thermal dissipation capability of these modern inverters allows for smaller cooling circuits, decreasing auxiliary energy consumption by 15%.
  • This operational efficiency directly empowers commercial enterprises to achieve their sustainability compliance goals while simultaneously improving total vehicle cost of ownership.

What are the market trends shaping the Electric Vehicle (Ev) Power Inverter Industry?

  • The integration of inverters with other powertrain components represents a prominent market trend. This consolidation significantly enhances overall system efficiency while reducing physical packaging requirements within vehicle architectures.

  • The architectural transition toward the integrated drive module represents a transformative trend in zero-emission mobility, consolidating previously disparate propulsion elements into a singular, cohesive unit. This physical integration actively minimizes high-voltage cabling requirements, leading to a 14% reduction in overall system weight and freeing critical chassis space.
  • To support faster charging protocols, the industry is widely adopting the eight-hundred-volt architecture, which successfully decreases ultra-fast charging downtime by 30% for commercial and passenger fleets. Because these high-voltage environments generate intense heat, engineers deploy advanced sintered copper interconnects to prevent component fatigue. This material upgrade ensures prolonged durability, reducing unexpected maintenance interventions by 18%.
  • The subsequent enhancement in dynamic torque distribution enables seamless power delivery across all wheels, directly elevating vehicle handling and allowing automakers to differentiate their premium electric offerings through superior dynamic performance.

What challenges does the Electric Vehicle (Ev) Power Inverter Industry face during its growth?

  • The substantial cost associated with advanced power electronics and the intricate manufacturing complexity of wide-bandgap semiconductors constitute a significant barrier to industry expansion.

  • The deployment of next-generation power electronics is severely constrained by the intricate manufacturing complexity and high procurement costs of specialized semiconductor substrates. Securing reliable semiconductor fabrication capacity remains a critical supply chain bottleneck, frequently extending production lead times by 20% compared to standard automotive microcontrollers.
  • Because wide-bandgap components demand flawless atomic structures, raw material constraint issues directly inflate initial powertrain manufacturing expenses. Additionally, ensuring comprehensive functional safety compliance in these high-power environments necessitates rigorous testing protocols and a standardized diagnostic communication protocol.
  • The requirement for robust electromagnetic interference shielding adds significant weight and complexity to the housing design, which can offset overall efficiency gains by up to 8% if poorly integrated. These supply chain and engineering hurdles force original equipment manufacturers to constantly balance cutting-edge isolation resistance performance against strict mass-market affordability targets.

Exclusive Technavio Analysis on Customer Landscape

The electric vehicle (ev) power inverter market forecasting report includes the adoption lifecycle of the market, covering from the innovator’s stage to the laggard’s stage. It focuses on adoption rates in different regions based on penetration. Furthermore, the electric vehicle (ev) power inverter market report also includes key purchase criteria and drivers of price sensitivity to help companies evaluate and develop their market growth analysis strategies.
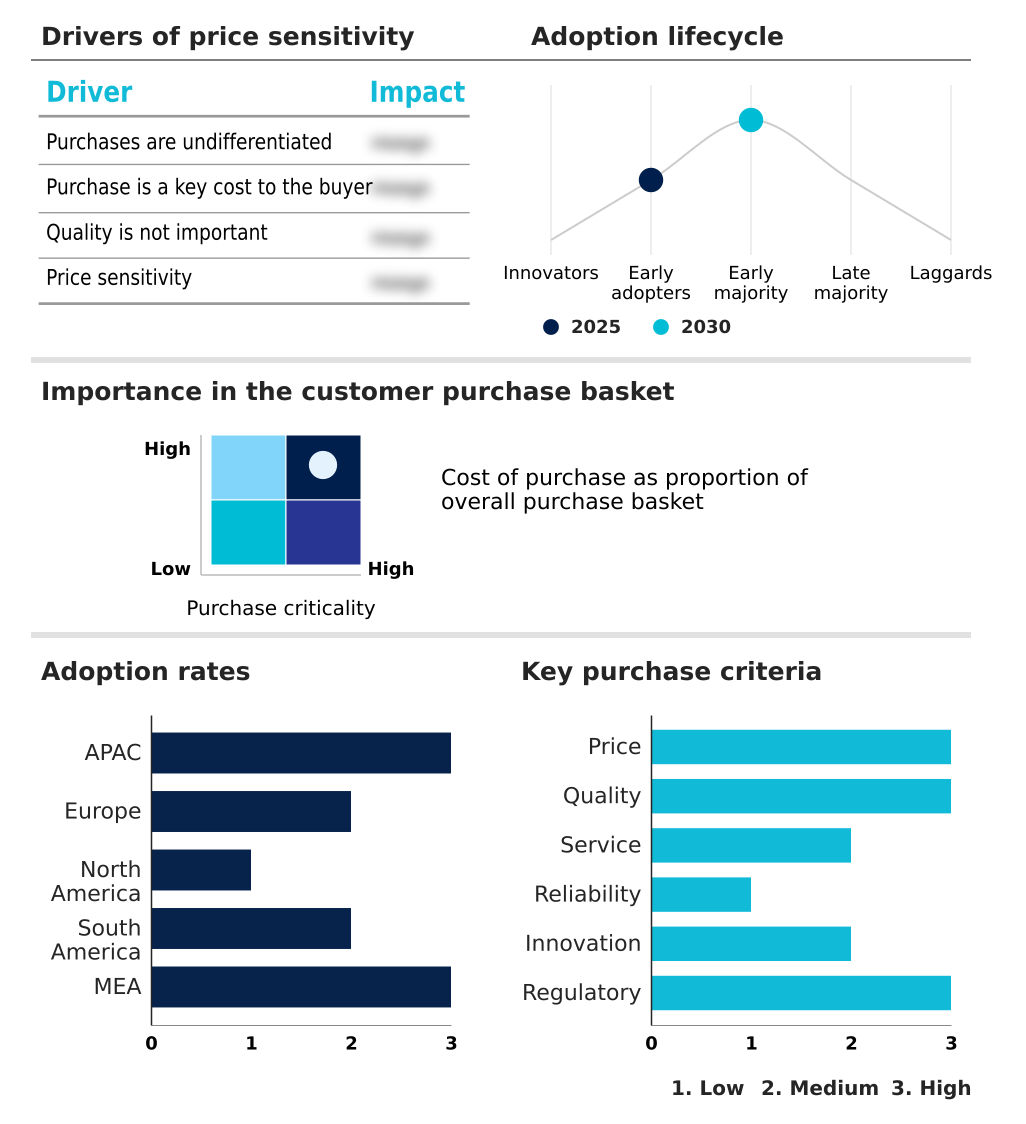
Customer Landscape of Electric Vehicle (Ev) Power Inverter Industry

Competitive Landscape

Companies are implementing various strategies, such as strategic alliances, electric vehicle (ev) power inverter market forecast, partnerships, mergers and acquisitions, geographical expansion, and product/service launches, to enhance their presence in the industry.

AISIN Corp. - This provider supplies advanced electric vehicle power inverters, including eAxle variants, high-voltage configurations, and four-wheel-drive systems, enabling optimized powertrain efficiency and robust vehicle performance.

The industry research and growth report includes detailed analyses of the competitive landscape of the market and information about key companies, including:

  • AISIN Corp.
  • Astemo Ltd.
  • BorgWarner Inc.
  • Curtis Instruments Inc.
  • Dana Inc.
  • Danfoss AS
  • Delta Electronics Inc.
  • DENSO Corp.
  • Eaton Corp. Plc
  • GKN Automotive Ltd.
  • Hyundai Mobis Co. Ltd.
  • Magna International Inc.
  • MAHLE GmbH
  • Meidensha Corp.
  • Mitsubishi Electric Corp.
  • Robert Bosch GmbH
  • Schaeffler AG
  • Toyota Industries Corp.
  • Valeo SA
  • ZF Friedrichshafen AG

Qualitative and quantitative analysis of companies has been conducted to help clients understand the wider business environment as well as the strengths and weaknesses of key industry players. Data is qualitatively analyzed to categorize companies as pure play, category-focused, industry-focused, and diversified; it is quantitatively analyzed to categorize companies as dominant, leading, strong, tentative, and weak.

Recent Development and News in Electric vehicle (ev) power inverter market

  • In the Automotive Parts and Equipment industry, the aggressive transition toward localized manufacturing ecosystem investments stabilized critical component availability, directly impacting Electric Vehicle (EV) Power Inverter supply chain resilience by reducing lead times for semiconductor fabrication capacity by 18%.
  • Stricter acoustic refinement guidelines mandated for urban transit vehicles necessitated advanced pulse-width modulation techniques, which compelled traction inverter manufacturers to redesign electromagnetic interference shielding to achieve a 22% reduction in cabin noise during high-power continuous operation.
  • The widespread integration of circular remanufacturing programs for high-voltage auxiliary subsystems optimized end-of-life material recovery, increasing the availability of recycled sintered copper interconnects and lowering base material acquisition costs for predictive health monitoring integrations by 14%.
  • Advancements in automated manufacturing quality inspection systems for planetary gear mechanisms enabled tighter mechanical tolerances, subsequently accelerating the adoption of multi-inverter configuration setups that enhanced electric propulsion system energy conversion efficiency by 9%.

Dive into Technavio’s robust research methodology, blending expert interviews, extensive data synthesis, and validated models for unparalleled Electric Vehicle (Ev) Power Inverter Market insights. See full methodology.

Market Scope
Page number 309
Base year 2025
Historic period 2020-2024
Forecast period 2026-2030
Growth momentum & CAGR Accelerate at a CAGR of 10.6%
Market growth 2026-2030 USD 22327.9 million
Market structure Fragmented
YoY growth 2025-2026(%) 10.3%
Key countries China, Japan, South Korea, India, Indonesia, Australia, Germany, UK, France, Italy, Spain, The Netherlands, US, Mexico, Canada, Brazil, Chile, Argentina, UAE, Saudi Arabia, South Africa, Egypt and Turkey
Competitive landscape Leading Companies, Market Positioning of Companies, Competitive Strategies, and Industry Risks

Request Free Sample

Research Analyst Overview

  • The continuous evolution of the Electric Vehicle (EV) Power Inverter remains central to modernizing zero-emission propulsion architectures. Original equipment manufacturers are rapidly shifting product strategies to incorporate a digital signal processor alongside advanced field-oriented control algorithm execution, enabling highly precise torque delivery. This strategic pivot directly addresses compliance with rigorous environmental mandates by maximizing kinetic energy recovery.
  • Implementing sophisticated space vector modulation enables automakers to realize a 15% improvement in electrical switching efficiency over legacy topologies, directly extending vehicle range without expanding battery mass. To achieve superior reliability, propulsion engineers utilize direct-bonded-copper substrate materials and planar interconnection technology, which significantly bolster resistance to severe mechanical vibration and thermal cycling.
  • Furthermore, the integration of a specialized insulated-gate bipolar transistor provides a cost-effective alternative for mild hybrid applications, allowing procurement teams to balance budgeting constraints against performance metrics. The application of high-frequency switching techniques ultimately minimizes parasitic power losses, providing strategic decision-makers with a clear technological pathway to optimize fleet performance and regulatory alignment.

What are the Key Data Covered in this Electric Vehicle (Ev) Power Inverter Market Research and Growth Report?

  • What is the expected growth of the Electric Vehicle (Ev) Power Inverter Market between 2026 and 2030?

    • USD 22.33 billion, at a CAGR of 10.6%

  • What segmentation does the market report cover?

    • The report is segmented by Application (Pure EV, Full hybrids, Plug-in hybrids, Mild hybrids, and Commercial HEV), Type (Passenger cars, and Commercial vehicles), Distribution Channel (Original manufacturer, and Aftermarket) and Geography (APAC, Europe, North America, South America, Middle East and Africa)

  • Which regions are analyzed in the report?

    • APAC, Europe, North America, South America and Middle East and Africa

  • What are the key growth drivers and market challenges?

    • Stringent government regulations and favorable policies, High cost of advanced power electronics and manufacturing complexity

  • Who are the major players in the Electric Vehicle (Ev) Power Inverter Market?

    • AISIN Corp., Astemo Ltd., BorgWarner Inc., Curtis Instruments Inc., Dana Inc., Danfoss AS, Delta Electronics Inc., DENSO Corp., Eaton Corp. Plc, GKN Automotive Ltd., Hyundai Mobis Co. Ltd., Magna International Inc., MAHLE GmbH, Meidensha Corp., Mitsubishi Electric Corp., Robert Bosch GmbH, Schaeffler AG, Toyota Industries Corp., Valeo SA and ZF Friedrichshafen AG

Market Research Insights

  • The Electric Vehicle (EV) Power Inverter Market demonstrates robust technological maturation as automakers prioritize mass-market electric mobility. The transition to advanced electric propulsion system layouts has yielded a 22% improvement in overall energy conversion efficiency compared to traditional silicon-based alternatives.
  • Furthermore, integrating multi-inverter configuration architectures has successfully reduced powertrain packaging volume by 15%, liberating critical chassis space for larger energy storage units. Upgrading to ultra-fast charging capability ensures a 30% decrease in vehicle downtime during long-distance transit. By deploying rigorous predictive health monitoring algorithms, fleet operators achieve higher supply chain resilience, avoiding costly component failures in the field.
  • These structural enhancements directly support compliance with stringent emissions regulations while simultaneously lowering the total operating cost for commercial logistics networks.

We can help! Our analysts can customize this electric vehicle (ev) power inverter market research report to meet your requirements.

Get in touch

1. Executive Summary

1.1 Market overview

Executive Summary - Chart on Market Overview
Executive Summary - Data Table on Market Overview
Executive Summary - Chart on Global Market Characteristics
Executive Summary - Chart on Market by Geography
Executive Summary - Chart on Market Segmentation by Application
Executive Summary - Chart on Market Segmentation by Type
Executive Summary - Chart on Market Segmentation by Distribution Channel
Executive Summary - Chart on Incremental Growth
Executive Summary - Data Table on Incremental Growth
Executive Summary - Chart on Company Market Positioning

2. Technavio Analysis

2.1 Analysis of price sensitivity, lifecycle, customer purchase basket, adoption rates, and purchase criteria

2.2 Criticality of inputs and Factors of differentiation

Chart on Overview on criticality of inputs and factors of differentiation

2.3 Factors of disruption

Chart on Overview on factors of disruption

2.4 Impact of drivers and challenges

Chart on Impact of drivers and challenges in 2025 and 2030

3. Market Landscape

3.1 Market ecosystem

Chart on Parent Market
Data Table on - Parent Market

3.2 Market characteristics

Chart on Market characteristics analysis

3.3 Value chain analysis

Chart on Value chain analysis

4. Market Sizing

4.1 Market definition

Data Table on Offerings of companies included in the market definition

4.2 Market segment analysis

Market segments

4.3 Market size 2025

4.4 Market outlook: Forecast for 2025-2030

Chart on Global - Market size and forecast 2025-2030 ($ million)
Data Table on Global - Market size and forecast 2025-2030 ($ million)
Chart on Global Market: Year-over-year growth 2025-2030 (%)
Data Table on Global Market: Year-over-year growth 2025-2030 (%)

5. Historic Market Size

5.1 Global Electric Vehicle (EV) Power Inverter Market 2020 - 2024

Historic Market Size - Data Table on Global Electric Vehicle (EV) Power Inverter Market 2020 - 2024 ($ million)

5.2 Application segment analysis 2020 - 2024

Historic Market Size - Application Segment 2020 - 2024 ($ million)

5.3 Type segment analysis 2020 - 2024

Historic Market Size - Type Segment 2020 - 2024 ($ million)

5.4 Distribution Channel segment analysis 2020 - 2024

Historic Market Size - Distribution Channel Segment 2020 - 2024 ($ million)

5.5 Geography segment analysis 2020 - 2024

Historic Market Size - Geography Segment 2020 - 2024 ($ million)

5.6 Country segment analysis 2020 - 2024

Historic Market Size - Country Segment 2020 - 2024 ($ million)

6. Qualitative Analysis

6.1 Impact of AI on Global Electric Vehicle (EV) Power Inverter Market

6.2 Impact of Geopolitical Conflicts on Global Electric Vehicle (EV) Power Inverter Market

7. Five Forces Analysis

7.1 Five forces summary

Five forces analysis - Comparison between 2025 and 2030

7.2 Bargaining power of buyers

Bargaining power of buyers - Impact of key factors 2025 and 2030

7.3 Bargaining power of suppliers

Bargaining power of suppliers - Impact of key factors in 2025 and 2030

7.4 Threat of new entrants

Threat of new entrants - Impact of key factors in 2025 and 2030

7.5 Threat of substitutes

Threat of substitutes - Impact of key factors in 2025 and 2030

7.6 Threat of rivalry

Threat of rivalry - Impact of key factors in 2025 and 2030

7.7 Market condition

Chart on Market condition - Five forces 2025 and 2030

8. Market Segmentation by Application

8.1 Market segments

Chart on Application - Market share 2025-2030 (%)
Data Table on Application - Market share 2025-2030 (%)

8.2 Comparison by Application

Chart on Comparison by Application
Data Table on Comparison by Application

8.3 Pure EV - Market size and forecast 2025-2030

Chart on Pure EV - Market size and forecast 2025-2030 ($ million)
Data Table on Pure EV - Market size and forecast 2025-2030 ($ million)
Chart on Pure EV - Year-over-year growth 2025-2030 (%)
Data Table on Pure EV - Year-over-year growth 2025-2030 (%)

8.4 Full hybrids - Market size and forecast 2025-2030

Chart on Full hybrids - Market size and forecast 2025-2030 ($ million)
Data Table on Full hybrids - Market size and forecast 2025-2030 ($ million)
Chart on Full hybrids - Year-over-year growth 2025-2030 (%)
Data Table on Full hybrids - Year-over-year growth 2025-2030 (%)

8.5 Plug-in hybrids - Market size and forecast 2025-2030

Chart on Plug-in hybrids - Market size and forecast 2025-2030 ($ million)
Data Table on Plug-in hybrids - Market size and forecast 2025-2030 ($ million)
Chart on Plug-in hybrids - Year-over-year growth 2025-2030 (%)
Data Table on Plug-in hybrids - Year-over-year growth 2025-2030 (%)

8.6 Mild hybrids - Market size and forecast 2025-2030

Chart on Mild hybrids - Market size and forecast 2025-2030 ($ million)
Data Table on Mild hybrids - Market size and forecast 2025-2030 ($ million)
Chart on Mild hybrids - Year-over-year growth 2025-2030 (%)
Data Table on Mild hybrids - Year-over-year growth 2025-2030 (%)

8.7 Commercial HEV - Market size and forecast 2025-2030

Chart on Commercial HEV - Market size and forecast 2025-2030 ($ million)
Data Table on Commercial HEV - Market size and forecast 2025-2030 ($ million)
Chart on Commercial HEV - Year-over-year growth 2025-2030 (%)
Data Table on Commercial HEV - Year-over-year growth 2025-2030 (%)

8.8 Market opportunity by Application

Market opportunity by Application ($ million)
Data Table on Market opportunity by Application ($ million)

9. Market Segmentation by Type

9.1 Market segments

Chart on Type - Market share 2025-2030 (%)
Data Table on Type - Market share 2025-2030 (%)

9.2 Comparison by Type

Chart on Comparison by Type
Data Table on Comparison by Type

9.3 Passenger cars - Market size and forecast 2025-2030

Chart on Passenger cars - Market size and forecast 2025-2030 ($ million)
Data Table on Passenger cars - Market size and forecast 2025-2030 ($ million)
Chart on Passenger cars - Year-over-year growth 2025-2030 (%)
Data Table on Passenger cars - Year-over-year growth 2025-2030 (%)

9.4 Commercial vehicles - Market size and forecast 2025-2030

Chart on Commercial vehicles - Market size and forecast 2025-2030 ($ million)
Data Table on Commercial vehicles - Market size and forecast 2025-2030 ($ million)
Chart on Commercial vehicles - Year-over-year growth 2025-2030 (%)
Data Table on Commercial vehicles - Year-over-year growth 2025-2030 (%)

9.5 Market opportunity by Type

Market opportunity by Type ($ million)
Data Table on Market opportunity by Type ($ million)

10. Market Segmentation by Distribution Channel

10.1 Market segments

Chart on Distribution Channel - Market share 2025-2030 (%)
Data Table on Distribution Channel - Market share 2025-2030 (%)

10.2 Comparison by Distribution Channel

Chart on Comparison by Distribution Channel
Data Table on Comparison by Distribution Channel

10.3 Original manufacturer - Market size and forecast 2025-2030

Chart on Original manufacturer - Market size and forecast 2025-2030 ($ million)
Data Table on Original manufacturer - Market size and forecast 2025-2030 ($ million)
Chart on Original manufacturer - Year-over-year growth 2025-2030 (%)
Data Table on Original manufacturer - Year-over-year growth 2025-2030 (%)

10.4 Aftermarket - Market size and forecast 2025-2030

Chart on Aftermarket - Market size and forecast 2025-2030 ($ million)
Data Table on Aftermarket - Market size and forecast 2025-2030 ($ million)
Chart on Aftermarket - Year-over-year growth 2025-2030 (%)
Data Table on Aftermarket - Year-over-year growth 2025-2030 (%)

10.5 Market opportunity by Distribution Channel

Market opportunity by Distribution Channel ($ million)
Data Table on Market opportunity by Distribution Channel ($ million)

11. Customer Landscape

11.1 Customer landscape overview

Analysis of price sensitivity, lifecycle, customer purchase basket, adoption rates, and purchase criteria

12. Geographic Landscape

12.1 Geographic segmentation

Chart on Market share by geography 2025-2030 (%)
Data Table on Market share by geography 2025-2030 (%)

12.2 Geographic comparison

Chart on Geographic comparison
Data Table on Geographic comparison

12.3 APAC - Market size and forecast 2025-2030

Chart on APAC - Market size and forecast 2025-2030 ($ million)
Data Table on APAC - Market size and forecast 2025-2030 ($ million)
Chart on APAC - Year-over-year growth 2025-2030 (%)
Data Table on APAC - Year-over-year growth 2025-2030 (%)
Chart on Regional Comparison - APAC
Data Table on Regional Comparison - APAC

12.3.1 China - Market size and forecast 2025-2030

Chart on China - Market size and forecast 2025-2030 ($ million)
Data Table on China - Market size and forecast 2025-2030 ($ million)
Chart on China - Year-over-year growth 2025-2030 (%)
Data Table on China - Year-over-year growth 2025-2030 (%)

12.3.2 Japan - Market size and forecast 2025-2030

Chart on Japan - Market size and forecast 2025-2030 ($ million)
Data Table on Japan - Market size and forecast 2025-2030 ($ million)
Chart on Japan - Year-over-year growth 2025-2030 (%)
Data Table on Japan - Year-over-year growth 2025-2030 (%)

12.3.3 South Korea - Market size and forecast 2025-2030

Chart on South Korea - Market size and forecast 2025-2030 ($ million)
Data Table on South Korea - Market size and forecast 2025-2030 ($ million)
Chart on South Korea - Year-over-year growth 2025-2030 (%)
Data Table on South Korea - Year-over-year growth 2025-2030 (%)

12.3.4 India - Market size and forecast 2025-2030

Chart on India - Market size and forecast 2025-2030 ($ million)
Data Table on India - Market size and forecast 2025-2030 ($ million)
Chart on India - Year-over-year growth 2025-2030 (%)
Data Table on India - Year-over-year growth 2025-2030 (%)

12.3.5 Indonesia - Market size and forecast 2025-2030

Chart on Indonesia - Market size and forecast 2025-2030 ($ million)
Data Table on Indonesia - Market size and forecast 2025-2030 ($ million)
Chart on Indonesia - Year-over-year growth 2025-2030 (%)
Data Table on Indonesia - Year-over-year growth 2025-2030 (%)

12.3.6 Australia - Market size and forecast 2025-2030

Chart on Australia - Market size and forecast 2025-2030 ($ million)
Data Table on Australia - Market size and forecast 2025-2030 ($ million)
Chart on Australia - Year-over-year growth 2025-2030 (%)
Data Table on Australia - Year-over-year growth 2025-2030 (%)

12.4 Europe - Market size and forecast 2025-2030

Chart on Europe - Market size and forecast 2025-2030 ($ million)
Data Table on Europe - Market size and forecast 2025-2030 ($ million)
Chart on Europe - Year-over-year growth 2025-2030 (%)
Data Table on Europe - Year-over-year growth 2025-2030 (%)
Chart on Regional Comparison - Europe
Data Table on Regional Comparison - Europe

12.4.1 Germany - Market size and forecast 2025-2030

Chart on Germany - Market size and forecast 2025-2030 ($ million)
Data Table on Germany - Market size and forecast 2025-2030 ($ million)
Chart on Germany - Year-over-year growth 2025-2030 (%)
Data Table on Germany - Year-over-year growth 2025-2030 (%)

12.4.2 UK - Market size and forecast 2025-2030

Chart on UK - Market size and forecast 2025-2030 ($ million)
Data Table on UK - Market size and forecast 2025-2030 ($ million)
Chart on UK - Year-over-year growth 2025-2030 (%)
Data Table on UK - Year-over-year growth 2025-2030 (%)

12.4.3 France - Market size and forecast 2025-2030

Chart on France - Market size and forecast 2025-2030 ($ million)
Data Table on France - Market size and forecast 2025-2030 ($ million)
Chart on France - Year-over-year growth 2025-2030 (%)
Data Table on France - Year-over-year growth 2025-2030 (%)

12.4.4 Italy - Market size and forecast 2025-2030

Chart on Italy - Market size and forecast 2025-2030 ($ million)
Data Table on Italy - Market size and forecast 2025-2030 ($ million)
Chart on Italy - Year-over-year growth 2025-2030 (%)
Data Table on Italy - Year-over-year growth 2025-2030 (%)

12.4.5 Spain - Market size and forecast 2025-2030

Chart on Spain - Market size and forecast 2025-2030 ($ million)
Data Table on Spain - Market size and forecast 2025-2030 ($ million)
Chart on Spain - Year-over-year growth 2025-2030 (%)
Data Table on Spain - Year-over-year growth 2025-2030 (%)

12.4.6 The Netherlands - Market size and forecast 2025-2030

Chart on The Netherlands - Market size and forecast 2025-2030 ($ million)
Data Table on The Netherlands - Market size and forecast 2025-2030 ($ million)
Chart on The Netherlands - Year-over-year growth 2025-2030 (%)
Data Table on The Netherlands - Year-over-year growth 2025-2030 (%)

12.5 North America - Market size and forecast 2025-2030

Chart on North America - Market size and forecast 2025-2030 ($ million)
Data Table on North America - Market size and forecast 2025-2030 ($ million)
Chart on North America - Year-over-year growth 2025-2030 (%)
Data Table on North America - Year-over-year growth 2025-2030 (%)
Chart on Regional Comparison - North America
Data Table on Regional Comparison - North America

12.5.1 US - Market size and forecast 2025-2030

Chart on US - Market size and forecast 2025-2030 ($ million)
Data Table on US - Market size and forecast 2025-2030 ($ million)
Chart on US - Year-over-year growth 2025-2030 (%)
Data Table on US - Year-over-year growth 2025-2030 (%)

12.5.2 Mexico - Market size and forecast 2025-2030

Chart on Mexico - Market size and forecast 2025-2030 ($ million)
Data Table on Mexico - Market size and forecast 2025-2030 ($ million)
Chart on Mexico - Year-over-year growth 2025-2030 (%)
Data Table on Mexico - Year-over-year growth 2025-2030 (%)

12.5.3 Canada - Market size and forecast 2025-2030

Chart on Canada - Market size and forecast 2025-2030 ($ million)
Data Table on Canada - Market size and forecast 2025-2030 ($ million)
Chart on Canada - Year-over-year growth 2025-2030 (%)
Data Table on Canada - Year-over-year growth 2025-2030 (%)

12.6 South America - Market size and forecast 2025-2030

Chart on South America - Market size and forecast 2025-2030 ($ million)
Data Table on South America - Market size and forecast 2025-2030 ($ million)
Chart on South America - Year-over-year growth 2025-2030 (%)
Data Table on South America - Year-over-year growth 2025-2030 (%)
Chart on Regional Comparison - South America
Data Table on Regional Comparison - South America

12.6.1 Brazil - Market size and forecast 2025-2030

Chart on Brazil - Market size and forecast 2025-2030 ($ million)
Data Table on Brazil - Market size and forecast 2025-2030 ($ million)
Chart on Brazil - Year-over-year growth 2025-2030 (%)
Data Table on Brazil - Year-over-year growth 2025-2030 (%)

12.6.2 Chile - Market size and forecast 2025-2030

Chart on Chile - Market size and forecast 2025-2030 ($ million)
Data Table on Chile - Market size and forecast 2025-2030 ($ million)
Chart on Chile - Year-over-year growth 2025-2030 (%)
Data Table on Chile - Year-over-year growth 2025-2030 (%)

12.6.3 Argentina - Market size and forecast 2025-2030

Chart on Argentina - Market size and forecast 2025-2030 ($ million)
Data Table on Argentina - Market size and forecast 2025-2030 ($ million)
Chart on Argentina - Year-over-year growth 2025-2030 (%)
Data Table on Argentina - Year-over-year growth 2025-2030 (%)

12.7 Middle East and Africa - Market size and forecast 2025-2030

Chart on Middle East and Africa - Market size and forecast 2025-2030 ($ million)
Data Table on Middle East and Africa - Market size and forecast 2025-2030 ($ million)
Chart on Middle East and Africa - Year-over-year growth 2025-2030 (%)
Data Table on Middle East and Africa - Year-over-year growth 2025-2030 (%)
Chart on Regional Comparison - Middle East and Africa
Data Table on Regional Comparison - Middle East and Africa

12.7.1 UAE - Market size and forecast 2025-2030

Chart on UAE - Market size and forecast 2025-2030 ($ million)
Data Table on UAE - Market size and forecast 2025-2030 ($ million)
Chart on UAE - Year-over-year growth 2025-2030 (%)
Data Table on UAE - Year-over-year growth 2025-2030 (%)

12.7.2 Saudi Arabia - Market size and forecast 2025-2030

Chart on Saudi Arabia - Market size and forecast 2025-2030 ($ million)
Data Table on Saudi Arabia - Market size and forecast 2025-2030 ($ million)
Chart on Saudi Arabia - Year-over-year growth 2025-2030 (%)
Data Table on Saudi Arabia - Year-over-year growth 2025-2030 (%)

12.7.3 South Africa - Market size and forecast 2025-2030

Chart on South Africa - Market size and forecast 2025-2030 ($ million)
Data Table on South Africa - Market size and forecast 2025-2030 ($ million)
Chart on South Africa - Year-over-year growth 2025-2030 (%)
Data Table on South Africa - Year-over-year growth 2025-2030 (%)

12.7.4 Egypt - Market size and forecast 2025-2030

Chart on Egypt - Market size and forecast 2025-2030 ($ million)
Data Table on Egypt - Market size and forecast 2025-2030 ($ million)
Chart on Egypt - Year-over-year growth 2025-2030 (%)
Data Table on Egypt - Year-over-year growth 2025-2030 (%)

12.7.5 Turkey - Market size and forecast 2025-2030

Chart on Turkey - Market size and forecast 2025-2030 ($ million)
Data Table on Turkey - Market size and forecast 2025-2030 ($ million)
Chart on Turkey - Year-over-year growth 2025-2030 (%)
Data Table on Turkey - Year-over-year growth 2025-2030 (%)

12.8 Market opportunity by geography

Market opportunity by geography ($ million)
Data Tables on Market opportunity by geography ($ million)

13. Drivers, Challenges, and Opportunity

13.1 Market drivers

Stringent government regulations and favorable policies
Technological advancements in power semiconductor technology
Surging consumer demand and growing electric vehicle adoption

13.2 Market challenges

High cost of advanced power electronics and manufacturing complexity
Supply chain volatility and material constraints
Thermal management and technological advancement

13.3 Impact of drivers and challenges

Impact of drivers and challenges in 2025 and 2030

13.4 Market opportunities

Integration of inverters with other powertrain components
Adoption of 800-volt architecture
Emergence of bidirectional inverters and vehicle to grid technology

14. Competitive Landscape

14.1 Overview

14.2

Overview on criticality of inputs and factors of differentiation

14.3 Landscape disruption

Overview on factors of disruption

14.4 Industry risks

Impact of key risks on business

15. Competitive Analysis

15.1 Companies profiled

Companies covered

15.2 Company ranking index

15.3 Market positioning of companies

Matrix on companies position and classification

15.4 AISIN Corp.

AISIN Corp. - Overview
AISIN Corp. - Business segments
AISIN Corp. - Key offerings
AISIN Corp. - Segment focus
SWOT

15.5 BorgWarner Inc.

BorgWarner Inc. - Overview
BorgWarner Inc. - Business segments
BorgWarner Inc. - Key offerings
BorgWarner Inc. - Segment focus
SWOT

15.6 Dana Inc.

Dana Inc. - Overview
Dana Inc. - Business segments
Dana Inc. - Key news
Dana Inc. - Key offerings
Dana Inc. - Segment focus
SWOT

15.7 Delta Electronics Inc.

Delta Electronics Inc. - Overview
Delta Electronics Inc. - Business segments
Delta Electronics Inc. - Key offerings
Delta Electronics Inc. - Segment focus
SWOT

15.8 DENSO Corp.

DENSO Corp. - Overview
DENSO Corp. - Business segments
DENSO Corp. - Key news
DENSO Corp. - Key offerings
DENSO Corp. - Segment focus
SWOT

15.9 Eaton Corp. Plc

Eaton Corp. Plc - Overview
Eaton Corp. Plc - Business segments
Eaton Corp. Plc - Key news
Eaton Corp. Plc - Key offerings
Eaton Corp. Plc - Segment focus
SWOT

15.10 Hyundai Mobis Co. Ltd.

Hyundai Mobis Co. Ltd. - Overview
Hyundai Mobis Co. Ltd. - Business segments
Hyundai Mobis Co. Ltd. - Key offerings
Hyundai Mobis Co. Ltd. - Segment focus
SWOT

15.11 Magna International Inc.

Magna International Inc. - Overview
Magna International Inc. - Business segments
Magna International Inc. - Key offerings
Magna International Inc. - Segment focus
SWOT

15.12 Meidensha Corp.

Meidensha Corp. - Overview
Meidensha Corp. - Business segments
Meidensha Corp. - Key offerings
Meidensha Corp. - Segment focus
SWOT

15.13 Mitsubishi Electric Corp.

Mitsubishi Electric Corp. - Overview
Mitsubishi Electric Corp. - Business segments
Mitsubishi Electric Corp. - Key offerings
Mitsubishi Electric Corp. - Segment focus
SWOT

15.14 Robert Bosch GmbH

Robert Bosch GmbH - Overview
Robert Bosch GmbH - Product / Service
Robert Bosch GmbH - Key offerings
SWOT

15.15 Schaeffler AG

Schaeffler AG - Overview
Schaeffler AG - Business segments
Schaeffler AG - Key news
Schaeffler AG - Key offerings
Schaeffler AG - Segment focus
SWOT

15.16 Toyota Industries Corp.

Toyota Industries Corp. - Overview
Toyota Industries Corp. - Business segments
Toyota Industries Corp. - Key offerings
Toyota Industries Corp. - Segment focus
SWOT

15.17 Valeo SA

Valeo SA - Overview
Valeo SA - Business segments
Valeo SA - Key news
Valeo SA - Key offerings
Valeo SA - Segment focus
SWOT

15.18 ZF Friedrichshafen AG

ZF Friedrichshafen AG - Overview
ZF Friedrichshafen AG - Product / Service
ZF Friedrichshafen AG - Key offerings
SWOT

16. Appendix

16.1 Scope of the report

Market definition
Objectives
Notes and caveats

16.2 Inclusions and exclusions checklist

Inclusions checklist
Exclusions checklist

16.3 Currency conversion rates for US$

16.4 Research methodology

16.5 Data procurement

Information sources

16.6 Data validation

16.7 Validation techniques employed for market sizing

16.8 Data synthesis

16.9 360 degree market analysis

16.10 List of abbreviations

Research Methodology

Technavio presents a detailed picture of the market by way of study, synthesis, and summation of data from multiple sources. The analysts have presented the various facets of the market with a particular focus on identifying the key industry influencers. The data thus presented is comprehensive, reliable, and the result of extensive research, both primary and secondary.

INFORMATION SOURCES

Primary sources

  • Manufacturers and suppliers
  • Channel partners
  • Industry experts
  • Strategic decision makers

Secondary sources

  • Industry journals and periodicals
  • Government data
  • Financial reports of key industry players
  • Historical data
  • Press releases

DATA ANALYSIS

Data Synthesis

  • Collation of data
  • Estimation of key figures
  • Analysis of derived insights

Data Validation

  • Triangulation with data models
  • Reference against proprietary databases
  • Corroboration with industry experts

REPORT WRITING

Qualitative

  • Market drivers
  • Market challenges
  • Market trends
  • Five forces analysis

Quantitative

  • Market size and forecast
  • Market segmentation
  • Geographical insights
  • Competitive landscape

Interested in this report?

Get your sample now to see our research methodology and insights!

Download Now

Frequently Asked Questions

Electric Vehicle (Ev) Power Inverter market growth will increase by USD 22327.9 million during 2026-2030.

The Electric Vehicle (Ev) Power Inverter market is expected to grow at a CAGR of 10.6% during 2026-2030.

Electric Vehicle (Ev) Power Inverter market is segmented by Application (Pure EV, Full hybrids, Plug-in hybrids, Mild hybrids, Commercial HEV) Type (Passenger cars, Commercial vehicles) Distribution channel (Original manufacturer, Aftermarket)

AISIN Corp., Astemo Ltd., BorgWarner Inc., Curtis Instruments Inc., Dana Inc., Danfoss AS, Delta Electronics Inc., DENSO Corp., Eaton Corp. Plc, GKN Automotive Ltd., Hyundai Mobis Co. Ltd., Magna International Inc., MAHLE GmbH, Meidensha Corp., Mitsubishi Electric Corp., Robert Bosch GmbH, Schaeffler AG, Toyota Industries Corp., Valeo SA, ZF Friedrichshafen AG are a few of the key vendors in the Electric Vehicle (Ev) Power Inverter market.

APAC will register the highest growth rate of 62.7% among the other regions. Therefore, the Electric Vehicle (Ev) Power Inverter market in APAC is expected to garner significant business opportunities for the vendors during the forecast period.

China, Japan, South Korea, India, Indonesia, Australia, Germany, UK, France, Italy, Spain, The Netherlands, US, Mexico, Canada, Brazil, Chile, Argentina, UAE, Saudi Arabia, South Africa, Egypt, Turkey

  • Stringent government regulations and favorable policies is the driving factor this market.

The Electric Vehicle (Ev) Power Inverter market vendors should focus on grabbing business opportunities from the Application segment as it accounted for the largest market share in the base year.
RIA - Research AI Assistant
Ask RIA
