Electrical Bushing Market Analysis Europe, APAC, North America, Middle East and Africa, South America - US, China, Japan, Germany, India - Size and Forecast 2024-2028

Electrical Bushing Market Analysis Europe, APAC, North America, Middle East and Africa, South America - US, China, Japan, Germany, India - Size and Forecast 2024-2028

Published: Jul 2024 165 Pages SKU: IRTNTR74996

Market Overview at a Glance

$822.5 Mn
Market Opportunity
5.22%
CAGR
4.32
YoY growth 2023-2024(%)

Electrical Bushing Market Size 2024-2028 

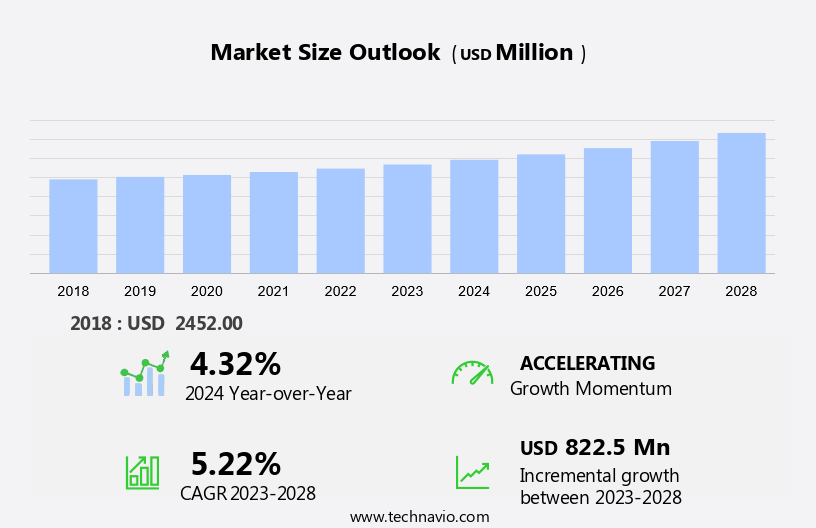
The electrical bushing market size is forecast to increase by USD 822.5 million at a CAGR of 5.22% between 2023 and 2028. The market is experiencing significant growth due to several key drivers. The modernization of existing power transformers in the utility segment is a major factor fueling market expansion. Additionally, the increasing investment in renewable energy sources, such as wind and solar power generation units, is driving demand for electrical bushings in the OIP (Onload Tap Changer) segment. Furthermore, new regulations mandating the replacement of old power transformers due to safety concerns and rising electricity consumption in commercial establishments are increasing the cost of power transformers, thereby boosting the market. Shunt reactors, another application area for electrical bushings, are also witnessing increased adoption due to their ability to improve power factor and enhance system stability.

Electrical Bushing Market Size

 Request Free Sample

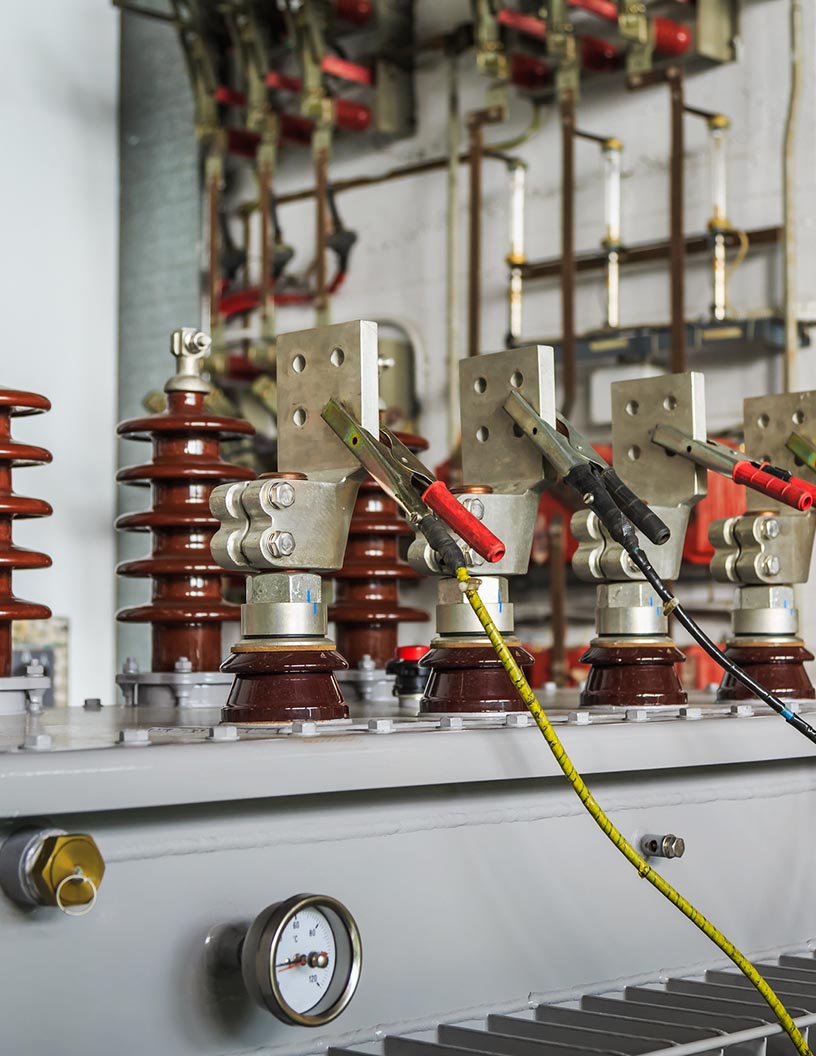
The Electrical Bushing Market is a significant sector in the power industry, providing essential insulation components for various electrical equipment. These components play a vital role in ensuring the efficient and safe operation of electrical systems, particularly in transformers and switchgears. Two primary types of electrical bushings dominate the market: oil impregnated paper (OIP) and resin impregnated paper (RIP). OIP bushings are coated with insulating oil, which provides excellent insulation properties and moisture resistance. In contrast, RIP bushings are coated with a resin material, offering superior electrical performance and resistance to thermal aging. Transformers and switchgears are the primary applications for electrical bushings. Transformers are crucial in the power grid structure, facilitating the efficient conversion of electrical power from one voltage level to another. Switchgears, on the other hand, protect electrical circuits from overcurrent and faults.

Additionally, power demand continues to grow, driven by the expansion of the grid structure, railway systems, smart grids, and the renewable sector. The increasing adoption of renewable energy sources, such as wind and solar, necessitates the installation of power generation units and electrical networks to transport and distribute electricity. Commercial establishments, utility segments, and the electricity industry are significant consumers of electrical bushings. Shunt reactors and power capacitors, which are essential components in power systems, also require electrical bushings for insulation. The electrical network expenditure is a significant factor driving the growth of the electrical bushings market. The increasing investment in grid infrastructure and upgrades, particularly in developing countries, is expected to boost demand for electrical bushings. The renewable sector is another key market for electrical bushings, particularly in the medium voltage range.

Further, renewable energy sources, such as wind and solar, require electrical bushings for transformer and switchgear applications. SF6 and hybrid insulation systems are emerging trends in the electrical bushings market. SF6 is a gas insulation medium that offers higher voltage levels and improved electrical performance. Hybrid insulation systems combine both oil and resin impregnated materials to provide enhanced insulation properties. Insulation materials, such as porcelain and polymeric, are used in the production of electrical bushings. Porcelain provides excellent electrical insulation properties and is widely used in high voltage applications. Polymeric materials offer flexibility, ease of installation, and cost-effectiveness. In conclusion, the electrical bushings market plays a crucial role in the power industry by providing insulation solutions for transformers and switchgears. The growing power demand, investment in grid infrastructure, and the adoption of renewable energy sources are expected to drive the market's growth.

Market Segmentation

The market research report provides comprehensive data (region-wise segment analysis), with forecasts and estimates in "USD million" for the period 2024-2028, as well as historical data from 2018-2022 for the following segments.

  • Type
    • Oil impregnated paper (OIP)
    • Resin impregnated paper (RIP)
    • Others
  • Application
    • Transformer
    • Switchgear
    • Others
  • Geography
    • Europe
      • Germany
    • APAC
      • China
      • India
      • Japan
    • North America
      • US
    • Middle East and Africa
    • South America

By Type Insights

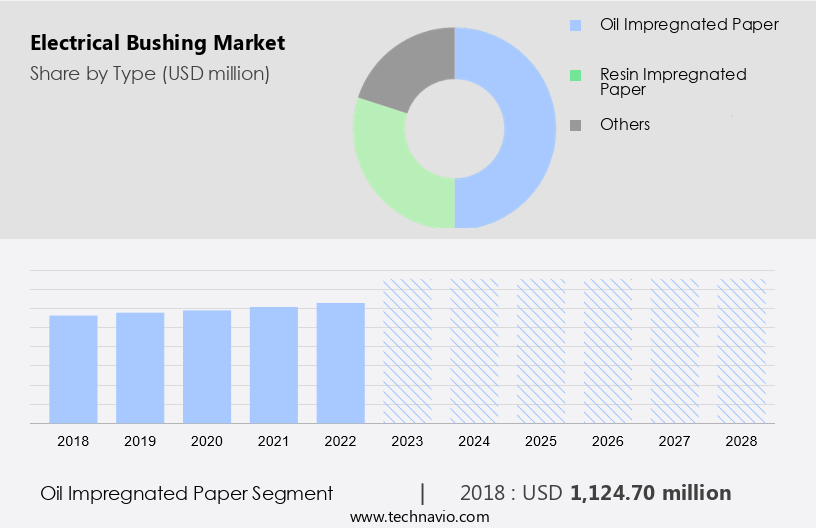
The oil impregnated paper (OIP) segment is estimated to witness significant growth during the forecast period. In the realm of high-voltage power systems, Oil Impregnated Paper (OIP) bushings are the preferred choice due to their effectiveness in insulation. These bushings are manufactured by winding untreated kraft paper with conduction inserts around a central tube. The electric field is controlled by strategically placing aluminum layers at precise axial and radial positions within the conductive inserts. The condenser insulation undergoes a process of impregnation with mineral oil, enhancing the bushing's dielectric strength.

Furthermore, mineral oil, a common component in power transformers and switchgear is typically used for this purpose. The dominance of OIP bushings is evident in the global market, with approximately 75% of installed bushings adopting this design. This percentage is notably higher in countries like China and the USA. The oil-impregnated paper design is increasingly popular in substation transformer applications worldwide.

Electrical Bushing Market Size

Get a glance at the market share of various segments Request Free Sample

The oil impregnated paper segment accounted for USD 1.12 billion in 2018 and showed a gradual increase during the forecast period.

Regional Insights

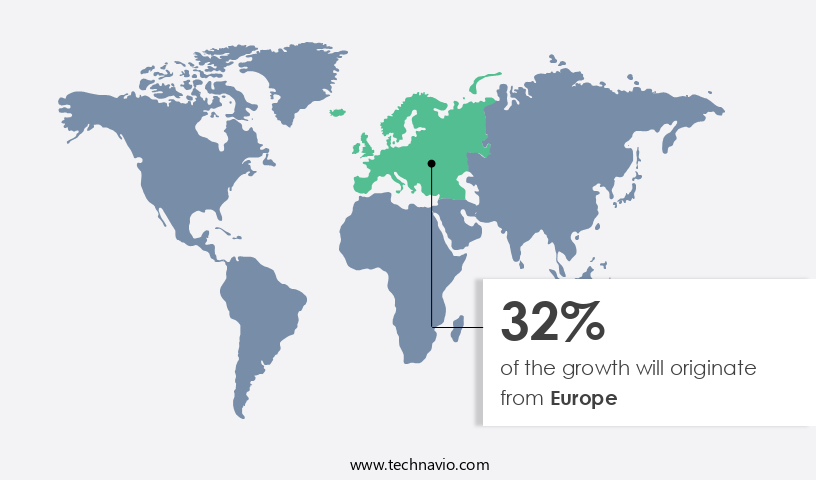
Europe is estimated to contribute 32% to the growth of the global market during the forecast period. Technavio's analysts have elaborately explained the regional trends and drivers that shape the market during the forecast period.

Electrical Bushing Market Share by Geography

For more insights on the market share of various regions Request Free Sample

The market is witnessing substantial growth due to the expanding transmission and distribution (T&D) infrastructure, particularly in Asia Pacific (APAC). Countries such as China, India, Vietnam, Thailand, and the Philippines are experiencing a wave in urban population and industrial growth, leading to a heightened demand for electric power. Consequently, there is an increasing need for installing and expanding T&D equipment, including power and distribution transformers, within the existing grid to cater to the expanding network. Key applications for electrical bushings include circuit breakers, generators, reactors, and wall applications. In addition, the utilities sector, railways and metro systems, renewable energy, and aging power systems are significant end-users.

Our researchers analyzed the data with 2023 as the base year, along with the key drivers, trends, and challenges. A holistic analysis of drivers will help companies refine their marketing strategies to gain a competitive advantage.

Market Driver

Modernization of existing transformers is the key driver of the market. The market is experiencing growth due to several factors. The aging grid infrastructure necessitates the installation of new transformers and the replacement of old ones, as many networks struggle to meet the escalating energy demand. Moisture ingress and broken tap connections pose significant challenges, increasing the risk of electrical flashovers and corrosive sulfur intrusion.

Lightning strikes can also cause broken connections, leading to power outages and potential damage to equipment. Regulatory reforms, such as those in India under the Accelerated Power Development and Reform Programme (APDRP), aim to reduce power losses and modernize electrical networks. These initiatives are driving market expansion. The need to upgrade and expand existing infrastructure to meet the increasing power demand is a primary growth factor.

Market Trends

Increasing investment in renewable energy sources is the upcoming trend in the market. The shift towards renewable energy sources is gaining momentum worldwide due to increasing awareness of the depleting fossil fuel resources and stringent carbon emission regulations. Renewable energy capacity, particularly in wind and solar, is anticipated to expand significantly in the coming years. Further, porcelain and polymeric bushings are commonly used in high voltage applications due to their excellent insulation properties. Industrial applications, particularly in the power generation sector, are increasingly adopting renewable energy sources to meet their energy demands.

Additionally, power capacitors are essential in these applications to maintain voltage stability and improve power factor correction. As the renewable energy market continues to grow, the demand for power capacitors is expected to increase, providing significant opportunities for manufacturers and suppliers.

Market Challenge

New regulations increase cost of power transformers is a key challenge affecting the market growth. The market in both Europe and the US has been subjected to increasingly strict regulations regarding energy efficiency in power transformers. In the US, the Department of Energy (DOE) implemented regulations for low-voltage dry-type power transformers in 2007, requiring manufacturers to meet the NEMA TP-1 minimum energy efficiency standard. This standard was revised in 2016 with new efficiency requirements. .

Additionally, the utility segment and commercial establishments are significant consumers of electricity, with power consumption increasing due to the integration of renewable energy sources and the operation of power generation units. Shunt reactors are employed to improve power quality and stability in electrical systems. The OIP segment is also growing as industries seek to optimize their electrical infrastructure and reduce energy losses. The market is expected to expand due to these factors.

Exclusive Customer Landscape

The market forecasting report includes the adoption lifecycle of the market, covering from the innovator's stage to the laggard's stage. It focuses on adoption rates in different regions based on penetration. Furthermore, the report also includes key purchase criteria and drivers of price sensitivity to help companies evaluate and develop their market growth analysis strategies.

Electrical Bushing Market Share by Geography

 Customer Landscape

Key Companies & Market Insights

Companies are implementing various strategies, such as strategic alliances, partnerships, mergers and acquisitions, geographical expansion, and product/service launches, to enhance their presence in the market.

ABB Ltd.: The company offers electrical bushing such as Condenser type O plus C.

The market research and growth report includes detailed analyses of the competitive landscape of the market and information about key companies, including:

  • ALMACENES CORONA SAS
  • Alutronic Kuhlkorper GmbH and Co. KG. 
  • Bharat Heavy Electricals Ltd.
  • CG Power and Industrial Solutions Ltd.
  • Eaton Corp. Plc
  • Elliott Industries Inc.
  • General Electric Co.
  • GIPRO GmbH
  • HSP Hochspannungsgerate GmbH
  • Maschinenfabrik Reinhausen GmbH
  • Megger Ltd.
  • Nanjing Rainbow Electric Co., Ltd.
  • Nexans SA
  • Preis GmbH
  • Radiant Enterprises
  • Siemens AG
  • Toshiba Corp.
  • Webster Wilkinson Ltd.
  • Weidmann Holding AG

Qualitative and quantitative analysis of companies has been conducted to help clients understand the wider business environment as well as the strengths and weaknesses of key market players. Data is qualitatively analyzed to categorize companies as pure play, category-focused, industry-focused, and diversified; it is quantitatively analyzed to categorize companies as dominant, leading, strong, tentative, and weak.

Research Analyst Overview

The market is witnessing significant growth due to the increasing power demand and the expansion of the grid structure. Transformers and switchgears are the primary consumers of electrical bushings in power infrastructure development. The transformer sub-sector is expected to dominate the market, given the large number of transformers used in the power generation sector. The use of oil impregnated paper and resin impregnated paper bushings in transformers and switchgears is prevalent. However, the shift towards resin bonded paper, resin impregnated synthetic, SF6, hybrid, and other advanced materials is gaining traction due to their superior insulation properties and ability to withstand high voltage and current.

Further, the renewable energy sector is another significant market for electrical bushings, with wind and solar power generation units requiring large numbers of bushings. Smart grids and renewable energy sources are expected to drive the market growth in the coming years. Railways and metro systems, utilities, and commercial establishments are other major consumers of electrical bushings. Aging power systems, moisture ingress, lightning strikes, broken connections, electrical flashover, corrosive sulfur, and broken tap connections are some of the challenges driving the demand for electrical bushings in the power infrastructure sector. Regulatory reforms and grid infrastructure development are also expected to boost the market growth. The medium voltage, voltage, extra high voltage, and industrial segments are expected to offer significant opportunities for electrical bushing manufacturers.

Market Scope

Report Coverage

Details

Page number

165

Base year

2023

Historic period

2018-2022

Forecast period

2024-2028

Growth momentum & CAGR

Accelerate at a CAGR of 5.22%

Market growth 2024-2028

USD 822.5 million

Market structure

Fragmented

YoY growth 2023-2024(%)

4.32

Regional analysis

Europe, APAC, North America, Middle East and Africa, and South America

Performing market contribution

Europe at 32%

Key countries

US, China, Japan, Germany, and India

Competitive landscape

Leading Companies, Market Positioning of Companies, Competitive Strategies, and Industry Risks

Key companies profiled

ABB Ltd., ALMACENES CORONA SAS, Alutronic Kuhlkorper GmbH and Co. KG. , Bharat Heavy Electricals Ltd., CG Power and Industrial Solutions Ltd., Eaton Corp. Plc, Elliott Industries Inc., General Electric Co., GIPRO GmbH, HSP Hochspannungsgerate GmbH, Maschinenfabrik Reinhausen GmbH, Megger Ltd., Nanjing Rainbow Electric Co., Ltd., Nexans SA, Preis GmbH, Radiant Enterprises, Siemens AG, Toshiba Corp., Webster Wilkinson Ltd., and Weidmann Holding AG

Market dynamics

Parent market analysis, market growth inducers and obstacles, market forecast, fast-growing and slow-growing segment analysis, COVID-19 impact and recovery analysis and future consumer dynamics, market condition analysis for the forecast period

Customization purview

If our market report has not included the data that you are looking for, you can reach out to our analysts and get segments customized.

Request Free Sample

What are the Key Data Covered in this Market Research and Growth Report?

  • CAGR of the market during the forecast period
  • Detailed information on factors that will drive the market growth and forecasting between 2024 and 2028
  • Precise estimation of the size of the market  and its contribution of the market in focus to the parent market
  • Accurate predictions about upcoming market growth and trends and changes in consumer behaviour
  • Growth of the market across Europe, APAC, North America, Middle East and Africa, and South America
  • Thorough analysis of the market's competitive landscape and detailed information about companies
  • Comprehensive analysis of factors that will challenge the growth of market companies

We can help! Our analysts can customize this market research report to meet your requirements. Get in touch

1 Executive Summary

  • 1.1 Market overview
    • Executive Summary - Chart on Market Overview
    • Executive Summary - Data Table on Market Overview
    • Executive Summary - Chart on Global Market Characteristics
    • Executive Summary - Chart on Market by Geography
    • Executive Summary - Chart on Market Segmentation by Type
    • Executive Summary - Chart on Market Segmentation by Application
    • Executive Summary - Chart on Incremental Growth
    • Executive Summary - Data Table on Incremental Growth
    • Executive Summary - Chart on Company Market Positioning

2 Market Landscape

  • 2.1 Market ecosystem
    • Parent Market
    • Data Table on - Parent Market
  • 2.2 Market characteristics
    • Market characteristics analysis
  • 2.3 Value chain analysis
    • Value Chain Analysis

3 Market Sizing

  • 3.1 Market definition
    • Offerings of companies included in the market definition
  • 3.2 Market segment analysis
    • Market segments
  • 3.3 Market size 2023
    • 3.4 Market outlook: Forecast for 2023-2028
      • Chart on Global - Market size and forecast 2023-2028 ($ million)
      • Data Table on Global - Market size and forecast 2023-2028 ($ million)
      • Chart on Global Market: Year-over-year growth 2023-2028 (%)
      • Data Table on Global Market: Year-over-year growth 2023-2028 (%)

    4 Historic Market Size

    • 4.1 Global Electrical Bushing Market 2018 - 2022
      • Historic Market Size - Data Table on Global Electrical Bushing Market 2018 - 2022 ($ million)
    • 4.2 Type segment analysis 2018 - 2022
      • Historic Market Size - Type Segment 2018 - 2022 ($ million)
    • 4.3 Application segment analysis 2018 - 2022
      • Historic Market Size - Application Segment 2018 - 2022 ($ million)
    • 4.4 Geography segment analysis 2018 - 2022
      • Historic Market Size - Geography Segment 2018 - 2022 ($ million)
    • 4.5 Country segment analysis 2018 - 2022
      • Historic Market Size - Country Segment 2018 - 2022 ($ million)

    5 Five Forces Analysis

    • 5.1 Five forces summary
      • Five forces analysis - Comparison between 2023 and 2028
    • 5.2 Bargaining power of buyers
      • Bargaining power of buyers - Impact of key factors 2023 and 2028
    • 5.3 Bargaining power of suppliers
      • Bargaining power of suppliers - Impact of key factors in 2023 and 2028
    • 5.4 Threat of new entrants
      • Threat of new entrants - Impact of key factors in 2023 and 2028
    • 5.5 Threat of substitutes
      • Threat of substitutes - Impact of key factors in 2023 and 2028
    • 5.6 Threat of rivalry
      • Threat of rivalry - Impact of key factors in 2023 and 2028
    • 5.7 Market condition
      • Chart on Market condition - Five forces 2023 and 2028

    6 Market Segmentation by Type

    • 6.1 Market segments
      • Chart on Type - Market share 2023-2028 (%)
      • Data Table on Type - Market share 2023-2028 (%)
    • 6.2 Comparison by Type
      • Chart on Comparison by Type
      • Data Table on Comparison by Type
    • 6.3 Oil impregnated paper (OIP) - Market size and forecast 2023-2028
      • Chart on Oil impregnated paper (OIP) - Market size and forecast 2023-2028 ($ million)
      • Data Table on Oil impregnated paper (OIP) - Market size and forecast 2023-2028 ($ million)
      • Chart on Oil impregnated paper (OIP) - Year-over-year growth 2023-2028 (%)
      • Data Table on Oil impregnated paper (OIP) - Year-over-year growth 2023-2028 (%)
    • 6.4 Resin impregnated paper (RIP) - Market size and forecast 2023-2028
      • Chart on Resin impregnated paper (RIP) - Market size and forecast 2023-2028 ($ million)
      • Data Table on Resin impregnated paper (RIP) - Market size and forecast 2023-2028 ($ million)
      • Chart on Resin impregnated paper (RIP) - Year-over-year growth 2023-2028 (%)
      • Data Table on Resin impregnated paper (RIP) - Year-over-year growth 2023-2028 (%)
    • 6.5 Others - Market size and forecast 2023-2028
      • Chart on Others - Market size and forecast 2023-2028 ($ million)
      • Data Table on Others - Market size and forecast 2023-2028 ($ million)
      • Chart on Others - Year-over-year growth 2023-2028 (%)
      • Data Table on Others - Year-over-year growth 2023-2028 (%)
    • 6.6 Market opportunity by Type
      • Market opportunity by Type ($ million)
      • Data Table on Market opportunity by Type ($ million)

    7 Market Segmentation by Application

    • 7.1 Market segments
      • Chart on Application - Market share 2023-2028 (%)
      • Data Table on Application - Market share 2023-2028 (%)
    • 7.2 Comparison by Application
      • Chart on Comparison by Application
      • Data Table on Comparison by Application
    • 7.3 Transformer - Market size and forecast 2023-2028
      • Chart on Transformer - Market size and forecast 2023-2028 ($ million)
      • Data Table on Transformer - Market size and forecast 2023-2028 ($ million)
      • Chart on Transformer - Year-over-year growth 2023-2028 (%)
      • Data Table on Transformer - Year-over-year growth 2023-2028 (%)
    • 7.4 Switchgear - Market size and forecast 2023-2028
      • Chart on Switchgear - Market size and forecast 2023-2028 ($ million)
      • Data Table on Switchgear - Market size and forecast 2023-2028 ($ million)
      • Chart on Switchgear - Year-over-year growth 2023-2028 (%)
      • Data Table on Switchgear - Year-over-year growth 2023-2028 (%)
    • 7.5 Others - Market size and forecast 2023-2028
      • Chart on Others - Market size and forecast 2023-2028 ($ million)
      • Data Table on Others - Market size and forecast 2023-2028 ($ million)
      • Chart on Others - Year-over-year growth 2023-2028 (%)
      • Data Table on Others - Year-over-year growth 2023-2028 (%)
    • 7.6 Market opportunity by Application
      • Market opportunity by Application ($ million)
      • Data Table on Market opportunity by Application ($ million)

    8 Customer Landscape

    • 8.1 Customer landscape overview
      • Analysis of price sensitivity, lifecycle, customer purchase basket, adoption rates, and purchase criteria

    9 Geographic Landscape

    • 9.1 Geographic segmentation
      • Chart on Market share by geography 2023-2028 (%)
      • Data Table on Market share by geography 2023-2028 (%)
    • 9.2 Geographic comparison
      • Chart on Geographic comparison
      • Data Table on Geographic comparison
    • 9.3 Europe - Market size and forecast 2023-2028
      • Chart on Europe - Market size and forecast 2023-2028 ($ million)
      • Data Table on Europe - Market size and forecast 2023-2028 ($ million)
      • Chart on Europe - Year-over-year growth 2023-2028 (%)
      • Data Table on Europe - Year-over-year growth 2023-2028 (%)
    • 9.4 APAC - Market size and forecast 2023-2028
      • Chart on APAC - Market size and forecast 2023-2028 ($ million)
      • Data Table on APAC - Market size and forecast 2023-2028 ($ million)
      • Chart on APAC - Year-over-year growth 2023-2028 (%)
      • Data Table on APAC - Year-over-year growth 2023-2028 (%)
    • 9.5 North America - Market size and forecast 2023-2028
      • Chart on North America - Market size and forecast 2023-2028 ($ million)
      • Data Table on North America - Market size and forecast 2023-2028 ($ million)
      • Chart on North America - Year-over-year growth 2023-2028 (%)
      • Data Table on North America - Year-over-year growth 2023-2028 (%)
    • 9.6 Middle East and Africa - Market size and forecast 2023-2028
      • Chart on Middle East and Africa - Market size and forecast 2023-2028 ($ million)
      • Data Table on Middle East and Africa - Market size and forecast 2023-2028 ($ million)
      • Chart on Middle East and Africa - Year-over-year growth 2023-2028 (%)
      • Data Table on Middle East and Africa - Year-over-year growth 2023-2028 (%)
    • 9.7 South America - Market size and forecast 2023-2028
      • Chart on South America - Market size and forecast 2023-2028 ($ million)
      • Data Table on South America - Market size and forecast 2023-2028 ($ million)
      • Chart on South America - Year-over-year growth 2023-2028 (%)
      • Data Table on South America - Year-over-year growth 2023-2028 (%)
    • 9.8 US - Market size and forecast 2023-2028
      • Chart on US - Market size and forecast 2023-2028 ($ million)
      • Data Table on US - Market size and forecast 2023-2028 ($ million)
      • Chart on US - Year-over-year growth 2023-2028 (%)
      • Data Table on US - Year-over-year growth 2023-2028 (%)
    • 9.9 China - Market size and forecast 2023-2028
      • Chart on China - Market size and forecast 2023-2028 ($ million)
      • Data Table on China - Market size and forecast 2023-2028 ($ million)
      • Chart on China - Year-over-year growth 2023-2028 (%)
      • Data Table on China - Year-over-year growth 2023-2028 (%)
    • 9.10 Japan - Market size and forecast 2023-2028
      • Chart on Japan - Market size and forecast 2023-2028 ($ million)
      • Data Table on Japan - Market size and forecast 2023-2028 ($ million)
      • Chart on Japan - Year-over-year growth 2023-2028 (%)
      • Data Table on Japan - Year-over-year growth 2023-2028 (%)
    • 9.11 Germany - Market size and forecast 2023-2028
      • Chart on Germany - Market size and forecast 2023-2028 ($ million)
      • Data Table on Germany - Market size and forecast 2023-2028 ($ million)
      • Chart on Germany - Year-over-year growth 2023-2028 (%)
      • Data Table on Germany - Year-over-year growth 2023-2028 (%)
    • 9.12 India - Market size and forecast 2023-2028
      • Chart on India - Market size and forecast 2023-2028 ($ million)
      • Data Table on India - Market size and forecast 2023-2028 ($ million)
      • Chart on India - Year-over-year growth 2023-2028 (%)
      • Data Table on India - Year-over-year growth 2023-2028 (%)
    • 9.13 Market opportunity by geography
      • Market opportunity by geography ($ million)
      • Data Tables on Market opportunity by geography ($ million)

    10 Drivers, Challenges, and Opportunity/Restraints

    • 10.1 Market drivers
      • 10.2 Market challenges
        • 10.3 Impact of drivers and challenges
          • Impact of drivers and challenges in 2023 and 2028
        • 10.4 Market opportunities/restraints

          11 Competitive Landscape

          • 11.1 Overview
            • 11.2 Competitive Landscape
              • Overview on criticality of inputs and factors of differentiation
            • 11.3 Landscape disruption
              • Overview on factors of disruption
            • 11.4 Industry risks
              • Impact of key risks on business

            12 Competitive Analysis

            • 12.1 Companies profiled
              • Companies covered
            • 12.2 Market positioning of companies
              • Matrix on companies position and classification
            • 12.3 ABB Ltd.
              • ABB Ltd. - Overview
              • ABB Ltd. - Business segments
              • ABB Ltd. - Key news
              • ABB Ltd. - Key offerings
              • ABB Ltd. - Segment focus
            • 12.4 ALMACENES CORONA SAS
              • ALMACENES CORONA SAS - Overview
              • ALMACENES CORONA SAS - Product / Service
              • ALMACENES CORONA SAS - Key offerings
            • 12.5 CG Power and Industrial Solutions Ltd.
              • CG Power and Industrial Solutions Ltd. - Overview
              • CG Power and Industrial Solutions Ltd. - Business segments
              • CG Power and Industrial Solutions Ltd. - Key offerings
              • CG Power and Industrial Solutions Ltd. - Segment focus
            • 12.6 Eaton Corp. Plc
              • Eaton Corp. Plc - Overview
              • Eaton Corp. Plc - Business segments
              • Eaton Corp. Plc - Key news
              • Eaton Corp. Plc - Key offerings
              • Eaton Corp. Plc - Segment focus
            • 12.7 Elliott Industries Inc.
              • Elliott Industries Inc. - Overview
              • Elliott Industries Inc. - Product / Service
              • Elliott Industries Inc. - Key offerings
            • 12.8 General Electric Co.
              • General Electric Co. - Overview
              • General Electric Co. - Business segments
              • General Electric Co. - Key news
              • General Electric Co. - Key offerings
              • General Electric Co. - Segment focus
            • 12.9 GIPRO GmbH
              • GIPRO GmbH - Overview
              • GIPRO GmbH - Product / Service
              • GIPRO GmbH - Key offerings
            • 12.10 HSP Hochspannungsgerate GmbH
              • HSP Hochspannungsgerate GmbH - Overview
              • HSP Hochspannungsgerate GmbH - Product / Service
              • HSP Hochspannungsgerate GmbH - Key offerings
            • 12.11 Megger Ltd.
              • Megger Ltd. - Overview
              • Megger Ltd. - Key offerings
            • 12.12 Nanjing Rainbow Electric Co., Ltd.
              • Nanjing Rainbow Electric Co., Ltd. - Overview
              • Nanjing Rainbow Electric Co., Ltd. - Product / Service
              • Nanjing Rainbow Electric Co., Ltd. - Key offerings
            • 12.13 Nexans SA
              • Nexans SA - Overview
              • Nexans SA - Business segments
              • Nexans SA - Key news
              • Nexans SA - Key offerings
              • Nexans SA - Segment focus
            • 12.14 Siemens AG
              • Siemens AG - Overview
              • Siemens AG - Business segments
              • Siemens AG - Key news
              • Siemens AG - Key offerings
              • Siemens AG - Segment focus
            • 12.15 Toshiba Corp.
              • Toshiba Corp. - Overview
              • Toshiba Corp. - Business segments
              • Toshiba Corp. - Key news
              • Toshiba Corp. - Key offerings
              • Toshiba Corp. - Segment focus
            • 12.16 Webster Wilkinson Ltd.
              • Webster Wilkinson Ltd. - Overview
              • Webster Wilkinson Ltd. - Product / Service
              • Webster Wilkinson Ltd. - Key offerings
            • 12.17 Weidmann Holding AG
              • Weidmann Holding AG - Overview
              • Weidmann Holding AG - Product / Service
              • Weidmann Holding AG - Key offerings

            13 Appendix

            • 13.1 Scope of the report
              • 13.2 Inclusions and exclusions checklist
                • Inclusions checklist
                • Exclusions checklist
              • 13.3 Currency conversion rates for US$
                • Currency conversion rates for US$
              • 13.4 Research methodology
                • Research methodology
              • 13.5 Data procurement
                • Information sources
              • 13.6 Data validation
                • Data validation
              • 13.7 Validation techniques employed for market sizing
                • Validation techniques employed for market sizing
              • 13.8 Data synthesis
                • Data synthesis
              • 13.9 360 degree market analysis
                • 360 degree market analysis
              • 13.10 List of abbreviations
                • List of abbreviations

              Research Methodology

              Technavio presents a detailed picture of the market by way of study, synthesis, and summation of data from multiple sources. The analysts have presented the various facets of the market with a particular focus on identifying the key industry influencers. The data thus presented is comprehensive, reliable, and the result of extensive research, both primary and secondary.

              INFORMATION SOURCES

              Primary sources

              • Manufacturers and suppliers
              • Channel partners
              • Industry experts
              • Strategic decision makers

              Secondary sources

              • Industry journals and periodicals
              • Government data
              • Financial reports of key industry players
              • Historical data
              • Press releases

              DATA ANALYSIS

              Data Synthesis

              • Collation of data
              • Estimation of key figures
              • Analysis of derived insights

              Data Validation

              • Triangulation with data models
              • Reference against proprietary databases
              • Corroboration with industry experts

              REPORT WRITING

              Qualitative

              • Market drivers
              • Market challenges
              • Market trends
              • Five forces analysis

              Quantitative

              • Market size and forecast
              • Market segmentation
              • Geographical insights
              • Competitive landscape

              Interested in this report?

              Get your sample now to see our research methodology and insights!

              Download Now

              Frequently Asked Questions

              Electrical Bushing market growth will increase by $ 822.5 mn during 2024-2028 .

              The Electrical Bushing market is expected to grow at a CAGR of 5.22% during 2024-2028 .

              Electrical Bushing market is segmented by Type( Oil impregnated paper, Resin impregnated paper, Others) Application( Transformer, Switchgear, Others)

              ABB Ltd., ALMACENES CORONA SAS, Alutronic Kuhlkorper GmbH and Co. KG. , Bharat Heavy Electricals Ltd., CG Power and Industrial Solutions Ltd., Eaton Corp. Plc, Elliott Industries Inc., General Electric Co., GIPRO GmbH, HSP Hochspannungsgerate GmbH, Maschinenfabrik Reinhausen GmbH, Megger Ltd., Nanjing Rainbow Electric Co., Ltd., Nexans SA, Preis GmbH, Radiant Enterprises, Siemens AG, Toshiba Corp., Webster Wilkinson Ltd., Weidmann Holding AG are a few of the key vendors in the Electrical Bushing market.

              Europe will register the highest growth rate of 32% among the other regions. Therefore, the Electrical Bushing market in Europe is expected to garner significant business opportunities for the vendors during the forecast period.

              US, China, Japan, Germany, India

              • Modernization of existing transformersFactors such as the increase in the installation of new transformers and the replacement of old transformers with new ones are fueling the growth of the global electrical bushing market. Most of the T and D infrastructure globally needs renovation is the driving factor this market.
              • mainly because the existing networks are unable to meet the growth in the demand for power. There is a need to replace the old systems with new ones is the driving factor this market.
              • as well as a need to expand the existing infrastructure. In India is the driving factor this market.
              • the central government is funding the states under the Accelerated Power Development and Reform Programme (APDRP) scheme to help state electricity boards reduce their losses. Such factors are expected to drive the demand for power transformers across the regions during the forecast period. Smart grid networks are also being increasingly used in many countries. A smart grid refers to an electricity network that delivers an economical is the driving factor this market.
              • sustainable is the driving factor this market.
              • and secure electricity supply by intelligently integrating the actions of all users is the driving factor this market.
              • whether they are consumers is the driving factor this market.
              • generators is the driving factor this market.
              • or those capable of both in an efficient manner. The use of innovative products and services is the driving factor this market.
              • along with intelligent metering is the driving factor this market.
              • monitoring is the driving factor this market.
              • control is the driving factor this market.
              • communication is the driving factor this market.
              • and self-healing technologies is the driving factor this market.
              • enables a smart grid system to perform a variety of roles. The use of smart grid systems has enabled utilities to focus on the installation of more power transformers for the effective transmission of electric power. Thus is the driving factor this market.
              • the need for transformer oil is also increasing is the driving factor this market.
              • with more transformers being installed into the grid. Therefore is the driving factor this market.
              • the rise in the installation of new transformers will lead to significant growth in the global electrical bushing market during the forecast period. is the driving factor this market.

              The Electrical Bushing market vendors should focus on grabbing business opportunities from the Oil impregnated paper segment as it accounted for the largest market share in the base year.