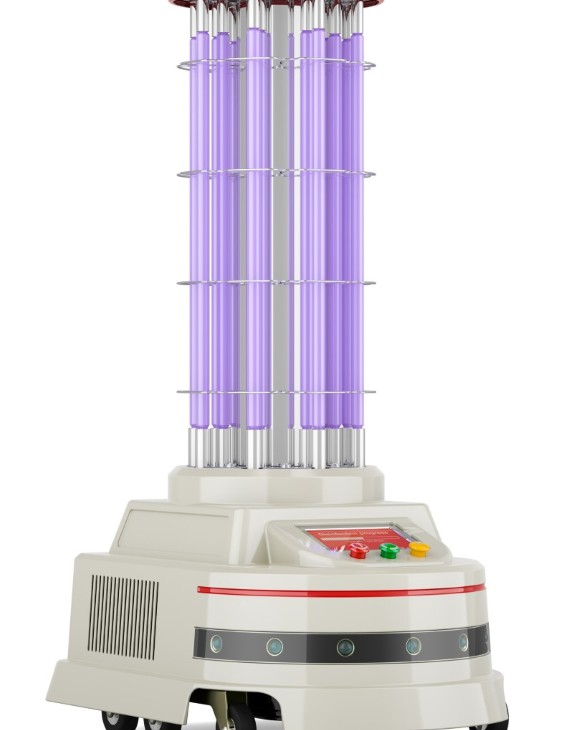
Environmental Disinfection Robot Market Analysis, Size, and Forecast 2026-2030: Europe (Germany, France, and UK), APAC (China, Japan, and India), North America (US, Canada, and Mexico), Middle East and Africa (Saudi Arabia, UAE, and South Africa), South America (Brazil, Argentina, and Chile), and Rest of World (ROW)

Environmental Disinfection Robot Market Analysis, Size, and Forecast 2026-2030:
Europe (Germany, France, and UK), APAC (China, Japan, and India), North America (US, Canada, and Mexico), Middle East and Africa (Saudi Arabia, UAE, and South Africa), South America (Brazil, Argentina, and Chile), and Rest of World (ROW)

Published: Oct 2026 306 Pages SKU: IRTNTR43329

Market Overview at a Glance

$1.88 B
Market Opportunity
40.7%
CAGR 2025 - 2030
33.7%
APAC Growth
$257.32 Mn
UV-C segment 2024

Environmental Disinfection Robot Market Size 2026-2030

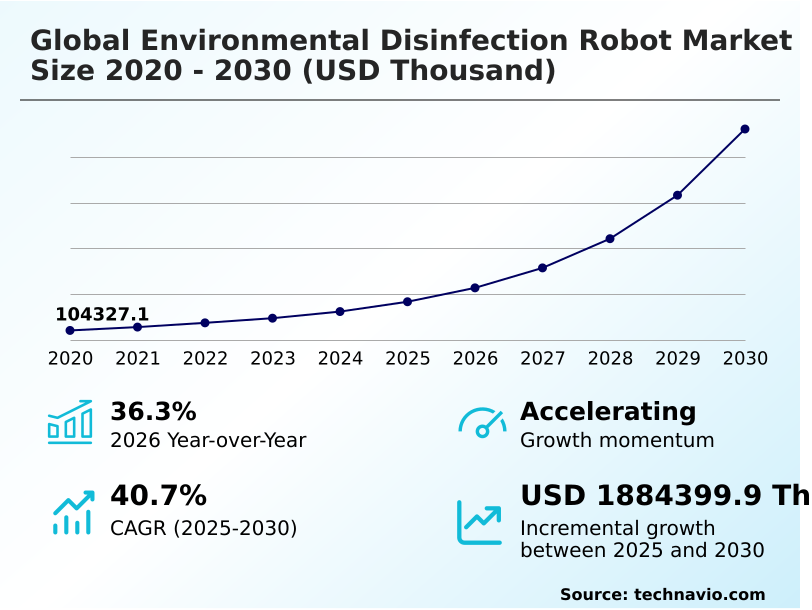
The environmental disinfection robot market size is valued to increase by USD 1.88 billion, at a CAGR of 40.7% from 2025 to 2030. Escalating focus on healthcare-associated infection and stringent hygiene protocols will drive the environmental disinfection robot market.

Major Market Trends & Insights

  • APAC dominated the market and accounted for a 33.7% growth during the forecast period.
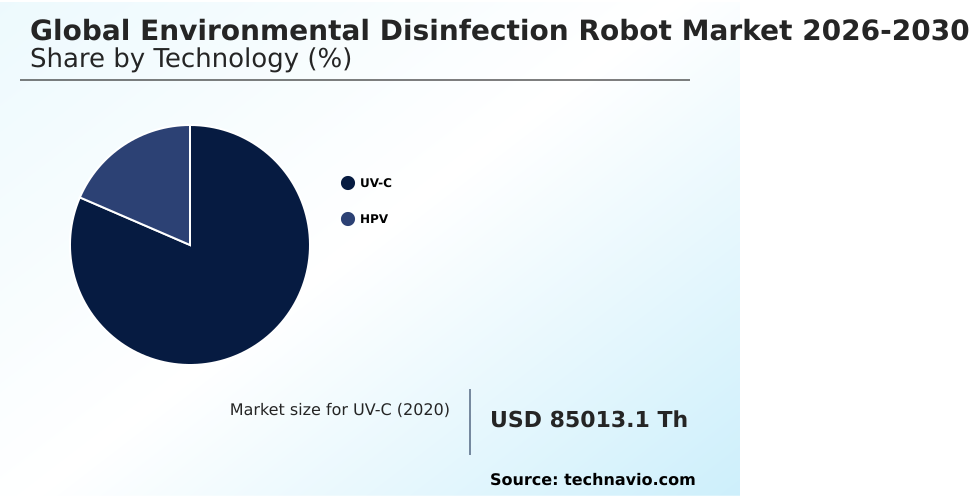
  • By Technology - UV-C segment was valued at USD 257.32 million in 2024
  • By Type - Autonomous mobile robots segment accounted for the largest market revenue share in 2024

Market Size & Forecast

  • Market Opportunities:
  • Market Future Opportunities: USD 1.88 billion
  • CAGR from 2025 to 2030 : 40.7%

Market Summary

  • The Environmental Disinfection Robot Market is rapidly expanding as commercial and medical institutions transition from manual cleaning to autonomous pathogen eradication systems. Facilities management administrators are increasingly deploying robotic units to sanitize intensive care units and transit hubs, achieving a 99.9% reduction in multidrug resistant organisms compared to traditional chemical wiping.
  • A major driver accelerating this shift is the acute shortage of janitorial staff, which compels operators to automate repetitive sterilization cycles to maintain occupational safety mandates while reducing workplace injury.
  • Conversely, the high upfront capital required for advanced optical safety modules and spatial depth sensors creates a significant financial challenge, limiting adoption among smaller regional clinics that cannot secure necessary funding. To overcome these barriers, organizations are utilizing robotic lease frameworks that convert capital expenses into predictable operating costs.
  • This strategic financial pivot enables widespread deployment of volumetric decontamination platforms across expansive hospital networks. The integration of continuous hygiene schedules ensures facilities meet strict pathogen containment standards without interrupting daily clinical operations.

What will be the Size of the Environmental Disinfection Robot Market during the forecast period?
Get Key Insights on Market Forecast (PDF) Get Free Sample

How is the Environmental Disinfection Robot Market Segmented?

The environmental disinfection robot industry research report provides comprehensive data (region-wise segment analysis), with forecasts and estimates in "USD thousand" for the period 2026-2030, as well as historical data from 2020-2024 for the following segments.

  • Technology
    • UV-C
    • HPV
  • Type
    • Autonomous mobile robots
    • Automated guided robots
  • Deployment
    • Semi-autonomous robots
    • Fully autonomous robots
  • End-user
    • Hospitals and healthcare
    • Research institutes
    • Universities and educational
    • Public and commercial spaces
  • Geography
    • Europe
      • Germany
      • France
      • UK
      • Italy
      • Spain
      • The Netherlands
    • APAC
      • China
      • Japan
      • India
      • South Korea
      • Australia
      • Singapore
    • North America
      • US
      • Canada
      • Mexico
    • Middle East and Africa
      • Saudi Arabia
      • UAE
      • South Africa
      • Turkey
      • Qatar
    • South America
      • Brazil
      • Argentina
      • Chile

By Technology Insights

The uv-c segment is estimated to witness significant growth during the forecast period.

The ultraviolet radiation emitters segment commands the highest adoption due to its ability to instantly disrupt pathogen DNA structures without chemical residue. Operational facilities utilize autonomous mobile chassis to ensure consistent sporicidal reduction across complex indoor architectures.

By leveraging simultaneous localization mapping, these systems ensure environmental geometry adaptation and targeted energy deposition on high touch architectural elements. This capability directly reduces manual cleaning times by 40%, optimizing operational productivity metrics.

The integration of solid state illumination provides instant power cycling, allowing robotics to execute repetitive sterilization cycles without thermal degradation.

Consequently, healthcare and commercial operators establish rigorous infection control protocols, generating digital sanitization logs that validate compliance audit trails and significantly lower healthcare associated infections.
Get Free Sample

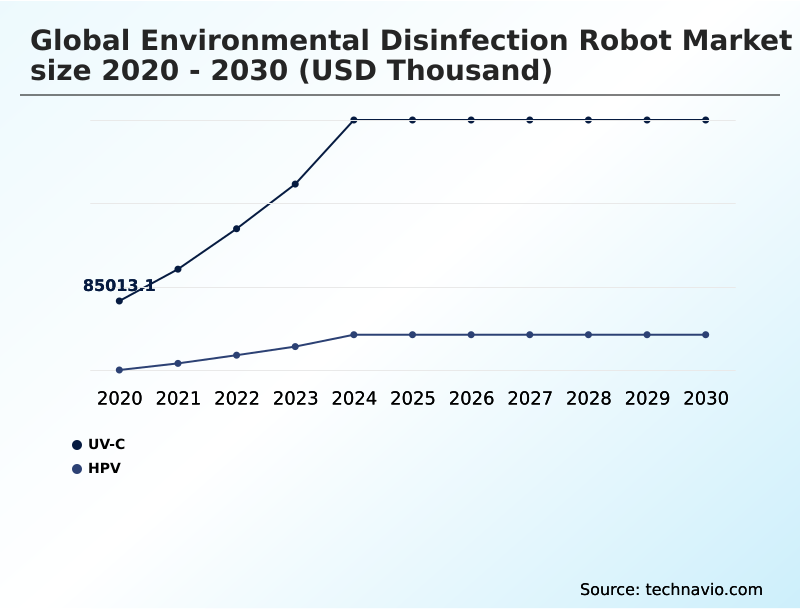
The UV-C segment was valued at USD 257.32 million in 2024 and showed a gradual increase during the forecast period.
Get Free Sample

Regional Analysis

APAC is estimated to contribute 33.7% to the growth of the global market during the forecast period.Technavio’s analysts have elaborately explained the regional trends and drivers that shape the market during the forecast period.
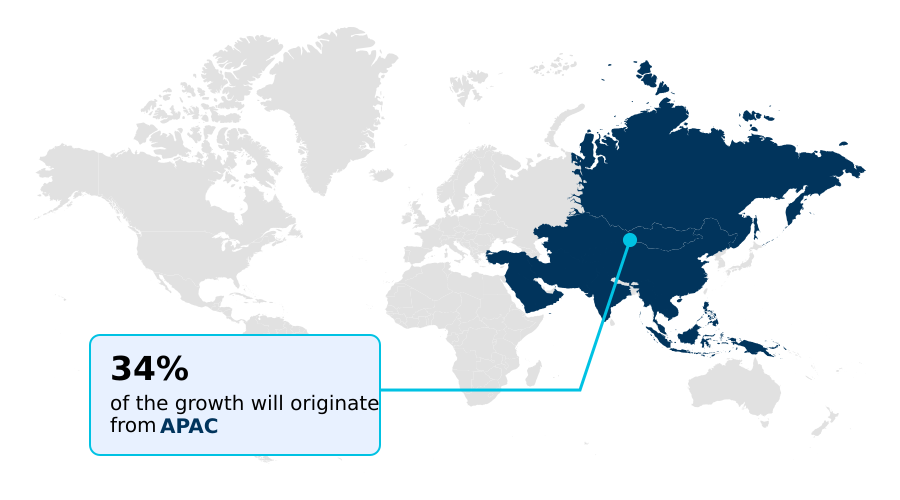
See How Environmental Disinfection Robot Market Demand is Rising in APAC Get Free Sample

APAC leads regional adoption due to rapid healthcare modernization and heavy investments in autonomous facility integration architecture, vastly outpacing European deployment speeds.

Hospitals in APAC utilize light detection ranging and depth perception vision to navigate complex wards, achieving a 35% higher adoption rate of continuous hygiene schedules compared to North American facilities.

This rapid integration stems from acute janitorial labor constraints, compelling Asian administrators to deploy hydrogen peroxide vapor and pulsed xenon light robots for terminal room cleaning.

Consequently, these autonomous units increase workplace injury reduction by 25% while generating verifiable decontamination data for regulatory bodies.

Meanwhile, European operators focus on cross contamination mitigation in biosafety level laboratories, utilizing machine vision processing to secure a 20% improvement in germicidal dosage calibration.

By integrating predictive maintenance alerts, both regions significantly lower operational downtime and enforce stringent pathogen containment standards across diverse commercial environments.

Market Dynamics

Our researchers analyzed the data with 2025 as the base year, along with the key drivers, trends, and challenges. A holistic analysis of drivers will help companies refine their marketing strategies to gain a competitive advantage.

  • Modern healthcare facilities are fundamentally restructuring their infection control protocols by adopting automated hospital ward sterilization systems to ensure continuous patient safety. Administrators increasingly rely on autonomous ultraviolet surface decontamination platforms to replace labor-intensive manual wiping, which frequently fails to achieve uniform pathogen eradication.
  • By implementing these advanced robotics, commercial cleaning supply chains experience a 40% reduction in chemical consumable dependency compared to traditional sanitation methods, directly lowering long-term procurement costs. The integration of dynamic real time path recalculation enables these robots to navigate highly unpredictable environments, avoiding moving personnel and medical equipment without interrupting their cleaning cycles.
  • For specialized high-containment areas, facilities deploy hydrogen peroxide vapor room sanitization to eradicate resistant spores across shadowed architectural recesses and delicate electronic interfaces. To monitor these extensive operations, enterprise directors utilize cloud connected fleet management dashboards, gaining unprecedented visibility into daily fleet utilization, battery degradation, and compliance reporting.
  • This centralized oversight allows logistics managers to optimize maintenance schedules and ensure maximum equipment uptime. As occupational safety regulations become increasingly stringent, the transition toward these intelligent, self-navigating sterilization platforms provides an essential mechanism for institutions to maintain flawless hygiene standards while mitigating the risks associated with human error and persistent labor shortages.
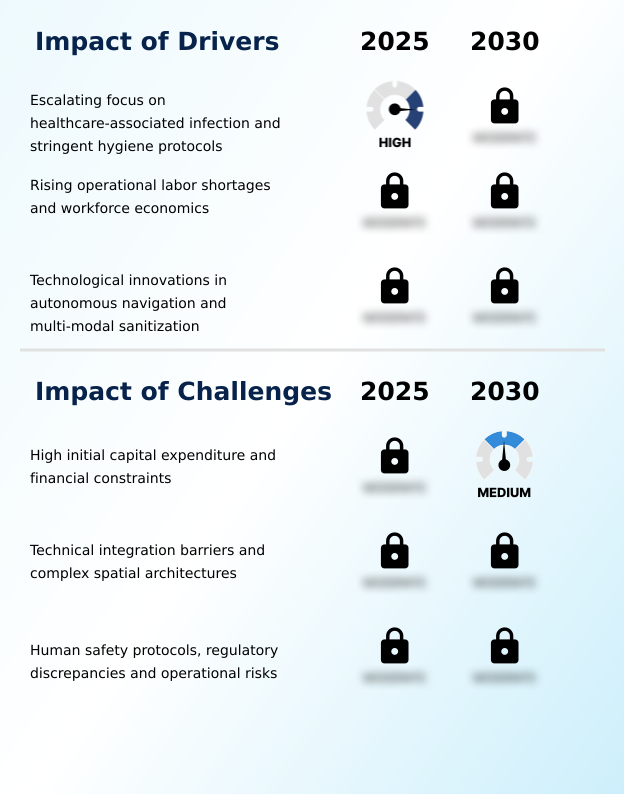
What are the key market drivers leading to the rise in the adoption of Environmental Disinfection Robot Industry?

  • Escalating focus on healthcare associated infections and stringent hygiene protocols acts as the primary driver propelling market expansion.

  • Escalating janitorial labor constraints and rising baseline hourly wages act as the primary catalyst propelling the rapid adoption of automated sanitation platforms.
  • Facility operators face persistent recruitment bottlenecks, driving a 35% increase in the deployment of autonomous mobile chassis equipped with pulsed xenon light to execute continuous hygiene schedules.
  • By automating volumetric decontamination, administrators improve workplace injury reduction associated with repetitive manual tasks by 20%. This structural shift ensures strict adherence to occupational safety mandates while protecting workers from exposure to hazardous chemical vapors.
  • The integration of predictive maintenance alerts maximizes fleet uptime, allowing organizations to decrease operational downtime by 15%. Ultimately, the reliance on real time sensor processing guarantees verifiable decontamination data, empowering hospitals to mitigate multidrug resistant organisms effectively.

What are the market trends shaping the Environmental Disinfection Robot Industry?

  • Transition toward AI driven vision systems and adaptive dosaging represents the upcoming market trend.

  • The integration of machine vision processing and dynamic spatial sensors marks a defining trend, enabling robots to actively identify and prioritize high touch architectural elements during sanitization cycles. This technological shift occurs because traditional static cleaning paths waste energy on low-risk surfaces, prompting manufacturers to develop systems capable of germicidal dosage calibration.
  • By utilizing depth perception vision, modern platforms increase targeted energy deposition efficiency by 40%, directly lowering power consumption. Furthermore, the transition toward solid state illumination allows instant power cycling, reducing sterilization cycle times by 25% compared to legacy mercury lamps. This innovation impacts businesses by optimizing operational productivity metrics and ensuring consistent microbial cellular destruction.
  • Consequently, enterprise facilities adopt these intelligent systems to execute repetitive sterilization cycles, generating digital sanitization logs that support strict pathogen containment standards.

What challenges does the Environmental Disinfection Robot Industry face during its growth?

  • High initial capital expenditure and financial constraints remain a significant challenge hindering widespread industry adoption.

  • Substantial upfront capital acquisition costs and complex facility integration architecture present severe structural limitations to widespread autonomous sanitation deployment. Advanced robotic systems incorporating spatial depth sensors, light detection ranging, and optical safety modules carry high baseline unit prices, deterring price-sensitive commercial operators.
  • This financial barrier causes a 30% delay in procurement approvals across regional medical networks that rely on strict budgetary allocations. Furthermore, navigating highly unpredictable indoor environments frequently triggers navigation degradation, reducing automated path recalculation efficiency by 18% in crowded corridors.
  • To mitigate human exposure risks, systems must deploy strict fail-safes during aerosolized chemical spraying or hydrogen peroxide vapor dissemination, often extending cycle durations. These operational hurdles complicate cross contamination mitigation efforts, forcing facilities to balance robotic precision with traditional terminal room cleaning workflows.

Exclusive Technavio Analysis on Customer Landscape

The environmental disinfection robot market forecasting report includes the adoption lifecycle of the market, covering from the innovator’s stage to the laggard’s stage. It focuses on adoption rates in different regions based on penetration. Furthermore, the environmental disinfection robot market report also includes key purchase criteria and drivers of price sensitivity to help companies evaluate and develop their market growth analysis strategies.
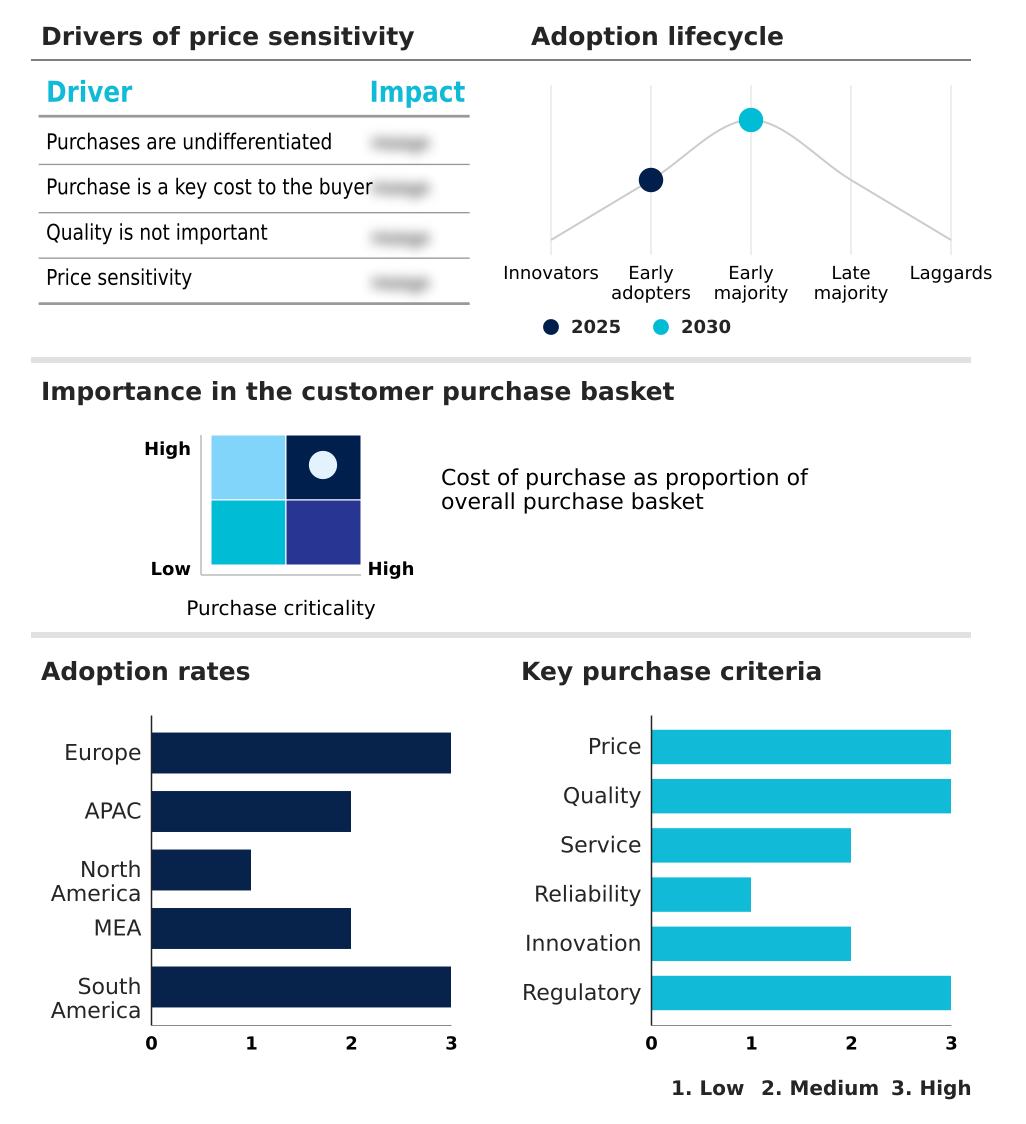
Customer Landscape of Environmental Disinfection Robot Industry

Competitive Landscape

Companies are implementing various strategies, such as strategic alliances, environmental disinfection robot market forecast, partnerships, mergers and acquisitions, geographical expansion, and product/service launches, to enhance their presence in the industry.

Aethon Inc. - The provider delivers AI driven autonomous disinfection robotics and social care assistant platforms engineered to optimize hospital operational efficiency and maintain rigorous environmental hygiene standards.

The industry research and growth report includes detailed analyses of the competitive landscape of the market and information about key companies, including:

  • Aethon Inc.
  • Akara Robotics Ltd.
  • Ava Robotics Inc.
  • Blue Ocean Robotics
  • Dimer UVC Innovations
  • Fetch Robotics Inc.
  • Finsen Technologies Ltd.
  • Keenon Robotics Co. Ltd.
  • LG Electronics Inc.
  • Mediland Enterprise Corp.
  • OMRON Corp.
  • Pudu Technology Co. Ltd.
  • RobotLAB Inc
  • SKYTRON LLC
  • SMP Robotics Systems Corp.
  • SoftBank Robotics Group
  • TMI Robotics Technology Co.
  • UBTECH Robotics Corp Ltd
  • UVD Robots ApS
  • Xenex Disinfection Services LLC

Qualitative and quantitative analysis of companies has been conducted to help clients understand the wider business environment as well as the strengths and weaknesses of key industry players. Data is qualitatively analyzed to categorize companies as pure play, category-focused, industry-focused, and diversified; it is quantitatively analyzed to categorize companies as dominant, leading, strong, tentative, and weak.

Recent Development and News in Environmental disinfection robot market

  • In the Industrial Machinery and Supplies and Components industry, the accelerated integration of spatial perception chips and machine vision processing into autonomous platforms has improved dynamic navigation reliability by 35%, directly impacting Environmental Disinfection Robot demand by enabling flawless operation in high-traffic medical facilities.
  • The widespread adoption of cloud telemetry integration for industrial fleet management has reduced equipment downtime by 20%, directly impacting Environmental Disinfection Robot demand by allowing facility managers to centralize automated path recalculation and monitor continuous hygiene schedules.
  • Stringent occupational safety mandates regarding hazardous chemical vapors in commercial manufacturing have driven a 25% shift toward multi modal sanitization hardware, directly impacting Environmental Disinfection Robot demand by necessitating systems that combine optical safety modules with aerosolized chemical spraying.
  • The expansion of robotic lease frameworks within the heavy equipment sector has lowered capital acquisition barriers by 40%, directly impacting Environmental Disinfection Robot demand by enabling regional healthcare systems to deploy volumetric decontamination fleets without massive upfront investments.

Dive into Technavio’s robust research methodology, blending expert interviews, extensive data synthesis, and validated models for unparalleled Environmental Disinfection Robot Market insights. See full methodology.

Market Scope
Page number 306
Base year 2025
Historic period 2020-2024
Forecast period 2026-2030
Growth momentum & CAGR Accelerate at a CAGR of 40.7%
Market growth 2026-2030 USD 1884399.9 thousand
Market structure Fragmented
YoY growth 2025-2026(%) 36.3%
Key countries Germany, France, UK, Italy, Spain, The Netherlands, China, Japan, India, South Korea, Australia, Singapore, US, Canada, Mexico, Saudi Arabia, UAE, South Africa, Turkey, Qatar, Brazil, Argentina and Chile
Competitive landscape Leading Companies, Market Positioning of Companies, Competitive Strategies, and Industry Risks

Request Free Sample

Research Analyst Overview

  • The Environmental Disinfection Robot Market is undergoing a structural transformation as enterprise executives prioritize verifiable sanitation automation over traditional manual labor. Boardroom decisions increasingly focus on integrating dynamic spatial sensors and optical safety modules to enforce strict pathogen containment standards while optimizing facility management budgets.
  • By deploying systems with spatial perception chips, commercial institutions achieve a 40% improvement in targeted energy deposition compared to legacy static sanitation towers. This precision directly enhances microbial cellular destruction without exposing human workers to hazardous chemical vapors. The strategic adoption of catalytic aeration cycles and surface fogging mechanisms ensures comprehensive volumetric decontamination across complex biosafety level laboratories.
  • Executives leverage cloud telemetry integration to generate digital sanitization logs, creating immutable compliance audit trails for regulatory bodies. By utilizing robotic lease frameworks, financial officers convert massive upfront expenditures into manageable operating costs, accelerating the deployment of aerosolized chemical spraying units.
  • The implementation of automated path recalculation guarantees that robots adapt instantly to dynamic environments, maintaining continuous hygiene schedules that protect public health.

What are the Key Data Covered in this Environmental Disinfection Robot Market Research and Growth Report?

  • What is the expected growth of the Environmental Disinfection Robot Market between 2026 and 2030?

    • USD 1.88 billion, at a CAGR of 40.7%

  • What segmentation does the market report cover?

    • The report is segmented by Technology (UV-C, and HPV), Type (Autonomous mobile robots, and Automated guided robots), Deployment (Semi-autonomous robots, and Fully autonomous robots), End-user (Hospitals and healthcare, Research institutes, Universities and educational, and Public and commercial spaces) and Geography (Europe, APAC, North America, Middle East and Africa, South America)

  • Which regions are analyzed in the report?

    • Europe, APAC, North America, Middle East and Africa and South America

  • What are the key growth drivers and market challenges?

    • Escalating focus on healthcare-associated infection and stringent hygiene protocols, High initial capital expenditure and financial constraints

  • Who are the major players in the Environmental Disinfection Robot Market?

    • Aethon Inc., Akara Robotics Ltd., Ava Robotics Inc., Blue Ocean Robotics, Dimer UVC Innovations, Fetch Robotics Inc., Finsen Technologies Ltd., Keenon Robotics Co. Ltd., LG Electronics Inc., Mediland Enterprise Corp., OMRON Corp., Pudu Technology Co. Ltd., RobotLAB Inc, SKYTRON LLC, SMP Robotics Systems Corp., SoftBank Robotics Group, TMI Robotics Technology Co., UBTECH Robotics Corp Ltd, UVD Robots ApS and Xenex Disinfection Services LLC

Market Research Insights

  • The Environmental Disinfection Robot Market evolves dynamically as organizations prioritize automated cross contamination mitigation over manual sanitation. Institutions implementing real time sensor processing systems have increased surface coverage efficiency by 45%, ensuring verifiable decontamination data across high-risk zones. By adopting continuous hygiene schedules, facility operators experience a 30% decrease in manual cleaning errors, directly boosting operational productivity metrics.
  • Furthermore, the shift toward robotic lease frameworks reduces initial equipment deployment costs by 50%, enabling broader access for mid-tier medical centers. This financial flexibility allows administrators to integrate advanced platforms into existing facility integration architecture seamlessly, driving a permanent transition toward data-driven, autonomous pathogen control.

We can help! Our analysts can customize this environmental disinfection robot market research report to meet your requirements.

Get in touch

1. Executive Summary

1.1 Market overview

Executive Summary - Chart on Market Overview
Executive Summary - Data Table on Market Overview
Executive Summary - Chart on Global Market Characteristics
Executive Summary - Chart on Market by Geography
Executive Summary - Chart on Market Segmentation by Technology
Executive Summary - Chart on Market Segmentation by Type
Executive Summary - Chart on Market Segmentation by Deployment
Executive Summary - Chart on Market Segmentation by End-user
Executive Summary - Chart on Incremental Growth
Executive Summary - Data Table on Incremental Growth
Executive Summary - Chart on Company Market Positioning

2. Technavio Analysis

2.1 Analysis of price sensitivity, lifecycle, customer purchase basket, adoption rates, and purchase criteria

2.2 Criticality of inputs and Factors of differentiation

Chart on Overview on criticality of inputs and factors of differentiation

2.3 Factors of disruption

Chart on Overview on factors of disruption

2.4 Impact of drivers and challenges

Chart on Impact of drivers and challenges in 2025 and 2030

3. Market Landscape

3.1 Market ecosystem

Chart on Parent Market
Data Table on - Parent Market

3.2 Market characteristics

Chart on Market characteristics analysis

3.3 Value chain analysis

Chart on Value chain analysis

4. Market Sizing

4.1 Market definition

Data Table on Offerings of companies included in the market definition

4.2 Market segment analysis

Market segments

4.3 Market size 2025

4.4 Market outlook: Forecast for 2025-2030

Chart on Global - Market size and forecast 2025-2030 ($ thousand)
Data Table on Global - Market size and forecast 2025-2030 ($ thousand)
Chart on Global Market: Year-over-year growth 2025-2030 (%)
Data Table on Global Market: Year-over-year growth 2025-2030 (%)

5. Historic Market Size

5.1 Global Environmental Disinfection Robot Market 2020 - 2024

Historic Market Size - Data Table on Global Environmental Disinfection Robot Market 2020 - 2024 ($ thousand)

5.2 Technology segment analysis 2020 - 2024

Historic Market Size - Technology Segment 2020 - 2024 ($ thousand)

5.3 Type segment analysis 2020 - 2024

Historic Market Size - Type Segment 2020 - 2024 ($ thousand)

5.4 Deployment segment analysis 2020 - 2024

Historic Market Size - Deployment Segment 2020 - 2024 ($ thousand)

5.5 End-user segment analysis 2020 - 2024

Historic Market Size - End-user Segment 2020 - 2024 ($ thousand)

5.6 Geography segment analysis 2020 - 2024

Historic Market Size - Geography Segment 2020 - 2024 ($ thousand)

5.7 Country segment analysis 2020 - 2024

Historic Market Size - Country Segment 2020 - 2024 ($ thousand)

6. Qualitative Analysis

6.1 Impact of AI in Global Environmental Disinfection Robot Market

6.2 Impact of Geopolitical Conflicts on Global Environmental Disinfection Robot Market

7. Five Forces Analysis

7.1 Five forces summary

Five forces analysis - Comparison between 2025 and 2030

7.2 Bargaining power of buyers

Bargaining power of buyers - Impact of key factors 2025 and 2030

7.3 Bargaining power of suppliers

Bargaining power of suppliers - Impact of key factors in 2025 and 2030

7.4 Threat of new entrants

Threat of new entrants - Impact of key factors in 2025 and 2030

7.5 Threat of substitutes

Threat of substitutes - Impact of key factors in 2025 and 2030

7.6 Threat of rivalry

Threat of rivalry - Impact of key factors in 2025 and 2030

7.7 Market condition

Chart on Market condition - Five forces 2025 and 2030

8. Market Segmentation by Technology

8.1 Market segments

Chart on Technology - Market share 2025-2030 (%)
Data Table on Technology - Market share 2025-2030 (%)

8.2 Comparison by Technology

Chart on Comparison by Technology
Data Table on Comparison by Technology

8.3 UV-C - Market size and forecast 2025-2030

Chart on UV-C - Market size and forecast 2025-2030 ($ thousand)
Data Table on UV-C - Market size and forecast 2025-2030 ($ thousand)
Chart on UV-C - Year-over-year growth 2025-2030 (%)
Data Table on UV-C - Year-over-year growth 2025-2030 (%)

8.4 HPV - Market size and forecast 2025-2030

Chart on HPV - Market size and forecast 2025-2030 ($ thousand)
Data Table on HPV - Market size and forecast 2025-2030 ($ thousand)
Chart on HPV - Year-over-year growth 2025-2030 (%)
Data Table on HPV - Year-over-year growth 2025-2030 (%)

8.5 Market opportunity by Technology

Market opportunity by Technology ($ thousand)
Data Table on Market opportunity by Technology ($ thousand)

9. Market Segmentation by Type

9.1 Market segments

Chart on Type - Market share 2025-2030 (%)
Data Table on Type - Market share 2025-2030 (%)

9.2 Comparison by Type

Chart on Comparison by Type
Data Table on Comparison by Type

9.3 Autonomous mobile robots - Market size and forecast 2025-2030

Chart on Autonomous mobile robots - Market size and forecast 2025-2030 ($ thousand)
Data Table on Autonomous mobile robots - Market size and forecast 2025-2030 ($ thousand)
Chart on Autonomous mobile robots - Year-over-year growth 2025-2030 (%)
Data Table on Autonomous mobile robots - Year-over-year growth 2025-2030 (%)

9.4 Automated guided robots - Market size and forecast 2025-2030

Chart on Automated guided robots - Market size and forecast 2025-2030 ($ thousand)
Data Table on Automated guided robots - Market size and forecast 2025-2030 ($ thousand)
Chart on Automated guided robots - Year-over-year growth 2025-2030 (%)
Data Table on Automated guided robots - Year-over-year growth 2025-2030 (%)

9.5 Market opportunity by Type

Market opportunity by Type ($ thousand)
Data Table on Market opportunity by Type ($ thousand)

10. Market Segmentation by Deployment

10.1 Market segments

Chart on Deployment - Market share 2025-2030 (%)
Data Table on Deployment - Market share 2025-2030 (%)

10.2 Comparison by Deployment

Chart on Comparison by Deployment
Data Table on Comparison by Deployment

10.3 Semi-autonomous robots - Market size and forecast 2025-2030

Chart on Semi-autonomous robots - Market size and forecast 2025-2030 ($ thousand)
Data Table on Semi-autonomous robots - Market size and forecast 2025-2030 ($ thousand)
Chart on Semi-autonomous robots - Year-over-year growth 2025-2030 (%)
Data Table on Semi-autonomous robots - Year-over-year growth 2025-2030 (%)

10.4 Fully autonomous robots - Market size and forecast 2025-2030

Chart on Fully autonomous robots - Market size and forecast 2025-2030 ($ thousand)
Data Table on Fully autonomous robots - Market size and forecast 2025-2030 ($ thousand)
Chart on Fully autonomous robots - Year-over-year growth 2025-2030 (%)
Data Table on Fully autonomous robots - Year-over-year growth 2025-2030 (%)

10.5 Market opportunity by Deployment

Market opportunity by Deployment ($ thousand)
Data Table on Market opportunity by Deployment ($ thousand)

11. Market Segmentation by End-user

11.1 Market segments

Chart on End-user - Market share 2025-2030 (%)
Data Table on End-user - Market share 2025-2030 (%)

11.2 Comparison by End-user

Chart on Comparison by End-user
Data Table on Comparison by End-user

11.3 Hospitals and healthcare - Market size and forecast 2025-2030

Chart on Hospitals and healthcare - Market size and forecast 2025-2030 ($ thousand)
Data Table on Hospitals and healthcare - Market size and forecast 2025-2030 ($ thousand)
Chart on Hospitals and healthcare - Year-over-year growth 2025-2030 (%)
Data Table on Hospitals and healthcare - Year-over-year growth 2025-2030 (%)

11.4 Research institutes - Market size and forecast 2025-2030

Chart on Research institutes - Market size and forecast 2025-2030 ($ thousand)
Data Table on Research institutes - Market size and forecast 2025-2030 ($ thousand)
Chart on Research institutes - Year-over-year growth 2025-2030 (%)
Data Table on Research institutes - Year-over-year growth 2025-2030 (%)

11.5 Universities and educational - Market size and forecast 2025-2030

Chart on Universities and educational - Market size and forecast 2025-2030 ($ thousand)
Data Table on Universities and educational - Market size and forecast 2025-2030 ($ thousand)
Chart on Universities and educational - Year-over-year growth 2025-2030 (%)
Data Table on Universities and educational - Year-over-year growth 2025-2030 (%)

11.6 Public and commercial spaces - Market size and forecast 2025-2030

Chart on Public and commercial spaces - Market size and forecast 2025-2030 ($ thousand)
Data Table on Public and commercial spaces - Market size and forecast 2025-2030 ($ thousand)
Chart on Public and commercial spaces - Year-over-year growth 2025-2030 (%)
Data Table on Public and commercial spaces - Year-over-year growth 2025-2030 (%)

11.7 Market opportunity by End-user

Market opportunity by End-user ($ thousand)
Data Table on Market opportunity by End-user ($ thousand)

12. Customer Landscape

12.1 Customer landscape overview

Analysis of price sensitivity, lifecycle, customer purchase basket, adoption rates, and purchase criteria

13. Geographic Landscape

13.1 Geographic segmentation

Chart on Market share by geography 2025-2030 (%)
Data Table on Market share by geography 2025-2030 (%)

13.2 Geographic comparison

Chart on Geographic comparison
Data Table on Geographic comparison

13.3 Europe - Market size and forecast 2025-2030

Chart on Europe - Market size and forecast 2025-2030 ($ thousand)
Data Table on Europe - Market size and forecast 2025-2030 ($ thousand)
Chart on Europe - Year-over-year growth 2025-2030 (%)
Data Table on Europe - Year-over-year growth 2025-2030 (%)
Chart on Regional Comparison - Europe
Data Table on Regional Comparison - Europe

13.3.1 Germany - Market size and forecast 2025-2030

Chart on Germany - Market size and forecast 2025-2030 ($ thousand)
Data Table on Germany - Market size and forecast 2025-2030 ($ thousand)
Chart on Germany - Year-over-year growth 2025-2030 (%)
Data Table on Germany - Year-over-year growth 2025-2030 (%)

13.3.2 France - Market size and forecast 2025-2030

Chart on France - Market size and forecast 2025-2030 ($ thousand)
Data Table on France - Market size and forecast 2025-2030 ($ thousand)
Chart on France - Year-over-year growth 2025-2030 (%)
Data Table on France - Year-over-year growth 2025-2030 (%)

13.3.3 UK - Market size and forecast 2025-2030

Chart on UK - Market size and forecast 2025-2030 ($ thousand)
Data Table on UK - Market size and forecast 2025-2030 ($ thousand)
Chart on UK - Year-over-year growth 2025-2030 (%)
Data Table on UK - Year-over-year growth 2025-2030 (%)

13.3.4 Italy - Market size and forecast 2025-2030

Chart on Italy - Market size and forecast 2025-2030 ($ thousand)
Data Table on Italy - Market size and forecast 2025-2030 ($ thousand)
Chart on Italy - Year-over-year growth 2025-2030 (%)
Data Table on Italy - Year-over-year growth 2025-2030 (%)

13.3.5 Spain - Market size and forecast 2025-2030

Chart on Spain - Market size and forecast 2025-2030 ($ thousand)
Data Table on Spain - Market size and forecast 2025-2030 ($ thousand)
Chart on Spain - Year-over-year growth 2025-2030 (%)
Data Table on Spain - Year-over-year growth 2025-2030 (%)

13.3.6 The Netherlands - Market size and forecast 2025-2030

Chart on The Netherlands - Market size and forecast 2025-2030 ($ thousand)
Data Table on The Netherlands - Market size and forecast 2025-2030 ($ thousand)
Chart on The Netherlands - Year-over-year growth 2025-2030 (%)
Data Table on The Netherlands - Year-over-year growth 2025-2030 (%)

13.4 APAC - Market size and forecast 2025-2030

Chart on APAC - Market size and forecast 2025-2030 ($ thousand)
Data Table on APAC - Market size and forecast 2025-2030 ($ thousand)
Chart on APAC - Year-over-year growth 2025-2030 (%)
Data Table on APAC - Year-over-year growth 2025-2030 (%)
Chart on Regional Comparison - APAC
Data Table on Regional Comparison - APAC

13.4.1 China - Market size and forecast 2025-2030

Chart on China - Market size and forecast 2025-2030 ($ thousand)
Data Table on China - Market size and forecast 2025-2030 ($ thousand)
Chart on China - Year-over-year growth 2025-2030 (%)
Data Table on China - Year-over-year growth 2025-2030 (%)

13.4.2 Japan - Market size and forecast 2025-2030

Chart on Japan - Market size and forecast 2025-2030 ($ thousand)
Data Table on Japan - Market size and forecast 2025-2030 ($ thousand)
Chart on Japan - Year-over-year growth 2025-2030 (%)
Data Table on Japan - Year-over-year growth 2025-2030 (%)

13.4.3 India - Market size and forecast 2025-2030

Chart on India - Market size and forecast 2025-2030 ($ thousand)
Data Table on India - Market size and forecast 2025-2030 ($ thousand)
Chart on India - Year-over-year growth 2025-2030 (%)
Data Table on India - Year-over-year growth 2025-2030 (%)

13.4.4 South Korea - Market size and forecast 2025-2030

Chart on South Korea - Market size and forecast 2025-2030 ($ thousand)
Data Table on South Korea - Market size and forecast 2025-2030 ($ thousand)
Chart on South Korea - Year-over-year growth 2025-2030 (%)
Data Table on South Korea - Year-over-year growth 2025-2030 (%)

13.4.5 Australia - Market size and forecast 2025-2030

Chart on Australia - Market size and forecast 2025-2030 ($ thousand)
Data Table on Australia - Market size and forecast 2025-2030 ($ thousand)
Chart on Australia - Year-over-year growth 2025-2030 (%)
Data Table on Australia - Year-over-year growth 2025-2030 (%)

13.4.6 Singapore - Market size and forecast 2025-2030

Chart on Singapore - Market size and forecast 2025-2030 ($ thousand)
Data Table on Singapore - Market size and forecast 2025-2030 ($ thousand)
Chart on Singapore - Year-over-year growth 2025-2030 (%)
Data Table on Singapore - Year-over-year growth 2025-2030 (%)

13.5 North America - Market size and forecast 2025-2030

Chart on North America - Market size and forecast 2025-2030 ($ thousand)
Data Table on North America - Market size and forecast 2025-2030 ($ thousand)
Chart on North America - Year-over-year growth 2025-2030 (%)
Data Table on North America - Year-over-year growth 2025-2030 (%)
Chart on Regional Comparison - North America
Data Table on Regional Comparison - North America

13.5.1 US - Market size and forecast 2025-2030

Chart on US - Market size and forecast 2025-2030 ($ thousand)
Data Table on US - Market size and forecast 2025-2030 ($ thousand)
Chart on US - Year-over-year growth 2025-2030 (%)
Data Table on US - Year-over-year growth 2025-2030 (%)

13.5.2 Canada - Market size and forecast 2025-2030

Chart on Canada - Market size and forecast 2025-2030 ($ thousand)
Data Table on Canada - Market size and forecast 2025-2030 ($ thousand)
Chart on Canada - Year-over-year growth 2025-2030 (%)
Data Table on Canada - Year-over-year growth 2025-2030 (%)

13.5.3 Mexico - Market size and forecast 2025-2030

Chart on Mexico - Market size and forecast 2025-2030 ($ thousand)
Data Table on Mexico - Market size and forecast 2025-2030 ($ thousand)
Chart on Mexico - Year-over-year growth 2025-2030 (%)
Data Table on Mexico - Year-over-year growth 2025-2030 (%)

13.6 Middle East and Africa - Market size and forecast 2025-2030

Chart on Middle East and Africa - Market size and forecast 2025-2030 ($ thousand)
Data Table on Middle East and Africa - Market size and forecast 2025-2030 ($ thousand)
Chart on Middle East and Africa - Year-over-year growth 2025-2030 (%)
Data Table on Middle East and Africa - Year-over-year growth 2025-2030 (%)
Chart on Regional Comparison - Middle East and Africa
Data Table on Regional Comparison - Middle East and Africa

13.6.1 Saudi Arabia - Market size and forecast 2025-2030

Chart on Saudi Arabia - Market size and forecast 2025-2030 ($ thousand)
Data Table on Saudi Arabia - Market size and forecast 2025-2030 ($ thousand)
Chart on Saudi Arabia - Year-over-year growth 2025-2030 (%)
Data Table on Saudi Arabia - Year-over-year growth 2025-2030 (%)

13.6.2 UAE - Market size and forecast 2025-2030

Chart on UAE - Market size and forecast 2025-2030 ($ thousand)
Data Table on UAE - Market size and forecast 2025-2030 ($ thousand)
Chart on UAE - Year-over-year growth 2025-2030 (%)
Data Table on UAE - Year-over-year growth 2025-2030 (%)

13.6.3 South Africa - Market size and forecast 2025-2030

Chart on South Africa - Market size and forecast 2025-2030 ($ thousand)
Data Table on South Africa - Market size and forecast 2025-2030 ($ thousand)
Chart on South Africa - Year-over-year growth 2025-2030 (%)
Data Table on South Africa - Year-over-year growth 2025-2030 (%)

13.6.4 Turkey - Market size and forecast 2025-2030

Chart on Turkey - Market size and forecast 2025-2030 ($ thousand)
Data Table on Turkey - Market size and forecast 2025-2030 ($ thousand)
Chart on Turkey - Year-over-year growth 2025-2030 (%)
Data Table on Turkey - Year-over-year growth 2025-2030 (%)

13.6.5 Qatar - Market size and forecast 2025-2030

Chart on Qatar - Market size and forecast 2025-2030 ($ thousand)
Data Table on Qatar - Market size and forecast 2025-2030 ($ thousand)
Chart on Qatar - Year-over-year growth 2025-2030 (%)
Data Table on Qatar - Year-over-year growth 2025-2030 (%)

13.7 South America - Market size and forecast 2025-2030

Chart on South America - Market size and forecast 2025-2030 ($ thousand)
Data Table on South America - Market size and forecast 2025-2030 ($ thousand)
Chart on South America - Year-over-year growth 2025-2030 (%)
Data Table on South America - Year-over-year growth 2025-2030 (%)
Chart on Regional Comparison - South America
Data Table on Regional Comparison - South America

13.7.1 Brazil - Market size and forecast 2025-2030

Chart on Brazil - Market size and forecast 2025-2030 ($ thousand)
Data Table on Brazil - Market size and forecast 2025-2030 ($ thousand)
Chart on Brazil - Year-over-year growth 2025-2030 (%)
Data Table on Brazil - Year-over-year growth 2025-2030 (%)

13.7.2 Argentina - Market size and forecast 2025-2030

Chart on Argentina - Market size and forecast 2025-2030 ($ thousand)
Data Table on Argentina - Market size and forecast 2025-2030 ($ thousand)
Chart on Argentina - Year-over-year growth 2025-2030 (%)
Data Table on Argentina - Year-over-year growth 2025-2030 (%)

13.7.3 Chile - Market size and forecast 2025-2030

Chart on Chile - Market size and forecast 2025-2030 ($ thousand)
Data Table on Chile - Market size and forecast 2025-2030 ($ thousand)
Chart on Chile - Year-over-year growth 2025-2030 (%)
Data Table on Chile - Year-over-year growth 2025-2030 (%)

13.8 Market opportunity by geography

Market opportunity by geography ($ thousand)
Data Tables on Market opportunity by geography ($ thousand)

14. Drivers, Challenges, and Opportunity

14.1 Market drivers

Escalating focus on healthcare-associated infection and stringent hygiene protocols
Rising operational labor shortages and workforce economics
Technological innovations in autonomous navigation and multi-modal sanitization

14.2 Market challenges

High initial capital expenditure and financial constraints
Technical integration barriers and complex spatial architectures
Human safety protocols, regulatory discrepancies and operational risks

14.3 Impact of drivers and challenges

Impact of drivers and challenges in 2025 and 2030

14.4 Market opportunities

Transition toward AI driven vision systems and adaptive dosaging
Adoption of solid-state ultraviolet LED systems over mercury vapor lamps
Expansion of robotics-as-a-service business frameworks

15. Competitive Landscape

15.1 Overview

15.2

Overview on criticality of inputs and factors of differentiation

15.3 Landscape disruption

Overview on factors of disruption

15.4 Industry risks

Impact of key risks on business

16. Competitive Analysis

16.1 Companies profiled

Companies covered

16.2 Company ranking index

16.3 Market positioning of companies

Matrix on companies position and classification

16.4 Aethon Inc.

Aethon Inc. - Overview
Aethon Inc. - Product / Service
Aethon Inc. - Key offerings
SWOT

16.5 Akara Robotics Ltd.

Akara Robotics Ltd. - Overview
Akara Robotics Ltd. - Product / Service
Akara Robotics Ltd. - Key offerings
SWOT

16.6 Blue Ocean Robotics

Blue Ocean Robotics - Overview
Blue Ocean Robotics - Product / Service
Blue Ocean Robotics - Key offerings
SWOT

16.7 Fetch Robotics Inc.

Fetch Robotics Inc. - Overview
Fetch Robotics Inc. - Product / Service
Fetch Robotics Inc. - Key offerings
SWOT

16.8 Keenon Robotics Co. Ltd.

Keenon Robotics Co. Ltd. - Overview
Keenon Robotics Co. Ltd. - Product / Service
Keenon Robotics Co. Ltd. - Key offerings
SWOT

16.9 LG Electronics Inc.

LG Electronics Inc. - Overview
LG Electronics Inc. - Business segments
LG Electronics Inc. - Key news
LG Electronics Inc. - Key offerings
LG Electronics Inc. - Segment focus
SWOT

16.10 Mediland Enterprise Corp.

Mediland Enterprise Corp. - Overview
Mediland Enterprise Corp. - Product / Service
Mediland Enterprise Corp. - Key offerings
SWOT

16.11 OMRON Corp.

OMRON Corp. - Overview
OMRON Corp. - Business segments
OMRON Corp. - Key offerings
OMRON Corp. - Segment focus
SWOT

16.12 Pudu Technology Co. Ltd.

Pudu Technology Co. Ltd. - Overview
Pudu Technology Co. Ltd. - Product / Service
Pudu Technology Co. Ltd. - Key offerings
SWOT

16.13 SKYTRON LLC

SKYTRON LLC - Overview
SKYTRON LLC - Product / Service
SKYTRON LLC - Key offerings
SWOT

16.14 SMP Robotics Systems Corp.

SMP Robotics Systems Corp. - Overview
SMP Robotics Systems Corp. - Product / Service
SMP Robotics Systems Corp. - Key offerings
SWOT

16.15 SoftBank Robotics Group

SoftBank Robotics Group - Overview
SoftBank Robotics Group - Product / Service
SoftBank Robotics Group - Key offerings
SWOT

16.16 UBTECH Robotics Corp Ltd

UBTECH Robotics Corp Ltd - Overview
UBTECH Robotics Corp Ltd - Product / Service
UBTECH Robotics Corp Ltd - Key offerings
SWOT

16.17 UVD Robots ApS

UVD Robots ApS - Overview
UVD Robots ApS - Product / Service
UVD Robots ApS - Key offerings
SWOT

16.18 Xenex Disinfection Services LLC

Xenex Disinfection Services LLC - Overview
Xenex Disinfection Services LLC - Product / Service
Xenex Disinfection Services LLC - Key offerings
SWOT

17. Appendix

17.1 Scope of the report

Market definition
Objectives
Notes and caveats

17.2 Inclusions and exclusions checklist

Inclusions checklist
Exclusions checklist

17.3 Currency conversion rates for US$

17.4 Research methodology

17.5 Data procurement

Information sources

17.6 Data validation

17.7 Validation techniques employed for market sizing

17.8 Data synthesis

17.9 360 degree market analysis

17.10 List of abbreviations

Research Methodology

Technavio presents a detailed picture of the market by way of study, synthesis, and summation of data from multiple sources. The analysts have presented the various facets of the market with a particular focus on identifying the key industry influencers. The data thus presented is comprehensive, reliable, and the result of extensive research, both primary and secondary.

INFORMATION SOURCES

Primary sources

  • Manufacturers and suppliers
  • Channel partners
  • Industry experts
  • Strategic decision makers

Secondary sources

  • Industry journals and periodicals
  • Government data
  • Financial reports of key industry players
  • Historical data
  • Press releases

DATA ANALYSIS

Data Synthesis

  • Collation of data
  • Estimation of key figures
  • Analysis of derived insights

Data Validation

  • Triangulation with data models
  • Reference against proprietary databases
  • Corroboration with industry experts

REPORT WRITING

Qualitative

  • Market drivers
  • Market challenges
  • Market trends
  • Five forces analysis

Quantitative

  • Market size and forecast
  • Market segmentation
  • Geographical insights
  • Competitive landscape

Interested in this report?

Get your sample now to see our research methodology and insights!

Download Now

Frequently Asked Questions

Environmental Disinfection Robot market growth will increase by USD 1884399.9 thousand thousand during 2026-2030.

The Environmental Disinfection Robot market is expected to grow at a CAGR of 40.7% during 2026-2030.

Environmental Disinfection Robot market is segmented by Technology (UV-C, HPV) Type (Autonomous mobile robots, Automated guided robots) Deployment (Semi-autonomous robots, Fully autonomous robots) End-user (Hospitals and healthcare, Research institutes, Universities and educational, Public and commercial spaces)

Aethon Inc., Akara Robotics Ltd., Ava Robotics Inc., Blue Ocean Robotics, Dimer UVC Innovations, Fetch Robotics Inc., Finsen Technologies Ltd., Keenon Robotics Co. Ltd., LG Electronics Inc., Mediland Enterprise Corp., OMRON Corp., Pudu Technology Co. Ltd., RobotLAB Inc, SKYTRON LLC, SMP Robotics Systems Corp., SoftBank Robotics Group, TMI Robotics Technology Co., UBTECH Robotics Corp Ltd, UVD Robots ApS, Xenex Disinfection Services LLC are a few of the key vendors in the Environmental Disinfection Robot market.

APAC will register the highest growth rate of 33.7% among the other regions. Therefore, the Environmental Disinfection Robot market in APAC is expected to garner significant business opportunities for the vendors during the forecast period.

Germany, France, UK, Italy, Spain, The Netherlands, China, Japan, India, South Korea, Australia, Singapore, US, Canada, Mexico, Saudi Arabia, UAE, South Africa, Turkey, Qatar, Brazil, Argentina, Chile

  • Escalating focus on healthcare-associated infection and stringent hygiene protocols is the driving factor this market.

The Environmental Disinfection Robot market vendors should focus on grabbing business opportunities from the Technology segment as it accounted for the largest market share in the base year.
RIA - Research AI Assistant
Ask RIA
