Ethylene Acrylic Acid Copolymer Market Analysis, Size, and Forecast 2025-2029: North America (US and Canada), Europe (France, Germany, Italy, and UK), Middle East and Africa (Egypt, KSA, Oman, and UAE), APAC (China, India, and Japan), South America (Argentina and Brazil), and Rest of World (ROW)

Ethylene Acrylic Acid Copolymer Market Analysis, Size, and Forecast 2025-2029:
North America (US and Canada), Europe (France, Germany, Italy, and UK), Middle East and Africa (Egypt, KSA, Oman, and UAE), APAC (China, India, and Japan), South America (Argentina and Brazil), and Rest of World (ROW)

Published: Jan 2025 208 Pages SKU: IRTNTR44010

Market Overview at a Glance

$299.8 Mn
Market Opportunity
11.4%
CAGR
9.9
YoY growth 2024-2025(%)

Ethylene Acrylic Acid Copolymer Market Size 2025-2029

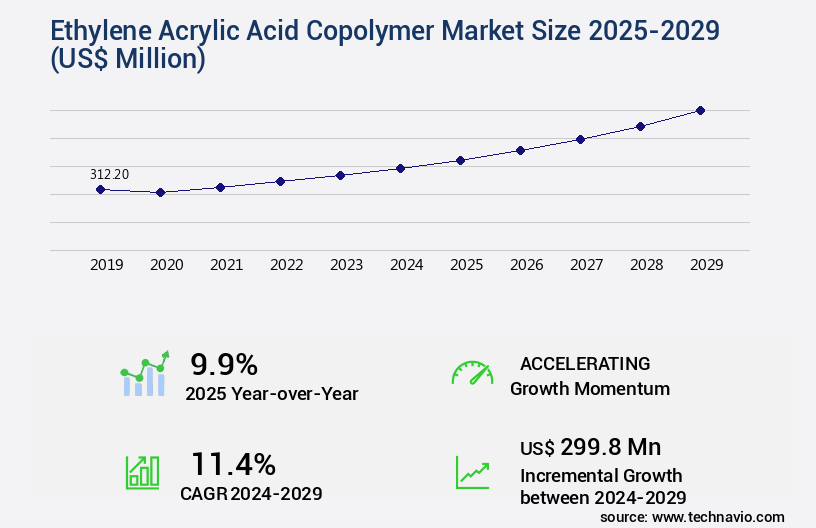
The ethylene acrylic acid copolymer market size is valued to increase USD 299.8 million, at a CAGR of 11.4% from 2024 to 2029. Increasing demand in food packaging industry will drive the ethylene acrylic acid copolymer market.

Major Market Trends & Insights

  • APAC dominated the market and accounted for a 37% growth during the forecast period.
  • By Application - Adhesives segment was valued at USD 146.00 million in 2023
  • By Type - 20wt percentage comonomer segment accounted for the largest market revenue share in 2023

Market Size & Forecast

  • Market Opportunities: USD 130.88 million
  • Market Future Opportunities: USD 299.80 million
  • CAGR : 11.4%
  • APAC: Largest market in 2023

Market Summary

  • The market is a dynamic and evolving industry, driven by the increasing demand for this versatile material in various sectors. Core technologies, such as emulsion polymerization and suspension polymerization, are at the heart of Ethylene Acrylic Acid Copolymer production. In the application realm, this market is gaining significant traction in the food packaging industry due to its excellent barrier properties and resistance to heat and chemicals. Moreover, the rise in demand for bio-based acrylic acid is fueling market growth. However, market expansion is not without challenges.
  • Fluctuations in raw-material prices, primarily ethylene and acrylic acid, pose significant risks to manufacturers. According to a recent study, the market is projected to account for over 12% of the global acrylic polymers market share by 2026. This underscores the market's potential and the opportunities it presents to stakeholders.

What will be the Size of the Ethylene Acrylic Acid Copolymer Market during the forecast period?

Ethylene Acrylic Acid Copolymer Market Size

Get Key Insights on Market Forecast (PDF) Request Free Sample

How is the Ethylene Acrylic Acid Copolymer Market Segmented and what are the key trends of market segmentation?

The ethylene acrylic acid copolymer industry research report provides comprehensive data (region-wise segment analysis), with forecasts and estimates in "USD million" for the period 2025-2029, as well as historical data from 2019-2023 for the following segments.

  • Application
    • Adhesives
    • Barrier coating
    • Others
  • Type
    • 20wt percentage comonomer
    • 9wt percentage comonomer
    • 5wt percentage comonomer
  • End-User
    • Industrial
    • Consumer Goods
    • Construction
  • Geography
    • North America
      • US
      • Canada
    • Europe
      • France
      • Germany
      • Italy
      • UK
    • Middle East and Africa
      • Egypt
      • KSA
      • Oman
      • UAE
    • APAC
      • China
      • India
      • Japan
    • South America
      • Argentina
      • Brazil
    • Rest of World (ROW)

By Application Insights

The adhesives segment is estimated to witness significant growth during the forecast period.

Ethylene acrylic acid copolymers (EAA) are experiencing significant growth in various industries due to their unique properties. The adhesives segment is a major contributor to this market expansion, driven by the increasing consumption of EAA in the packaging industry. Consumer demand and the rise of e-commerce are fueling the growth of the packaging sector, leading to increased demand for high-performance adhesives like EAA copolymers. These copolymers are characterized by their high-flexibility polymer chain, excellent substrate-wetting properties, and numerous chemical interactions. EAA copolymers exhibit superior adhesion performance, making them a preferred choice for numerous industries. In rheological characterization, EAA copolymers display a wide range of melt flow indices, providing versatility in processing conditions.

Thermal stability analysis reveals that EAA copolymers have good thermal stability, ensuring their applications in high-temperature processes. Surface morphology studies show that EAA copolymers have a uniform surface structure, which is crucial for applications requiring excellent film-forming properties. Molecular weight distribution and polymerization kinetics studies provide insights into the copolymers' chemical composition and the mechanisms of their formation. Crosslinking density, an essential factor in EAA copolymer properties, is crucial for understanding their mechanical strength and chemical resistance. Spectroscopic analysis, such as Fourier transform infrared (FTIR) and nuclear magnetic resonance (NMR), can be used to assess the chemical composition and functional groups of EAA copolymers.

EAA copolymers offer excellent oxidative stability, making them suitable for applications in various sectors. Glass transition temperature assessments provide insights into their thermal properties, while crystallinity assessments help understand their structure and behavior under different conditions. Surface tension measurements and water absorption capacity analyses are essential for understanding their compatibility with various substrates. Viscosity control is another critical factor in the application of EAA copolymers. Hydrolytic stability assessments help determine their resistance to degradation in water, while flexural modulus tests provide insights into their mechanical properties. Rheological modifiers can be used to tailor the rheological behavior of EAA copolymers to specific applications.

Adhesion strength testing, particle size distribution analysis, and degradation mechanisms studies help understand the copolymers' performance under various conditions. Impact resistance and elongation at break tests provide insights into their mechanical properties, while mechanical properties testing, such as tensile strength testing, help evaluate their overall performance. In summary, the market is experiencing significant growth, driven by the adhesives segment's increasing demand in the packaging industry. EAA copolymers' unique properties, including their high-flexibility polymer chain, excellent substrate-wetting properties, and numerous chemical interactions, make them a preferred choice for various applications. Continuous research and development efforts in areas such as polymerization kinetics, crosslinking density, and surface morphology are expected to drive future growth in this market.

Approximately 35% of the market revenue came from the adhesives segment in 2020. Furthermore, industry experts anticipate that the packaging industry's growth will lead to a 28% increase in the demand for EAA copolymers by 2025. These trends highlight the significant role of EAA copolymers in various industries and their potential for future growth.

Ethylene Acrylic Acid Copolymer Market Size

Request Free Sample

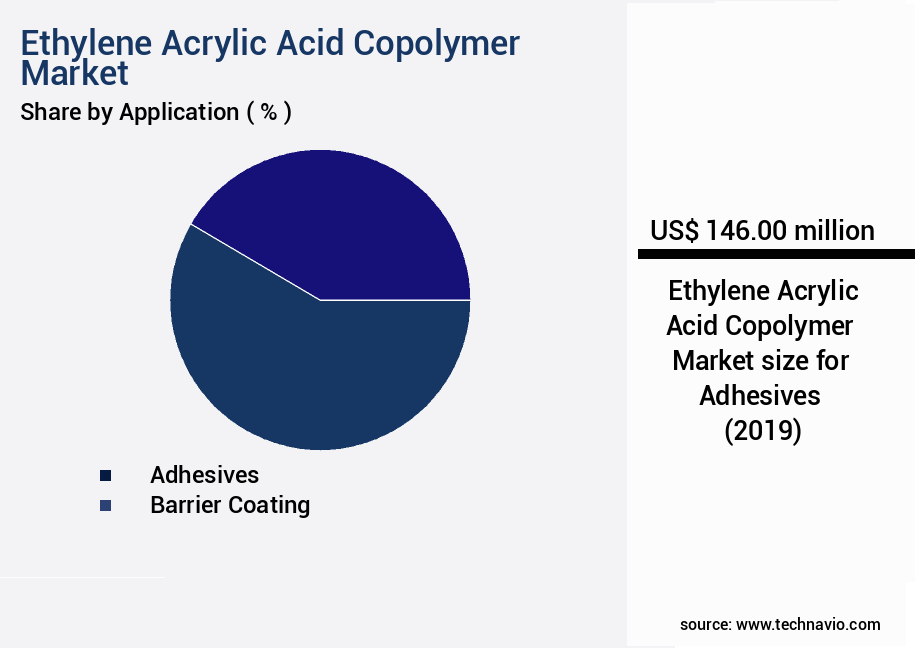
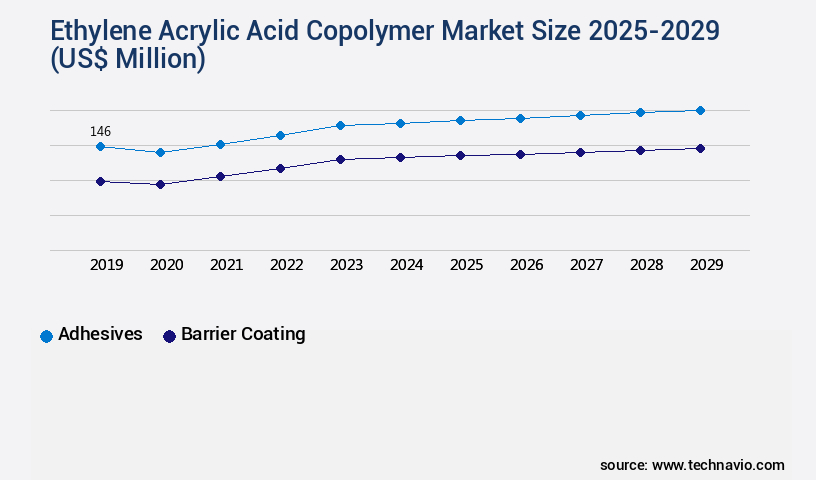
The Adhesives segment was valued at USD 146.00 million in 2019 and showed a gradual increase during the forecast period.

Ethylene Acrylic Acid Copolymer Market Size

Request Free Sample

Regional Analysis

APAC is estimated to contribute 37% to the growth of the global market during the forecast period.Technavio's analysts have elaborately explained the regional trends and drivers that shape the market during the forecast period.

Ethylene Acrylic Acid Copolymer Market Share by Geography

See How Ethylene Acrylic Acid Copolymer Market Demand is Rising in APAC Request Free Sample

The Ethylene Acrylic Acid Copolymer (EAA) market in APAC is poised for significant growth due to expanding industries such as packaging, automotive, construction, industrial equipment, paper, and textile. APAC is projected to lead the global market, driven by the increasing demand for packaged consumer goods and food products. EAA copolymers, known for their superior adhesive properties, are essential components in various applications, including adhesives, barrier coatings, cosmetics, personal care products, inks, and dyes. With a growing industrial base and rising consumer demand, APAC's dominance in the global EAA copolymer market is anticipated to continue. The region's packaging sector, fueled by the surge in e-commerce and food industries, is a significant contributor to the market growth.

Additionally, the automotive industry's increasing focus on lightweight materials and improved fuel efficiency further boosts the demand for EAA copolymers. Overall, APAC's dynamic industries and evolving market trends underscore the market's continuous growth and development.

Market Dynamics

Our researchers analyzed the data with 2024 as the base year, along with the key drivers, trends, and challenges. A holistic analysis of drivers will help companies refine their marketing strategies to gain a competitive advantage.

The market encompasses a diverse range of applications, from film formation and adhesive formulation to coating technology and biocompatible materials. This copolymer class is renowned for its unique properties, including copolymer rheology and melt processing, chemical modification, and impact of molecular weight on copolymer properties. The thermal degradation kinetics of acrylic copolymers play a crucial role in their industrial application. For instance, the surface energy and adhesion of copolymer films are essential factors in various industries, with copolymers exhibiting superior adhesion properties compared to their monomeric counterparts. Moreover, the effect of crosslinking on copolymer mechanical strength significantly influences their use in different sectors.

In adhesive formulation, for example, crosslinked copolymers offer enhanced strength and durability. Environmental fate of acrylic acid copolymers is another critical aspect of this market, with ongoing research focusing on their degradation under various conditions and crystallization kinetics and morphology. The stability of copolymers against oxidative stress is also a significant concern, with efforts underway to modify copolymer surface properties for improved resistance. Characterization techniques for copolymer analysis, such as mechanical behavior, water uptake and swelling, and effect of processing parameters, are essential in understanding copolymer properties and optimizing their production. Furthermore, the mechanical behavior of copolymer blends and their application in coating technology have gained considerable attention due to their unique properties and versatility.

Comparatively, the industrial application segment accounts for a significantly larger share of the market compared to the academic segment. This trend is driven by the growing demand for copolymers in various industries, including automotive, packaging, and construction. In conclusion, the market is a dynamic and evolving landscape, with ongoing research and development efforts focused on improving copolymer properties, expanding their applications, and addressing environmental concerns.

Ethylene Acrylic Acid Copolymer Market Size

What are the key market drivers leading to the rise in the adoption of Ethylene Acrylic Acid Copolymer Industry?

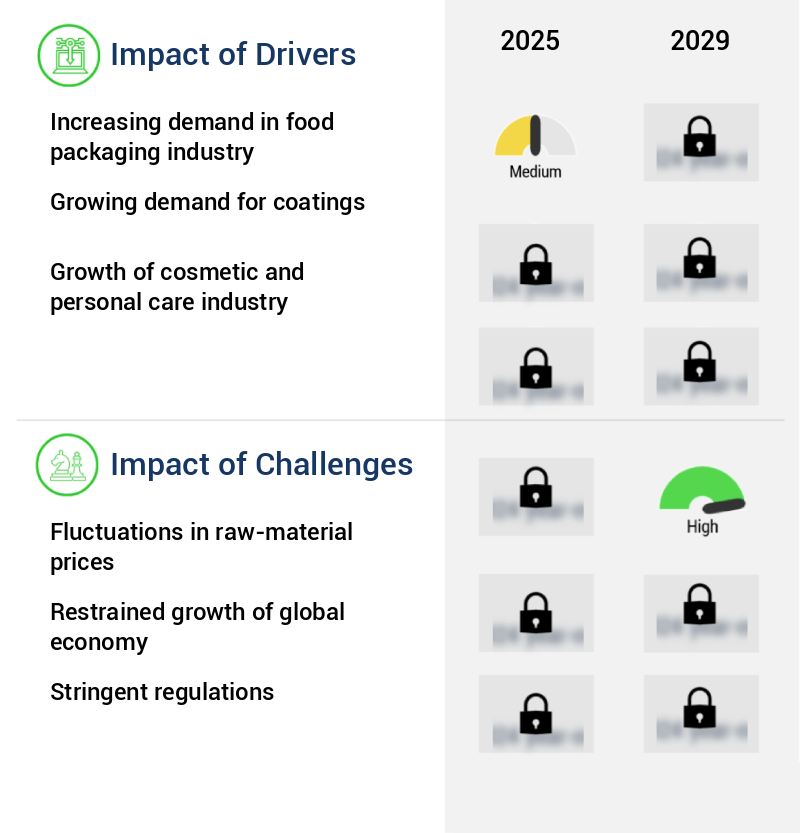
  • The food packaging industry's market growth is primarily driven by the rising demand for convenient and safe food solutions. 
  • EAA copolymers have become a versatile solution in the packaging industry due to their unique properties. These polymers adhere to various substrates, including paper, foil, LDPE, and polyamides, making them suitable for diverse applications. EAA copolymers are recognized for their thickening and binding abilities, solvent resistance, and water resistance. Their thermo-plasticity further enhances their utility, enabling high-speed packaging processes. Beyond their usage in tea bags, alcohol swabs, dry-food packages, and laminated tube container packages, EAA copolymers play a significant role in the packaging of juice and aseptic milk, snack foods, ketchup, and oil. The high bond resistance of EAA copolymers makes them an ideal choice for acid-food packaging applications.
  • Moreover, their heat-sealing properties contribute to their popularity in the high-speed packaging sector. 

What are the market trends shaping the Ethylene Acrylic Acid Copolymer Industry?

  • The market trend indicates a rising demand for bio-based acrylic acid. Acrylic acid derived from renewable sources is experiencing increasing market preference.
  • Acrylic acid, a crucial ingredient in ethylene acrylic acid copolymers, is witnessing a shift towards bio-based production from traditional petroleum-derived methods. This transition is influenced by the increasing global focus on sustainability and the volatility of crude oil prices. Across industries, acrylic acid is used extensively due to its versatile properties. However, its production process has undergone significant changes. Traditional methods using petrochemicals have given way to biotransformation techniques derived from renewable resources such as sugar and glycerol. Advanced purification technologies, including melt crystallization and liquid-liquid crystallization, have replaced conventional distillation and crystallization methods.
  • These advancements are expected to impact The market significantly. The adoption of bio-based acrylic acid is on the rise, with numerous manufacturers exploring sustainable alternatives to petroleum-based feedstocks. This shift towards renewable resources is set to redefine the market landscape.

What challenges does the Ethylene Acrylic Acid Copolymer Industry face during its growth?

  • The volatile pricing of raw materials poses a significant challenge to the industry's growth trajectory. 
  • The ethylene acrylic acid copolymer (EAA) market experiences significant fluctuations due to the volatile prices of its primary raw material, ethylene. Ethylene's cost is influenced by natural gas and crude oil prices. Consequently, any shifts in these commodities' prices result in corresponding changes in ethylene's cost, impacting the final price of EAA copolymers. Manufacturers face additional challenges from non-uniform raw material pricing, necessitating complex manufacturing and delivery planning. This uncertainty influences the consistent growth of the global EAA copolymer market.
  • Despite these challenges, the market continues to evolve, with ongoing research and development efforts aimed at improving product performance and sustainability. EAA copolymers offer advantages such as excellent adhesion properties and chemical resistance, making them valuable in various industries, including coatings, adhesives, and textiles. The market's continuous adaptation to raw material price fluctuations and technological advancements underscores its dynamic nature.

Exclusive Customer Landscape

The ethylene acrylic acid copolymer market forecasting report includes the adoption lifecycle of the market, covering from the innovator's stage to the laggard's stage. It focuses on adoption rates in different regions based on penetration. Furthermore, the ethylene acrylic acid copolymer market report also includes key purchase criteria and drivers of price sensitivity to help companies evaluate and develop their market growth analysis strategies.

Ethylene Acrylic Acid Copolymer Market Share by Geography

 Customer Landscape of Ethylene Acrylic Acid Copolymer Industry

Competitive Landscape & Market Insights

Companies are implementing various strategies, such as strategic alliances, ethylene acrylic acid copolymer market forecast, partnerships, mergers and acquisitions, geographical expansion, and product/service launches, to enhance their presence in the industry.

Arkema S.A. - This company specializes in producing ethylene acrylic acid copolymers, including LOTRYL 37 EH 550. These copolymers offer superior performance in various applications due to their unique properties. The company's commitment to innovation and quality sets it apart in the industry. Ethylene acrylic acid copolymers are versatile materials used in adhesives, coatings, and other industrial applications. LOTRYL 37 EH 550, in particular, exhibits excellent adhesion and chemical resistance. The company's research and development efforts continue to push the boundaries of what is possible with these materials.

The industry research and growth report includes detailed analyses of the competitive landscape of the market and information about key companies, including:

  • Arkema S.A.
  • Borealis AG
  • Celanese Corporation
  • China National Petroleum Corporation (CNPC)
  • Dow Chemical Company
  • DuPont de Nemours, Inc.
  • Exxon Mobil Corporation
  • Hanwha TotalEnergies Petrochemical Co., Ltd.
  • INEOS Group Holdings S.A.
  • Kingfa Science & Technology Co., Ltd.
  • Kuraray Co., Ltd.
  • LG Chem Ltd.
  • LyondellBasell Industries N.V.
  • Mitsubishi Chemical Corporation
  • PolyOne Corporation (Avient Corporation)
  • SABIC
  • Sika AG
  • Sumitomo Chemical Co., Ltd.
  • The Chemours Company
  • Wanhua Chemical Group Co., Ltd.

Qualitative and quantitative analysis of companies has been conducted to help clients understand the wider business environment as well as the strengths and weaknesses of key industry players. Data is qualitatively analyzed to categorize companies as pure play, category-focused, industry-focused, and diversified; it is quantitatively analyzed to categorize companies as dominant, leading, strong, tentative, and weak.

Recent Development and News in Ethylene Acrylic Acid Copolymer Market

  • In January 2025, INEOS Styrolution, the world's leading styrenics supplier, announced the expansion of its NA Styrolution production site in Marl, Germany, to produce more Ethylene Acrylic Acid Copolymers (EAA) (INEOS Styrolution press release). This expansion aims to cater to the increasing demand for EAA in the automotive and packaging industries.
  • In March 2025, SABIC and INEOS Styrolution entered into a strategic collaboration to develop and commercialize new EAA grades, targeting the automotive and electrical & electronics markets (SABIC press release). This partnership combines SABIC's expertise in the automotive industry and INEOS Styrolution's leadership in EAA production.
  • In April 2025, LG Chem and LG Plastics, subsidiaries of South Korea's LG Corporation, completed the acquisition of LANXESS's EAA business, including its production sites in Germany and the US (LANXESS press release). This acquisition strengthens LG Chem's position in the global EAA market and expands its production capacity.
  • In May 2025, Covestro, a leading global supplier of high-tech polymer materials, launched a new EAA grade, Terluran EAA 2820, designed for use in automotive under-the-hood applications (Covestro press release). This innovative material offers improved thermal stability and mechanical properties, addressing the evolving demands of the automotive industry.

Dive into Technavio's robust research methodology, blending expert interviews, extensive data synthesis, and validated models for unparalleled Ethylene Acrylic Acid Copolymer Market insights. See full methodology.

Market Scope

Report Coverage

Details

Page number

208

Base year

2024

Historic period

2019-2023

Forecast period

2025-2029

Growth momentum & CAGR

Accelerate at a CAGR of 11.4%

Market growth 2025-2029

USD 299.8 million

Market structure

Fragmented

YoY growth 2024-2025(%)

9.9

Key countries

US, Canada, Germany, UK, Italy, France, China, India, Japan, Brazil, Egypt, UAE, Oman, Argentina, KSA, UAE, Brazil, and Rest of World (ROW)

Competitive landscape

Leading Companies, Market Positioning of Companies, Competitive Strategies, and Industry Risks

Request Free Sample

Research Analyst Overview

  • Ethylene acrylic acid copolymers (EAACs) represent a dynamic and evolving market, characterized by ongoing research and development in various areas. These copolymers exhibit unique properties, derived from the ethylene reactivity and the incorporation of acrylic acid monomer. Rheological characterization and melt flow index analysis are crucial in understanding EAACs' behavior during processing. Thermal stability analysis and surface morphology assessments contribute to evaluating their performance under different conditions. Molecular weight distribution and polymerization kinetics studies provide insights into their structure and properties. Crosslinking density and film forming properties are essential factors in EAAC applications, as they impact chemical resistance and oxidative stability.
  • Spectroscopic analysis, glass transition temperature, and crystallinity assessment contribute to understanding the copolymers' chemical composition and properties. Surface tension measurement, water absorption capacity, and viscosity control are essential considerations for end-users, as they influence the copolymers' performance in various industries. Hydrolytic stability, flexural modulus, and mechanical properties testing provide valuable information on the copolymers' behavior under stress and environmental conditions. Rheological modifiers, adhesion strength, particle size distribution, and degradation mechanisms are ongoing areas of research, aiming to enhance EAAC properties and expand their applications. Processing conditions, impact resistance, elongation at break, and mechanical properties testing are essential to optimize manufacturing processes and ensure product quality.
  • Functional groups, chromatographic analysis, and uv resistance are critical aspects of EAAC research, as they influence the copolymers' reactivity and performance in various applications. Understanding the interplay between these factors and the copolymers' properties is essential for market participants to stay competitive and innovate.

What are the Key Data Covered in this Ethylene Acrylic Acid Copolymer Market Research and Growth Report?

  • What is the expected growth of the Ethylene Acrylic Acid Copolymer Market between 2025 and 2029?

    • USD 299.8 million, at a CAGR of 11.4%

  • What segmentation does the market report cover?

    • The report segmented by Application (Adhesives, Barrier coating, and Others), Type (20wt percentage comonomer, 9wt percentage comonomer, and 5wt percentage comonomer), Geography (APAC, North America, Europe, South America, and Middle East and Africa), and End-User (Industrial, Consumer Goods, and Construction)

  • Which regions are analyzed in the report?

    • APAC, North America, Europe, South America, and Middle East and Africa

  • What are the key growth drivers and market challenges?

    • Increasing demand in food packaging industry, Fluctuations in raw-material prices

  • Who are the major players in the Ethylene Acrylic Acid Copolymer Market?

    • Key Companies Arkema S.A., Borealis AG, Celanese Corporation, China National Petroleum Corporation (CNPC), Dow Chemical Company, DuPont de Nemours, Inc., Exxon Mobil Corporation, Hanwha TotalEnergies Petrochemical Co., Ltd., INEOS Group Holdings S.A., Kingfa Science & Technology Co., Ltd., Kuraray Co., Ltd., LG Chem Ltd., LyondellBasell Industries N.V., Mitsubishi Chemical Corporation, PolyOne Corporation (Avient Corporation), SABIC, Sika AG, Sumitomo Chemical Co., Ltd., The Chemours Company, and Wanhua Chemical Group Co., Ltd.

Market Research Insights

  • Ethylene acrylic acid copolymers (EAA) are a significant class of thermoplastic materials, renowned for their versatility and wide-ranging applications. The global market for EAA copolymers continues to expand, driven by increasing demand for sustainable and high-performance materials. According to industry estimates, the market size for EAA copolymers reached approximately 3.5 million metric tons in 2020, with a projected compound annual growth rate (CAGR) of 5% from 2021 to 2026. The unique property modification capabilities of EAA copolymers, including compatibilization strategies, reinforcement effects, and chain configuration, contribute to their popularity. For instance, the addition of EAA copolymers to polymer blends can enhance the durability and processability of the final product.
  • Furthermore, the branching degree and tacticity determination of EAA copolymers play a crucial role in their performance optimization and economic feasibility. Incorporating additives, such as processing aids and safety assessment components, is a common practice in the synthesis of EAA copolymers. Toxicity testing and regulatory compliance are essential considerations in the production process to ensure the safety and environmental impact of these materials. End-of-life options, including recycling potential and life cycle assessment, are increasingly important factors influencing the market's growth. Biodegradability studies and dispersion techniques are also essential aspects of EAA copolymer research and development.

We can help! Our analysts can customize this ethylene acrylic acid copolymer market research report to meet your requirements.

Get in touch

1 Executive Summary

  • 1.1 Market overview
    • Executive Summary - Chart on Market Overview
    • Executive Summary - Data Table on Market Overview
    • Executive Summary - Chart on Global Market Characteristics
    • Executive Summary - Chart on Market by Geography
    • Executive Summary - Chart on Market Segmentation by Application
    • Executive Summary - Chart on Market Segmentation by Type
    • Executive Summary - Chart on Incremental Growth
    • Executive Summary - Data Table on Incremental Growth
    • Executive Summary - Chart on Company Market Positioning

2 Technavio Analysis

  • 2.1 Analysis of price sensitivity, lifecycle, customer purchase basket, adoption rates, and purchase criteria
    • Analysis of price sensitivity, lifecycle, customer purchase basket, adoption rates, and purchase criteria
  • 2.2 Criticality of inputs and Factors of differentiation
    • Overview on criticality of inputs and factors of differentiation
  • 2.3 Factors of disruption
    • Overview on factors of disruption
  • 2.4 Impact of drivers and challenges
    • Impact of drivers and challenges in 2024 and 2029

3 Market Landscape

  • 3.1 Market ecosystem
    • Parent Market
    • Data Table on - Parent Market
  • 3.2 Market characteristics
    • Market characteristics analysis
  • 3.3 Value chain analysis
    • Value chain analysis

4 Market Sizing

  • 4.1 Market definition
    • Offerings of companies included in the market definition
  • 4.2 Market segment analysis
    • Market segments
  • 4.3 Market size 2024
    • 4.4 Market outlook: Forecast for 2024-2029
      • Chart on Global - Market size and forecast 2024-2029 ($ million)
      • Data Table on Global - Market size and forecast 2024-2029 ($ million)
      • Chart on Global Market: Year-over-year growth 2024-2029 (%)
      • Data Table on Global Market: Year-over-year growth 2024-2029 (%)

    5 Historic Market Size

    • 5.1 Global Ethylene Acrylic Acid Copolymer Market 2019 - 2023
      • Historic Market Size - Data Table on Global Ethylene Acrylic Acid Copolymer Market 2019 - 2023 ($ million)
    • 5.2 Application segment analysis 2019 - 2023
      • Historic Market Size - Application Segment 2019 - 2023 ($ million)
    • 5.3 Type segment analysis 2019 - 2023
      • Historic Market Size - Type Segment 2019 - 2023 ($ million)
    • 5.4 Geography segment analysis 2019 - 2023
      • Historic Market Size - Geography Segment 2019 - 2023 ($ million)
    • 5.5 Country segment analysis 2019 - 2023
      • Historic Market Size - Country Segment 2019 - 2023 ($ million)

    6 Qualitative Analysis

    • 6.1 The AI impact on Global Ethylene Acrylic Acid Copolymer Market

      7 Five Forces Analysis

      • 7.1 Five forces summary
        • Five forces analysis - Comparison between 2024 and 2029
      • 7.2 Bargaining power of buyers
        • Bargaining power of buyers - Impact of key factors 2024 and 2029
      • 7.3 Bargaining power of suppliers
        • Bargaining power of suppliers - Impact of key factors in 2024 and 2029
      • 7.4 Threat of new entrants
        • Threat of new entrants - Impact of key factors in 2024 and 2029
      • 7.5 Threat of substitutes
        • Threat of substitutes - Impact of key factors in 2024 and 2029
      • 7.6 Threat of rivalry
        • Threat of rivalry - Impact of key factors in 2024 and 2029
      • 7.7 Market condition
        • Chart on Market condition - Five forces 2024 and 2029

      8 Market Segmentation by Application

      • 8.1 Market segments
        • Chart on Application - Market share (2024-2029) (%)
        • Data Table on Application - Market share (2024-2029) (%)
      • 8.2 Comparison by Application
        • Chart on Comparison by Application
        • Data Table on Comparison by Application
      • 8.3 Adhesives - Market size and forecast (2024-2029)
        • Chart on Adhesives - Market size and forecast (2024-2029) ($ million)
        • Data Table on Adhesives - Market size and forecast (2024-2029) ($ million)
        • Chart on Adhesives - Year-over-year growth (2024-2029) (%)
        • Data Table on Adhesives - Year-over-year growth (2024-2029) (%)
      • 8.4 Barrier coating - Market size and forecast (2024-2029)
        • Chart on Barrier coating - Market size and forecast (2024-2029) ($ million)
        • Data Table on Barrier coating - Market size and forecast (2024-2029) ($ million)
        • Chart on Barrier coating - Year-over-year growth (2024-2029) (%)
        • Data Table on Barrier coating - Year-over-year growth (2024-2029) (%)
      • 8.5 Others - Market size and forecast (2024-2029)
        • Chart on Others - Market size and forecast (2024-2029) ($ million)
        • Data Table on Others - Market size and forecast (2024-2029) ($ million)
        • Chart on Others - Year-over-year growth (2024-2029) (%)
        • Data Table on Others - Year-over-year growth (2024-2029) (%)
      • 8.6 Market opportunity by Application
        • Market opportunity by Application ($ million)
        • Data Table on Market opportunity by Application ($ million)

      9 Market Segmentation by Type

      • 9.1 Market segments
        • Chart on Type - Market share (2024-2029) (%)
        • Data Table on Type - Market share (2024-2029) (%)
      • 9.2 Comparison by Type
        • Chart on Comparison by Type
        • Data Table on Comparison by Type
      • 20wt percentage comonomer - Market size and forecast (2024-2029)
        • Chart on 20wt percentage comonomer - Market size and forecast (2024-2029) ($ million)
        • Data Table on 20wt percentage comonomer - Market size and forecast (2024-2029) ($ million)
        • Chart on 20wt percentage comonomer - Year-over-year growth (2024-2029) (%)
        • Data Table on 20wt percentage comonomer - Year-over-year growth (2024-2029) (%)
      • 9wt percentage comonomer - Market size and forecast (2024-2029)
        • Chart on 9wt percentage comonomer - Market size and forecast (2024-2029) ($ million)
        • Data Table on 9wt percentage comonomer - Market size and forecast (2024-2029) ($ million)
        • Chart on 9wt percentage comonomer - Year-over-year growth (2024-2029) (%)
        • Data Table on 9wt percentage comonomer - Year-over-year growth (2024-2029) (%)
      • 5wt percentage comonomer - Market size and forecast (2024-2029)
        • Chart on 5wt percentage comonomer - Market size and forecast (2024-2029) ($ million)
        • Data Table on 5wt percentage comonomer - Market size and forecast (2024-2029) ($ million)
        • Chart on 5wt percentage comonomer - Year-over-year growth (2024-2029) (%)
        • Data Table on 5wt percentage comonomer - Year-over-year growth (2024-2029) (%)
      • 9.6 Market opportunity by Type
        • Market opportunity by Type ($ million)
        • Data Table on Market opportunity by Type ($ million)

      10 Market Segmentation by End-User

      • 10.1 Market segments
        • Chart on End-User - Market share (2024-2029) (%)
        • Data Table on End-User - Market share (2024-2029) (%)
      • 10.2 Comparison by End-User
        • Chart on Comparison by End-User
        • Data Table on Comparison by End-User
      • 10.3 Industrial - Market size and forecast (2024-2029)
        • Chart on Industrial - Market size and forecast (2024-2029) ($ million)
        • Data Table on Industrial - Market size and forecast (2024-2029) ($ million)
        • Chart on Industrial - Year-over-year growth (2024-2029) (%)
        • Data Table on Industrial - Year-over-year growth (2024-2029) (%)
      • 10.4 Consumer Goods - Market size and forecast (2024-2029)
        • Chart on Consumer Goods - Market size and forecast (2024-2029) ($ million)
        • Data Table on Consumer Goods - Market size and forecast (2024-2029) ($ million)
        • Chart on Consumer Goods - Year-over-year growth (2024-2029) (%)
        • Data Table on Consumer Goods - Year-over-year growth (2024-2029) (%)
      • 10.5 Construction - Market size and forecast (2024-2029)
        • Chart on Construction - Market size and forecast (2024-2029) ($ million)
        • Data Table on Construction - Market size and forecast (2024-2029) ($ million)
        • Chart on Construction - Year-over-year growth (2024-2029) (%)
        • Data Table on Construction - Year-over-year growth (2024-2029) (%)
      • 10.6 Market opportunity by End-User
        • Market opportunity by End-User ($ million)
        • Data Table on Market opportunity by End-User ($ million)

      11 Customer Landscape

      • 11.1 Customer landscape overview
        • Analysis of price sensitivity, lifecycle, customer purchase basket, adoption rates, and purchase criteria

      12 Geographic Landscape

      • 12.1 Geographic segmentation
        • Chart on Market share by geography 2024-2029 (%)
        • Data Table on Market share by geography 2024-2029 (%)
      • 12.2 Geographic comparison
        • Chart on Geographic comparison
        • Data Table on Geographic comparison
      • 12.3 APAC - Market size and forecast 2024-2029
        • Chart on APAC - Market size and forecast 2024-2029 ($ million)
        • Data Table on APAC - Market size and forecast 2024-2029 ($ million)
        • Chart on APAC - Year-over-year growth 2024-2029 (%)
        • Data Table on APAC - Year-over-year growth 2024-2029 (%)
      • 12.4 North America - Market size and forecast 2024-2029
        • Chart on North America - Market size and forecast 2024-2029 ($ million)
        • Data Table on North America - Market size and forecast 2024-2029 ($ million)
        • Chart on North America - Year-over-year growth 2024-2029 (%)
        • Data Table on North America - Year-over-year growth 2024-2029 (%)
      • 12.5 Europe - Market size and forecast 2024-2029
        • Chart on Europe - Market size and forecast 2024-2029 ($ million)
        • Data Table on Europe - Market size and forecast 2024-2029 ($ million)
        • Chart on Europe - Year-over-year growth 2024-2029 (%)
        • Data Table on Europe - Year-over-year growth 2024-2029 (%)
      • 12.6 South America - Market size and forecast 2024-2029
        • Chart on South America - Market size and forecast 2024-2029 ($ million)
        • Data Table on South America - Market size and forecast 2024-2029 ($ million)
        • Chart on South America - Year-over-year growth 2024-2029 (%)
        • Data Table on South America - Year-over-year growth 2024-2029 (%)
      • 12.7 Middle East and Africa - Market size and forecast 2024-2029
        • Chart on Middle East and Africa - Market size and forecast 2024-2029 ($ million)
        • Data Table on Middle East and Africa - Market size and forecast 2024-2029 ($ million)
        • Chart on Middle East and Africa - Year-over-year growth 2024-2029 (%)
        • Data Table on Middle East and Africa - Year-over-year growth 2024-2029 (%)
      • 12.8 China - Market size and forecast 2024-2029
        • Chart on China - Market size and forecast 2024-2029 ($ million)
        • Data Table on China - Market size and forecast 2024-2029 ($ million)
        • Chart on China - Year-over-year growth 2024-2029 (%)
        • Data Table on China - Year-over-year growth 2024-2029 (%)
      • 12.9 US - Market size and forecast 2024-2029
        • Chart on US - Market size and forecast 2024-2029 ($ million)
        • Data Table on US - Market size and forecast 2024-2029 ($ million)
        • Chart on US - Year-over-year growth 2024-2029 (%)
        • Data Table on US - Year-over-year growth 2024-2029 (%)
      • 12.10 Germany - Market size and forecast 2024-2029
        • Chart on Germany - Market size and forecast 2024-2029 ($ million)
        • Data Table on Germany - Market size and forecast 2024-2029 ($ million)
        • Chart on Germany - Year-over-year growth 2024-2029 (%)
        • Data Table on Germany - Year-over-year growth 2024-2029 (%)
      • 12.11 Brazil - Market size and forecast 2024-2029
        • Chart on Brazil - Market size and forecast 2024-2029 ($ million)
        • Data Table on Brazil - Market size and forecast 2024-2029 ($ million)
        • Chart on Brazil - Year-over-year growth 2024-2029 (%)
        • Data Table on Brazil - Year-over-year growth 2024-2029 (%)
      • 12.12 Japan - Market size and forecast 2024-2029
        • Chart on Japan - Market size and forecast 2024-2029 ($ million)
        • Data Table on Japan - Market size and forecast 2024-2029 ($ million)
        • Chart on Japan - Year-over-year growth 2024-2029 (%)
        • Data Table on Japan - Year-over-year growth 2024-2029 (%)
      • 12.13 France - Market size and forecast 2024-2029
        • Chart on France - Market size and forecast 2024-2029 ($ million)
        • Data Table on France - Market size and forecast 2024-2029 ($ million)
        • Chart on France - Year-over-year growth 2024-2029 (%)
        • Data Table on France - Year-over-year growth 2024-2029 (%)
      • 12.14 India - Market size and forecast 2024-2029
        • Chart on India - Market size and forecast 2024-2029 ($ million)
        • Data Table on India - Market size and forecast 2024-2029 ($ million)
        • Chart on India - Year-over-year growth 2024-2029 (%)
        • Data Table on India - Year-over-year growth 2024-2029 (%)
      • 12.15 Canada - Market size and forecast 2024-2029
        • Chart on Canada - Market size and forecast 2024-2029 ($ million)
        • Data Table on Canada - Market size and forecast 2024-2029 ($ million)
        • Chart on Canada - Year-over-year growth 2024-2029 (%)
        • Data Table on Canada - Year-over-year growth 2024-2029 (%)
      • 12.16 UK - Market size and forecast 2024-2029
        • Chart on UK - Market size and forecast 2024-2029 ($ million)
        • Data Table on UK - Market size and forecast 2024-2029 ($ million)
        • Chart on UK - Year-over-year growth 2024-2029 (%)
        • Data Table on UK - Year-over-year growth 2024-2029 (%)
      • 12.17 UAE - Market size and forecast 2024-2029
        • Chart on UAE - Market size and forecast 2024-2029 ($ million)
        • Data Table on UAE - Market size and forecast 2024-2029 ($ million)
        • Chart on UAE - Year-over-year growth 2024-2029 (%)
        • Data Table on UAE - Year-over-year growth 2024-2029 (%)
      • 12.18 Market opportunity by geography
        • Market opportunity by geography ($ million)
        • Data Tables on Market opportunity by geography ($ million)
      • 12.19 Italy - Market size and forecast (2024-2029)
        • Chart on Italy - Market size and forecast (2024-2029) ($ million)
        • Data Table on Italy - Market size and forecast (2024-2029) ($ million)
        • Chart on Italy - Year-over-year growth (2024-2029) (%)
        • Data Table on Italy - Year-over-year growth (2024-2029) (%)
      • 12.20 Egypt - Market size and forecast (2024-2029)
        • Chart on Egypt - Market size and forecast (2024-2029) ($ million)
        • Data Table on Egypt - Market size and forecast (2024-2029) ($ million)
        • Chart on Egypt - Year-over-year growth (2024-2029) (%)
        • Data Table on Egypt - Year-over-year growth (2024-2029) (%)
      • 12.21 Oman - Market size and forecast (2024-2029)
        • Chart on Oman - Market size and forecast (2024-2029) ($ million)
        • Data Table on Oman - Market size and forecast (2024-2029) ($ million)
        • Chart on Oman - Year-over-year growth (2024-2029) (%)
        • Data Table on Oman - Year-over-year growth (2024-2029) (%)
      • 12.22 Argentina - Market size and forecast (2024-2029)
        • Chart on Argentina - Market size and forecast (2024-2029) ($ million)
        • Data Table on Argentina - Market size and forecast (2024-2029) ($ million)
        • Chart on Argentina - Year-over-year growth (2024-2029) (%)
        • Data Table on Argentina - Year-over-year growth (2024-2029) (%)
      • 12.23 KSA - Market size and forecast (2024-2029)
        • Chart on KSA - Market size and forecast (2024-2029) ($ million)
        • Data Table on KSA - Market size and forecast (2024-2029) ($ million)
        • Chart on KSA - Year-over-year growth (2024-2029) (%)
        • Data Table on KSA - Year-over-year growth (2024-2029) (%)
      • 12.24 Rest of World (ROW) - Market size and forecast (2024-2029)
        • Chart on Rest of World (ROW) - Market size and forecast (2024-2029) ($ million)
        • Data Table on Rest of World (ROW) - Market size and forecast (2024-2029) ($ million)
        • Chart on Rest of World (ROW) - Year-over-year growth (2024-2029) (%)
        • Data Table on Rest of World (ROW) - Year-over-year growth (2024-2029) (%)

      13 Drivers, Challenges, and Opportunity/Restraints

      • 13.1 Market drivers
        • 13.2 Market challenges
          • 13.3 Impact of drivers and challenges
            • Impact of drivers and challenges in 2024 and 2029
          • 13.4 Market opportunities/restraints

            14 Competitive Landscape

            • 14.1 Overview
              • 14.2 Competitive Landscape
                • Overview on criticality of inputs and factors of differentiation
              • 14.3 Landscape disruption
                • Overview on factors of disruption
              • 14.4 Industry risks
                • Impact of key risks on business

              15 Competitive Analysis

              • 15.1 Companies profiled
                • Companies covered
              • 15.2 Market positioning of companies
                • Matrix on companies position and classification
              • 15.3 Arkema S.A.
                • Arkema S.A. - Overview
                • Arkema S.A. - Product / Service
                • Arkema S.A. - Key offerings
              • 15.4 Borealis AG
                • Borealis AG - Overview
                • Borealis AG - Product / Service
                • Borealis AG - Key offerings
              • 15.5 Celanese Corporation
                • Celanese Corporation - Overview
                • Celanese Corporation - Product / Service
                • Celanese Corporation - Key offerings
              • 15.6 China National Petroleum Corporation (CNPC)
                • China National Petroleum Corporation (CNPC) - Overview
                • China National Petroleum Corporation (CNPC) - Product / Service
                • China National Petroleum Corporation (CNPC) - Key offerings
              • 15.7 Dow Chemical Company
                • Dow Chemical Company - Overview
                • Dow Chemical Company - Product / Service
                • Dow Chemical Company - Key offerings
              • 15.8 DuPont de Nemours, Inc.
                • DuPont de Nemours, Inc. - Overview
                • DuPont de Nemours, Inc. - Product / Service
                • DuPont de Nemours, Inc. - Key offerings
              • 15.9 Exxon Mobil Corporation
                • Exxon Mobil Corporation - Overview
                • Exxon Mobil Corporation - Product / Service
                • Exxon Mobil Corporation - Key offerings
              • 15.10 Hanwha TotalEnergies Petrochemical Co., Ltd.
                • Hanwha TotalEnergies Petrochemical Co., Ltd. - Overview
                • Hanwha TotalEnergies Petrochemical Co., Ltd. - Product / Service
                • Hanwha TotalEnergies Petrochemical Co., Ltd. - Key offerings
              • 15.11 INEOS Group Holdings S.A.
                • INEOS Group Holdings S.A. - Overview
                • INEOS Group Holdings S.A. - Product / Service
                • INEOS Group Holdings S.A. - Key offerings
              • 15.12 Kingfa Science & Technology Co., Ltd.
                • Kingfa Science & Technology Co., Ltd. - Overview
                • Kingfa Science & Technology Co., Ltd. - Product / Service
                • Kingfa Science & Technology Co., Ltd. - Key offerings
              • 15.13 Kuraray Co., Ltd.
                • Kuraray Co., Ltd. - Overview
                • Kuraray Co., Ltd. - Product / Service
                • Kuraray Co., Ltd. - Key offerings
              • 15.14 LG Chem Ltd.
                • LG Chem Ltd. - Overview
                • LG Chem Ltd. - Product / Service
                • LG Chem Ltd. - Key offerings
              • 15.15 LyondellBasell Industries N.V.
                • LyondellBasell Industries N.V. - Overview
                • LyondellBasell Industries N.V. - Product / Service
                • LyondellBasell Industries N.V. - Key offerings
              • 15.16 Mitsubishi Chemical Corporation
                • Mitsubishi Chemical Corporation - Overview
                • Mitsubishi Chemical Corporation - Product / Service
                • Mitsubishi Chemical Corporation - Key offerings
              • 15.17 PolyOne Corporation (Avient Corporation)
                • PolyOne Corporation (Avient Corporation) - Overview
                • PolyOne Corporation (Avient Corporation) - Product / Service
                • PolyOne Corporation (Avient Corporation) - Key offerings
              • 15.18 SABIC
                • SABIC - Overview
                • SABIC - Product / Service
                • SABIC - Key offerings
              • 15.19 Sika AG
                • Sika AG - Overview
                • Sika AG - Product / Service
                • Sika AG - Key offerings
              • 15.20 Sumitomo Chemical Co., Ltd.
                • Sumitomo Chemical Co., Ltd. - Overview
                • Sumitomo Chemical Co., Ltd. - Product / Service
                • Sumitomo Chemical Co., Ltd. - Key offerings
              • 15.21 The Chemours Company
                • The Chemours Company - Overview
                • The Chemours Company - Product / Service
                • The Chemours Company - Key offerings
              • 15.22 Wanhua Chemical Group Co., Ltd.
                • Wanhua Chemical Group Co., Ltd. - Overview
                • Wanhua Chemical Group Co., Ltd. - Product / Service
                • Wanhua Chemical Group Co., Ltd. - Key offerings
              • 15.23 Arkema S.A.
                • Arkema S.A. - Overview
                • Arkema S.A. - Product / Service
                • Arkema S.A. - Key offerings
              • 15.24 BASF SE
                • BASF SE - Overview
                • BASF SE - Product / Service
                • BASF SE - Key offerings
              • 15.25 Celanese Corporation
                • Celanese Corporation - Overview
                • Celanese Corporation - Product / Service
                • Celanese Corporation - Key offerings
              • 15.26 Chemours Company
                • Chemours Company - Overview
                • Chemours Company - Product / Service
                • Chemours Company - Key offerings
              • 15.27 Dow Inc.
                • Dow Inc. - Overview
                • Dow Inc. - Product / Service
                • Dow Inc. - Key offerings
              • 15.28 DuPont
                • DuPont - Overview
                • DuPont - Product / Service
                • DuPont - Key offerings
              • 15.29 ExxonMobil Chemical
                • ExxonMobil Chemical - Overview
                • ExxonMobil Chemical - Product / Service
                • ExxonMobil Chemical - Key offerings
              • 15.30 Honeywell International
                • Honeywell International - Overview
                • Honeywell International - Product / Service
                • Honeywell International - Key offerings
              • 15.31 INEOS Group
                • INEOS Group - Overview
                • INEOS Group - Product / Service
                • INEOS Group - Key offerings
              • 15.32 Jiangsu Sailboat Petrochemical
                • Jiangsu Sailboat Petrochemical - Overview
                • Jiangsu Sailboat Petrochemical - Product / Service
                • Jiangsu Sailboat Petrochemical - Key offerings
              • 15.33 LG Chem
                • LG Chem - Overview
                • LG Chem - Product / Service
                • LG Chem - Key offerings
              • 15.34 LyondellBasell Industries
                • LyondellBasell Industries - Overview
                • LyondellBasell Industries - Product / Service
                • LyondellBasell Industries - Key offerings
              • 15.35 Mitsubishi Chemical
                • Mitsubishi Chemical - Overview
                • Mitsubishi Chemical - Product / Service
                • Mitsubishi Chemical - Key offerings
              • 15.36 Mitsui Chemicals
                • Mitsui Chemicals - Overview
                • Mitsui Chemicals - Product / Service
                • Mitsui Chemicals - Key offerings
              • 15.37 Polimeri Europa
                • Polimeri Europa - Overview
                • Polimeri Europa - Product / Service
                • Polimeri Europa - Key offerings
              • 15.38 SABIC
                • SABIC - Overview
                • SABIC - Product / Service
                • SABIC - Key offerings
              • 15.39 Showa Denko
                • Showa Denko - Overview
                • Showa Denko - Product / Service
                • Showa Denko - Key offerings
              • 15.40 Sumitomo Chemical
                • Sumitomo Chemical - Overview
                • Sumitomo Chemical - Product / Service
                • Sumitomo Chemical - Key offerings
              • 15.41 Toray Industries
                • Toray Industries - Overview
                • Toray Industries - Product / Service
                • Toray Industries - Key offerings
              • 15.42 Tosoh Corporation
                • Tosoh Corporation - Overview
                • Tosoh Corporation - Product / Service
                • Tosoh Corporation - Key offerings

              16 Appendix

              • 16.1 Scope of the report
                • 16.2 Inclusions and exclusions checklist
                  • Inclusions checklist
                  • Exclusions checklist
                • 16.3 Currency conversion rates for US$
                  • Currency conversion rates for US$
                • 16.4 Research methodology
                  • Research methodology
                • 16.5 Data procurement
                  • Information sources
                • 16.6 Data validation
                  • Data validation
                • 16.7 Validation techniques employed for market sizing
                  • Validation techniques employed for market sizing
                • 16.8 Data synthesis
                  • Data synthesis
                • 16.9 360 degree market analysis
                  • 360 degree market analysis
                • 16.10 List of abbreviations
                  • List of abbreviations

                Research Methodology

                Technavio presents a detailed picture of the market by way of study, synthesis, and summation of data from multiple sources. The analysts have presented the various facets of the market with a particular focus on identifying the key industry influencers. The data thus presented is comprehensive, reliable, and the result of extensive research, both primary and secondary.

                INFORMATION SOURCES

                Primary sources

                • Manufacturers and suppliers
                • Channel partners
                • Industry experts
                • Strategic decision makers

                Secondary sources

                • Industry journals and periodicals
                • Government data
                • Financial reports of key industry players
                • Historical data
                • Press releases

                DATA ANALYSIS

                Data Synthesis

                • Collation of data
                • Estimation of key figures
                • Analysis of derived insights

                Data Validation

                • Triangulation with data models
                • Reference against proprietary databases
                • Corroboration with industry experts

                REPORT WRITING

                Qualitative

                • Market drivers
                • Market challenges
                • Market trends
                • Five forces analysis

                Quantitative

                • Market size and forecast
                • Market segmentation
                • Geographical insights
                • Competitive landscape

                Interested in this report?

                Get your sample now to see our research methodology and insights!

                Download Now

                Frequently Asked Questions

                Ethylene Acrylic Acid Copolymer market growth will increase by $ 299.8 mn during 2025-2029 .

                The Ethylene Acrylic Acid Copolymer market is expected to grow at a CAGR of 11.4% during 2025-2029 .

                Ethylene Acrylic Acid Copolymer market is segmented by Application( Adhesives, Barrier coating, Others) Type( 20wt percentage comonomer, 9wt percentage comonomer, 5wt percentage comonomer, South America, MEA)

                Arkema S.A., Borealis AG, Celanese Corporation, China National Petroleum Corporation (CNPC), Dow Chemical Company, DuPont de Nemours, Inc., Exxon Mobil Corporation, Hanwha TotalEnergies Petrochemical Co., Ltd., INEOS Group Holdings S.A., Kingfa Science & Technology Co., Ltd., Kuraray Co., Ltd., LG Chem Ltd., LyondellBasell Industries N.V., Mitsubishi Chemical Corporation, PolyOne Corporation (Avient Corporation), SABIC, Sika AG, Sumitomo Chemical Co., Ltd., The Chemours Company, Wanhua Chemical Group Co., Ltd. are a few of the key vendors in the Ethylene Acrylic Acid Copolymer market.

                APAC will register the highest growth rate of 37% among the other regions. Therefore, the Ethylene Acrylic Acid Copolymer market in APAC is expected to garner significant business opportunities for the vendors during the forecast period.

                US, Canada, Germany, UK, Italy, France, China, India, Japan, Brazil, Egypt, UAE, Oman, Argentina, KSA, UAE, Brazil, Rest of World (ROW)

                • Increasing demand in food packaging industryOwing to its adhesive properties is the driving factor this market.
                • EAA copolymer is used in multiple packaging applications in the food packaging industry. EAA copolymer adheres to packaging substrates such as paper is the driving factor this market.
                • foil is the driving factor this market.
                • LDPE is the driving factor this market.
                • and polyamides. EAA copolymer is characterized by thickening and binding properties; resistance to solvents is the driving factor this market.
                • grease is the driving factor this market.
                • and water; and thermo-plasticity. The polymer is characterized by high bond resistance is the driving factor this market.
                • which makes it suitable for acid-food packaging applications. The heat-sealing properties of EAA copolymer make it suitable for high-speed packaging. Apart from their use in tea bags is the driving factor this market.
                • alcohol swabs is the driving factor this market.
                • dry-food packages is the driving factor this market.
                • and laminated tube container packages is the driving factor this market.
                • EAA copolymer is used for the packaging of juice and aseptic milk is the driving factor this market.
                • snack foods is the driving factor this market.
                • ketchup is the driving factor this market.
                • and oil. The increase in demand for EAA copolymers in the food packaging industry is expected to influence the growth of the global ethylene acrylic acid copolymer market. Lifestyle evolutions is the driving factor this market.
                • expansion of the retail sector is the driving factor this market.
                • and the global increase in food service players further contribute to the growth of the global ethylene acrylic acid copolymer market. To expand their customer bases is the driving factor this market.
                • the key players in the food industry are venturing toward developing smart packaging solutions. This has increased the demand for EAA copolymers is the driving factor this market.
                • contributing to the growth of the global ethylene acrylic acid copolymer market. is the driving factor this market.

                The Ethylene Acrylic Acid Copolymer market vendors should focus on grabbing business opportunities from the Adhesives segment as it accounted for the largest market share in the base year.