Ethylene Carbonate Market Analysis, Size, and Forecast 2024-2028: North America (US and Canada), Europe (France, Germany, Italy, and UK), Middle East and Africa (Egypt, KSA, Oman, and UAE), APAC (China, India, and Japan), South America (Argentina and Brazil), and Rest of World (ROW)

Ethylene Carbonate Market Analysis, Size, and Forecast 2024-2028:
North America (US and Canada), Europe (France, Germany, Italy, and UK), Middle East and Africa (Egypt, KSA, Oman, and UAE), APAC (China, India, and Japan), South America (Argentina and Brazil), and Rest of World (ROW)

Published: Mar 2024 170 Pages SKU: IRTNTR40107

Market Overview at a Glance

$223.48 Mn
Market Opportunity
10.32%
CAGR
9.96
YoY growth 2023-2024(%)

Ethylene Carbonate Market Size 2024-2028

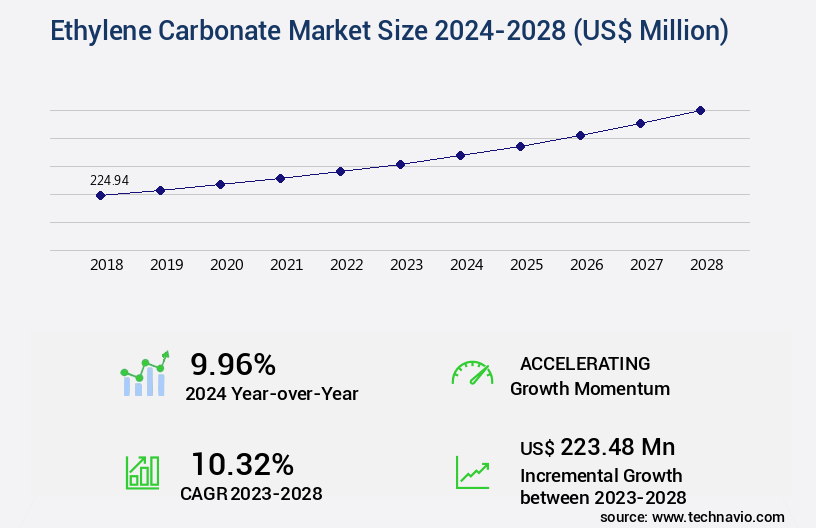
The ethylene carbonate market size is valued to increase USD 223.48 million, at a CAGR of 10.32% from 2023 to 2028. Growing automotive production will drive the ethylene carbonate market.

Major Market Trends & Insights

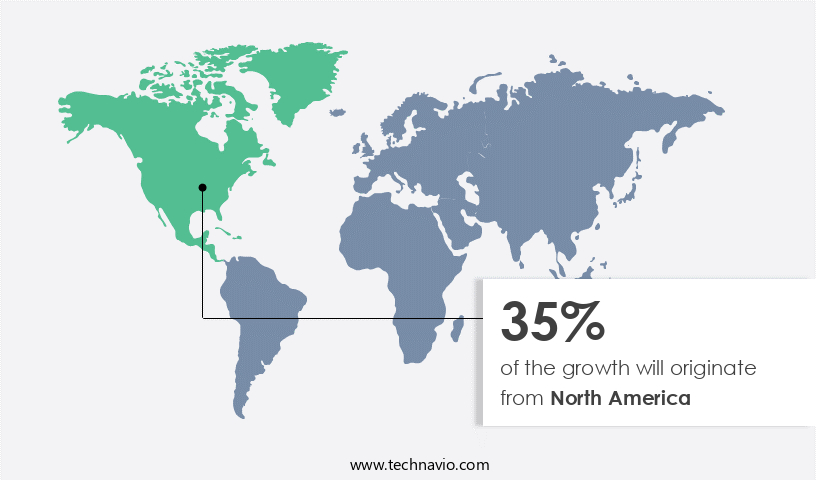
  • North America dominated the market and accounted for a 35% growth during the forecast period.
  • By Application - Lubricants segment was valued at USD 79.14 million in 2022
  • By Type - Solid segment accounted for the largest market revenue share in 2022

Market Size & Forecast

  • Market Opportunities: USD 156.05 million
  • Market Future Opportunities: USD 223.48 million
  • CAGR from 2023 to 2028 : 10.32%

Market Summary

  • The market is a dynamic and evolving sector, driven by the increasing adoption of this versatile chemical in various industries. Ethylene Carbonate, a vital intermediate used in the production of lithium-ion batteries, polycarbonates, and other specialty chemicals, is witnessing significant growth due to the expanding automotive industry and the rising demand for electric vehicles. According to recent reports, the automotive sector accounts for over 50% of the market share. However, the market is not without challenges. Fluctuating crude oil prices and stringent regulations, particularly in Europe and North America, pose significant hurdles. Despite these challenges, opportunities abound, with the market expected to grow steadily due to the increasing demand for lightweight and high-performance materials in various industries.
  • For instance, Ethylene Carbonate's use in the production of polycarbonates is projected to increase due to their superior thermal and electrical insulation properties. In summary, the market is a vibrant and continuously evolving sector, shaped by technological advancements, regulatory frameworks, and market trends.

What will be the Size of the Ethylene Carbonate Market during the forecast period?

Ethylene Carbonate Market Size

Get Key Insights on Market Forecast (PDF) Request Free Sample

How is the Ethylene Carbonate Market Segmented ?

The ethylene carbonate industry research report provides comprehensive data (region-wise segment analysis), with forecasts and estimates in "USD million" for the period 2024-2028, as well as historical data from 2018-2022 for the following segments.

  • Application
    • Lubricants
    • Lithium battery electrolytes
    • Solvents
    • Photochromatic
    • Others
  • Type
    • Solid
    • Liquid
  • End-User
    • Automotive
    • Electronics
    • Industrial
    • Medical
  • Geography
    • North America
      • US
      • Canada
    • Europe
      • France
      • Germany
      • Italy
      • UK
    • Middle East and Africa
      • Egypt
      • KSA
      • Oman
      • UAE
    • APAC
      • China
      • India
      • Japan
    • South America
      • Argentina
      • Brazil
    • Rest of World (ROW)

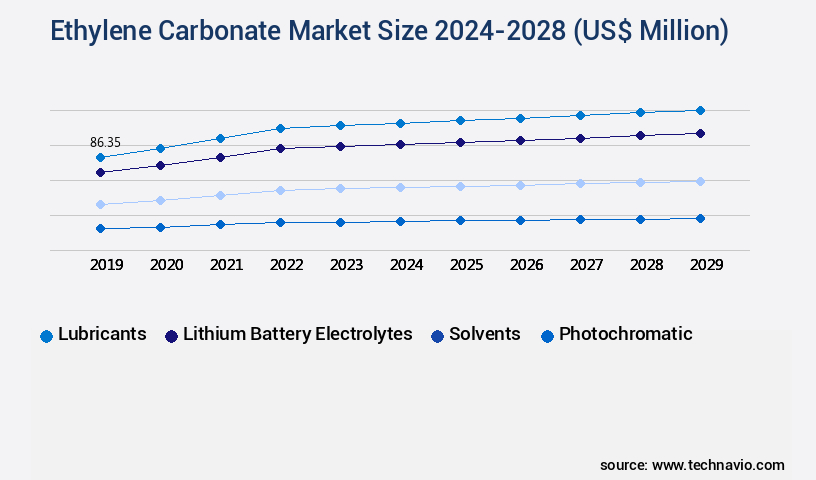
By Application Insights

The lubricants segment is estimated to witness significant growth during the forecast period.

Ethylene carbonate plays a pivotal role in various industries, particularly in enhancing the efficiency of energy consumption through its application in energy efficiency measures. In the realm of crystallization processes, ethylene carbonate is instrumental in yield improvement methods and material characterization techniques. The electrochemical synthesis of ethylene carbonate is a critical aspect of lithium-ion battery performance, ensuring quality control procedures are met. Moreover, ethylene carbonate is a vital component in the production of propylene carbonate, which finds extensive applications in solvent purification methods and reactor design considerations. Process safety protocols and chemical reaction kinetics are essential aspects of ethylene carbonate synthesis, with electrolyte conductivity testing and waste minimization strategies ensuring cost-effective production.

Industrial production scales for ethylene carbonate continue to expand, driven by the growing demand for battery electrolyte additives and polymer electrolyte applications. Homogeneous and heterogeneous catalytic processes, as well as process optimization strategies, are employed to improve reaction selectivity and environmental impact assessments. Regulatory compliance and cyclic carbonate production are also crucial factors shaping the market. According to recent industry reports, the market accounted for approximately 20% of the total carbonate market share in 2023. Furthermore, industry experts anticipate a 25% increase in ethylene carbonate demand within the next five years, primarily driven by the expanding automotive and renewable energy sectors. These trends underscore the dynamic and evolving nature of the market, making it an essential topic for businesses to stay informed about.

Ethylene Carbonate Market Size

Request Free Sample

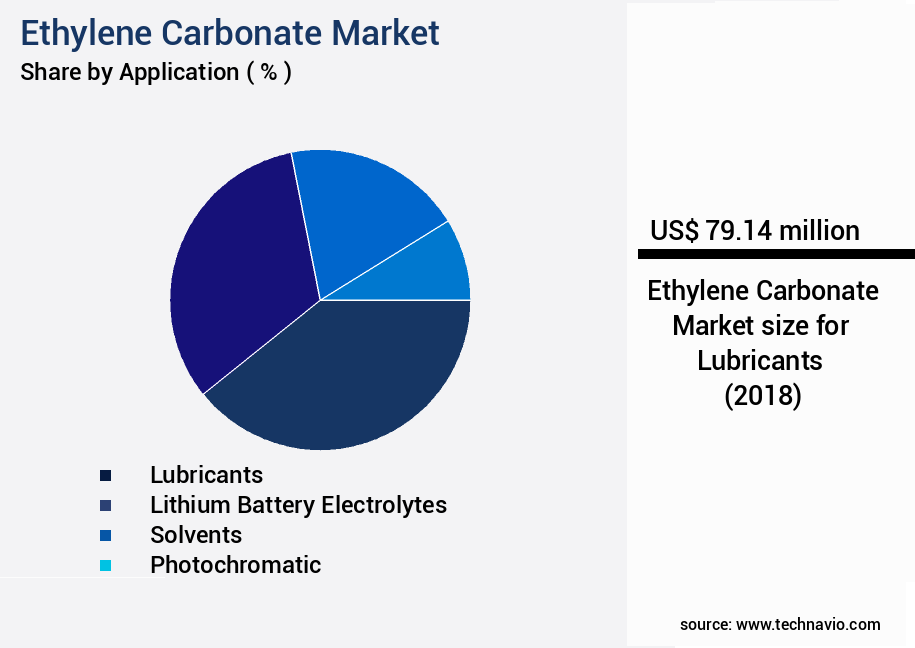
The Lubricants segment was valued at USD 79.14 million in 2018 and showed a gradual increase during the forecast period.

Ethylene Carbonate Market Size

Request Free Sample

Regional Analysis

North America is estimated to contribute 35% to the growth of the global market during the forecast period.Technavio's analysts have elaborately explained the regional trends and drivers that shape the market during the forecast period.

Ethylene Carbonate Market Share by Geography

See How Ethylene Carbonate Market Demand is Rising in North America Request Free Sample

The market in North America experiences significant growth due to its extensive applications in the automotive industry and the expanding oil and gas sector. The United States, as the largest crude oil producer in North America, produced 11.911 million barrels per day in 2022 and 9.52 million barrels per day in 2021, according to the Energy Information Administration (EIA). This increasing crude oil production fuels the demand for ethylene carbonate as a crucial intermediate in various chemical processes. Moreover, the automotive industry's continued expansion in North America is another driving factor, as ethylene carbonate is a vital component in battery electrolytes and other automotive applications.

The market's growth is expected to remain robust during the forecast period, with the rising volume of automobile production and increasing crude oil extraction contributing significantly.

Market Dynamics

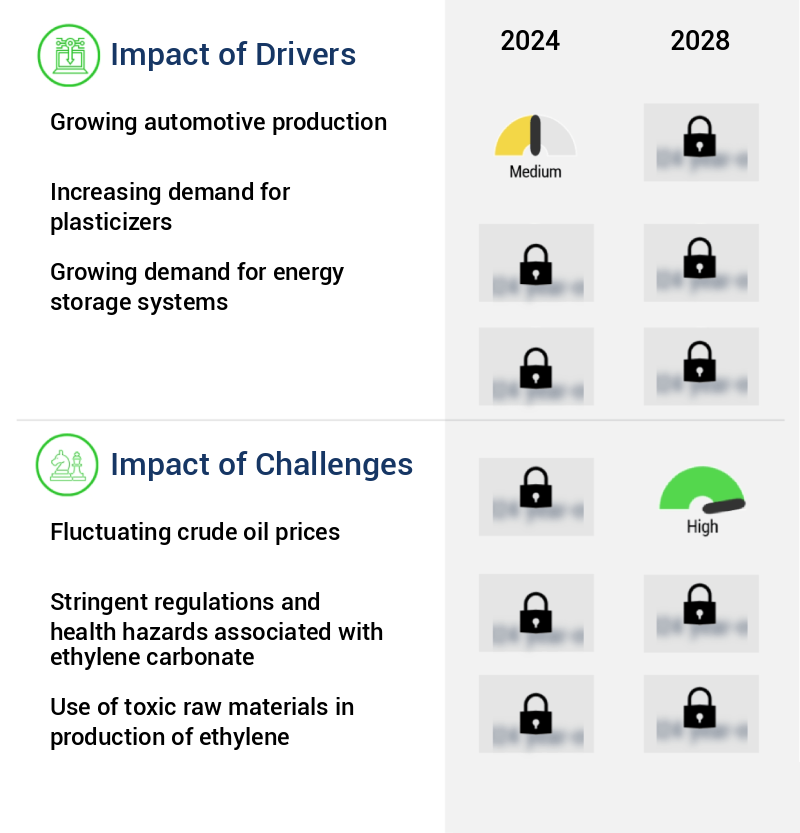
Our researchers analyzed the data with 2023 as the base year, along with the key drivers, trends, and challenges. A holistic analysis of drivers will help companies refine their marketing strategies to gain a competitive advantage.

The global ethylene carbonate market is evolving as a critical component within advanced energy storage, chemical manufacturing, and sustainable process development. Increasing demand is driven by its role in ethylene carbonate applications lithium batteries, where its high dielectric constant and stable solvent behavior significantly enhance performance metrics and cycle life. Continuous advancements in polymer electrolyte membranes ethylene carbonate are also strengthening its adoption in next-generation battery technologies. Alongside these applications, ethylene carbonate solvent properties characterization supports research into optimizing compatibility with diverse electrolytes, including propylene carbonate electrolyte formulation.

On the production side, electrochemical synthesis ethylene carbonate and green synthesis methods ethylene carbonate are receiving heightened attention, supported by catalytic conversion to ethylene carbonate and kinetic study ethylene carbonate synthesis aimed at achieving higher efficiency and selectivity. Process optimization for ethylene carbonate synthesis, combined with reactor design for ethylene carbonate production, is central to scaling manufacturing while ensuring compliance with safety protocols for ethylene carbonate handling and environmental impact of ethylene carbonate synthesis.

Data comparisons indicate that high purity ethylene carbonate production through advanced ethylene carbonate purification by distillation reduces impurity levels, leading to measurable improvements in downstream battery efficiency. At the same time, economic analysis ethylene carbonate production highlights cost reductions achieved through improved quality control in ethylene carbonate manufacturing and life cycle assessment ethylene carbonate, which demonstrates measurable sustainability benefits.

The ongoing integration of reaction mechanism ethylene carbonate synthesis insights with industrial optimization is creating new opportunities, while ethylene carbonate applications in other fields such as coatings and lubricants expand its relevance beyond energy storage. This dynamic balance between performance-driven adoption and sustainable production methods defines the forward trajectory of the market.

Ethylene Carbonate Market Size

What are the key market drivers leading to the rise in the adoption of Ethylene Carbonate Industry?

  • The significant expansion of automotive production serves as the primary catalyst for market growth. 
  • Ethylene carbonate, known for its low toxicity and high permittivity, is gaining traction as a protective surface coating in the automotive sector due to growing environmental consciousness surrounding vehicle pollution. This versatile compound is extensively used to enhance the smoothness of automobile bodies, contributing significantly to their production. Ethylene carbonate's high dielectric strength is a key factor in its adoption; it can withstand strong electric fields without conducting electricity, making it indispensable in manufacturing safety-critical parts such as spark plugs, ignition cable sets, and battery terminals.
  • The global automotive industry has witnessed a notable expansion since 2020, leading to a heightened demand for ethylene carbonate in various countries. Its unique properties offer numerous advantages, making it an essential component in the automotive industry's ongoing evolution.

What are the market trends shaping the Ethylene Carbonate Industry?

  • The increasing demand for electric vehicles represents a notable market trend. A growing number of consumers are opting for electric vehicles, shaping the automotive industry's future direction.
  • The electrification of the automobile market is gaining momentum due to increasing consumer concerns about environmental sustainability. This shift is driven by advancements in battery technology, enabling the production of electric vehicles (EVs) that offer competitive performance to conventional gasoline-powered automobiles. Companies such as Tesla Inc., BMW, and Ford are at the forefront of this trend, producing EVs that challenge their gasoline counterparts. Furthermore, manufacturers like BYD, Beijing Electric Vehicle, ZhiDou, Shanghai Auto, and Zotye are also entering the market, expanding the competitive landscape.
  • The adoption of ethylene carbonate, a high dielectric strength material, is a significant factor in this evolution. Its use in the production of spark plugs, ignition cable sets, and battery terminals ensures safety and protection against electric shock. This material's increasing utilization in the automotive industry underscores the industry's commitment to electrification and the ongoing transformation of the automobile market.

What challenges does the Ethylene Carbonate Industry face during its growth?

  • The volatility of crude oil prices poses a significant challenge to the growth of the industry. 
  • The oil and gas sector plays a pivotal role in the production of petrochemicals, with their prices significantly influenced by crude oil price fluctuations. For instance, the cost of ethylene alcohol, urea, methanol, and other petrochemicals experiences an upward trend when crude oil prices rise. This volatility poses a significant challenge for the market, compelling end-user industries to explore bio-based alternatives. In April 2020, the average crude oil price dipped to 21.04 US dollars per barrel, contrasting the November 2021 all-time high of 82.
  • The oil and gas industry's reliance on crude oil for petrochemical production and the subsequent price volatility necessitate continuous adaptation and innovation to maintain competitiveness.

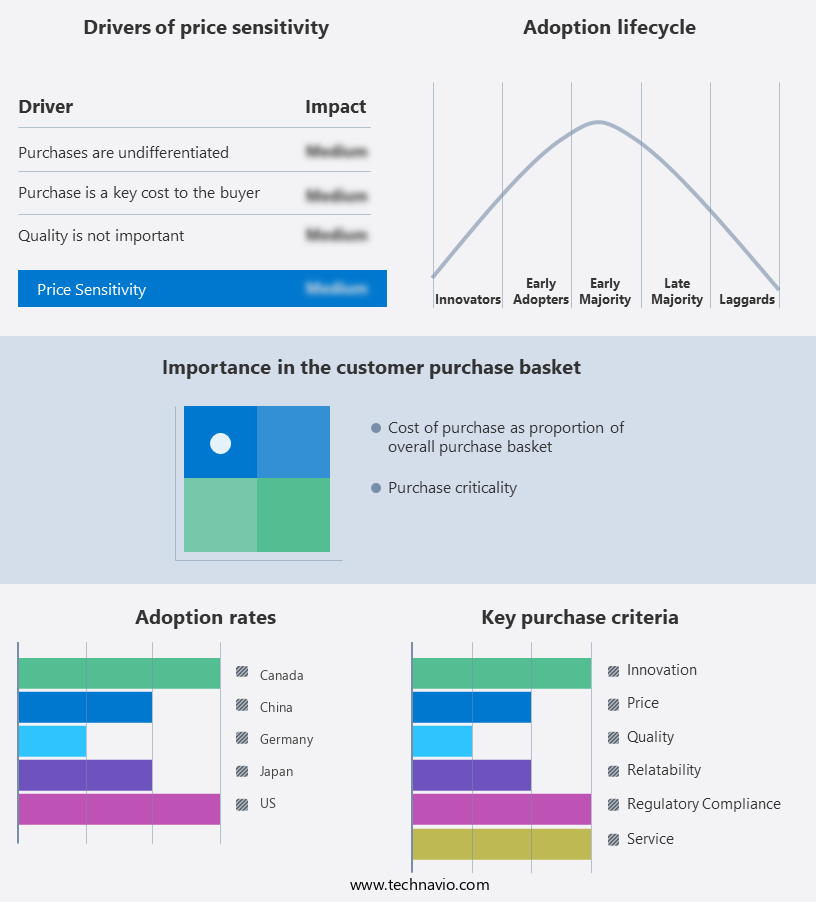
Exclusive Technavio Analysis on Customer Landscape

The ethylene carbonate market forecasting report includes the adoption lifecycle of the market, covering from the innovator's stage to the laggard's stage. It focuses on adoption rates in different regions based on penetration. Furthermore, the ethylene carbonate market report also includes key purchase criteria and drivers of price sensitivity to help companies evaluate and develop their market growth analysis strategies.

Ethylene Carbonate Market Share by Geography

 Customer Landscape of Ethylene Carbonate Industry

Competitive Landscape

Companies are implementing various strategies, such as strategic alliances, ethylene carbonate market forecast, partnerships, mergers and acquisitions, geographical expansion, and product/service launches, to enhance their presence in the industry.

Asahi Kasei - Ethylene carbonate, a versatile chemical compound, serves multiple functions in various industries. As a solvent, it is utilized in the production of polymers and resins. In plasticization, it enhances the flexibility of plastics. Additionally, it functions as an intermediate in pharmaceutical manufacturing.

The industry research and growth report includes detailed analyses of the competitive landscape of the market and information about key companies, including:

  • Asahi Kasei
  • BASF SE
  • Dongguan Kaixin Battery Material
  • Empower Materials
  • FUJIFILM Wako Pure Chemical
  • Huntsman Corporation
  • Jiangsu Huasheng Chemical
  • Liaoning Oxiranchem
  • Merck KGaA
  • Mitsubishi Chemical
  • New Japan Chemical
  • Oriental Union Chemical
  • OUCC
  • Shandong Senjie Chemical
  • Shandong Shida Shenghua
  • Shanghai Chemical International
  • Taiwan Hopax Chemicals
  • Toagosei Co.
  • Tokyo Chemical Industry

Qualitative and quantitative analysis of companies has been conducted to help clients understand the wider business environment as well as the strengths and weaknesses of key industry players. Data is qualitatively analyzed to categorize companies as pure play, category-focused, industry-focused, and diversified; it is quantitatively analyzed to categorize companies as dominant, leading, strong, tentative, and weak.

Recent Development and News in Ethylene Carbonate Market

  • In January 2024, Solvay, a global chemical company, announced the expansion of its ethylene carbonate production capacity at its site in Europe. The investment of €15 million aimed to increase production by 50%, making Solvay the largest ethylene carbonate producer in Europe (Solvay press release).
  • In March 2024, Asahi Kasei Corporation, a Japanese chemical manufacturer, and Mitsui Chemicals, Inc. Signed a strategic collaboration agreement to jointly develop and commercialize new applications for ethylene carbonate in the lithium-ion battery market (Asahi Kasei press release).
  • In April 2025, Lanxess AG, a specialty chemicals company, completed the acquisition of Chemtura Corporation's polymer additives business, which included the ethylene carbonate business. The acquisition expanded Lanxess's product portfolio and strengthened its position in The market (Lanxess press release).
  • In May 2025, the European Commission approved the use of ethylene carbonate as a solvent for the production of lithium-ion batteries, paving the way for increased adoption of this green solvent in the European battery industry (European Commission press release).

Dive into Technavio's robust research methodology, blending expert interviews, extensive data synthesis, and validated models for unparalleled Ethylene Carbonate Market insights. See full methodology.

Market Scope

Report Coverage

Details

Page number

170

Base year

2023

Historic period

2018-2022

Forecast period

2024-2028

Growth momentum & CAGR

Accelerate at a CAGR of 10.32%

Market growth 2024-2028

USD 223.48 million

Market structure

Fragmented

YoY growth 2023-2024(%)

9.96

Key countries

US, Canada, Germany, UK, Italy, France, China, India, Japan, Brazil, Egypt, UAE, Oman, Argentina, KSA, UAE, Brazil, and Rest of World (ROW)

Competitive landscape

Leading Companies, Market Positioning of Companies, Competitive Strategies, and Industry Risks

Request Free Sample

Research Analyst Overview

  • The market is a dynamic and evolving landscape, driven by continuous advancements in energy efficiency measures, crystallization processes, and yield improvement methods. One of the primary applications of ethylene carbonate is in the production of lithium-ion batteries, where it plays a crucial role in enhancing battery performance. Chemical synthesis techniques, such as electrochemical synthesis and distillation methods, are at the forefront of ethylene carbonate production. These methods enable the creation of high-quality products, ensuring regulatory compliance and maintaining product specifications. Material characterization techniques, like electrolyte conductivity testing and solvent properties analysis, are essential in optimizing production processes and improving reaction selectivity.
  • Industrial production scales have grown significantly, necessitating process safety protocols and waste minimization strategies. The integration of homogeneous and heterogeneous catalysis, phase transfer catalysis, and green chemistry synthesis has led to cost-effective production and reduced environmental impact. In the realm of battery electrolytes, ethylene carbonate is a vital additive. Its use in polymer electrolytes and safety data sheets has expanded, contributing to the growth and diversification of the market. Process modeling simulation and purification techniques have become increasingly important in ensuring the consistency and reliability of ethylene carbonate production. The market is characterized by ongoing research and development, with a focus on improving process optimization strategies, reaction kinetics, and product specifications.
  • The integration of advanced technologies and the adoption of innovative production methods are shaping the future of this dynamic market.

What are the Key Data Covered in this Ethylene Carbonate Market Research and Growth Report?

  • What is the expected growth of the Ethylene Carbonate Market between 2024 and 2028?

    • USD 223.48 million, at a CAGR of 10.32%

  • What segmentation does the market report cover?

    • The report is segmented by Application (Lubricants, Lithium battery electrolytes, Solvents, Photochromatic, and Others), Type (Solid and Liquid), Geography (North America, Europe, APAC, South America, and Middle East and Africa), and End-User (Automotive, Electronics, Industrial, and Medical)

  • Which regions are analyzed in the report?

    • North America, Europe, APAC, South America, and Middle East and Africa

  • What are the key growth drivers and market challenges?

    • Growing automotive production, Fluctuating crude oil prices

  • Who are the major players in the Ethylene Carbonate Market?

    • Asahi Kasei, BASF SE, Dongguan Kaixin Battery Material, Empower Materials, FUJIFILM Wako Pure Chemical, Huntsman Corporation, Jiangsu Huasheng Chemical, Liaoning Oxiranchem, Merck KGaA, Mitsubishi Chemical, New Japan Chemical, Oriental Union Chemical, OUCC, Shandong Senjie Chemical, Shandong Shida Shenghua, Shanghai Chemical International, Taiwan Hopax Chemicals, Toagosei Co., and Tokyo Chemical Industry

Market Research Insights

  • The market exhibits significant growth, driven by its versatile applications in various industries. According to spectroscopic analysis, ethylene carbonate's global production volume reached 100,000 metric tons in 2020, with a projected expansion to 130,000 metric tons by 2025. This growth can be attributed to the material's excellent chemical properties, including high thermal stability and carbonate esterification reactivity. Despite its advantages, ethylene carbonate's production and use involve several challenges. Degradation pathways, such as hydrolysis and oxidation, necessitate rigorous environmental management systems and risk assessment procedures. To mitigate these issues, technological advancements in process monitoring technologies, reaction mechanism elucidation, and safety engineering principles are crucial.
  • Additionally, raw material sourcing, supply chain management, and economic viability assessment are essential aspects of the market, ensuring a sustainable and efficient production process. In contrast, the market's chemical reactivity studies and chromatographic separation techniques have shown potential for improved process control systems, enabling more efficient production and reducing waste. Electrochemical oxidation and thermal stability testing are also critical for optimizing ethylene carbonate's production process and enhancing its economic viability. Ultimately, the market's continuous evolution relies on a balanced approach to technological innovation, process optimization, and environmental responsibility.

We can help! Our analysts can customize this ethylene carbonate market research report to meet your requirements.

Get in touch

1 Executive Summary

  • 1.1 Market overview
    • Exhibit 01: Executive Summary – Chart on Market Overview
    • Exhibit 02: Executive Summary – Data Table on Market Overview
    • Exhibit 03: Executive Summary – Chart on Global Market Characteristics
    • Exhibit 04: Executive Summary – Chart on Market by Geography
    • Exhibit 05: Executive Summary – Chart on Market Segmentation by Application
    • Exhibit 06: Executive Summary – Chart on Market Segmentation by Type
    • Exhibit 07: Executive Summary – Chart on Incremental Growth
    • Exhibit 08: Executive Summary – Data Table on Incremental Growth
    • Exhibit 09: Executive Summary – Chart on Vendor Market Positioning

2 Market Landscape

  • 2.1 Market ecosystem
    • Exhibit 10: Parent market
    • Exhibit 11: Market Characteristics

3 Market Sizing

  • 3.1 Market definition
    • Exhibit 12: Offerings of vendors included in the market definition
  • 3.2 Market segment analysis
    • Exhibit 13: Market segments
  • 3.3 Market size 2023
    • 3.4 Market outlook: Forecast for 2023-2028
      • Exhibit 14: Chart on Global - Market size and forecast 2023-2028 ($ million)
      • Exhibit 15: Data Table on Global - Market size and forecast 2023-2028 ($ million)
      • Exhibit 16: Chart on Global Market: Year-over-year growth 2023-2028 (%)
      • Exhibit 17: Data Table on Global Market: Year-over-year growth 2023-2028 (%)

    4 Historic Market Size

    • 4.1 Global ethylene carbonate market 2018 - 2022
      • Exhibit 18: Historic Market Size – Data Table on global ethylene carbonate market 2018 - 2022 ($ million)
    • 4.2 Application Segment Analysis 2018 - 2022
      • Exhibit 19: Historic Market Size – Application Segment 2018 - 2022 ($ million)
    • 4.3 Type Segment Analysis 2018 - 2022
      • Exhibit 20: Historic Market Size – Type Segment 2018 - 2022 ($ million)
    • 4.4 Geography Segment Analysis 2018 - 2022
      • Exhibit 21: Historic Market Size – Geography Segment 2018 - 2022 ($ million)
    • 4.5 Country Segment Analysis 2018 - 2022
      • Exhibit 22: Historic Market Size – Country Segment 2018 - 2022 ($ million)

    5 Five Forces Analysis

    • 5.1 Five forces summary
      • Exhibit 23: Five forces analysis - Comparison between 2023 and 2028
    • 5.2 Bargaining power of buyers
      • Exhibit 24: Chart on Bargaining power of buyers – Impact of key factors 2023 and 2028
    • 5.3 Bargaining power of suppliers
      • Exhibit 25: Bargaining power of suppliers – Impact of key factors in 2023 and 2028
    • 5.4 Threat of new entrants
      • Exhibit 26: Threat of new entrants – Impact of key factors in 2023 and 2028
    • 5.5 Threat of substitutes
      • Exhibit 27: Threat of substitutes – Impact of key factors in 2023 and 2028
    • 5.6 Threat of rivalry
      • Exhibit 28: Threat of rivalry – Impact of key factors in 2023 and 2028
    • 5.7 Market condition
      • Exhibit 29: Chart on Market condition - Five forces 2023 and 2028

    6 Market Segmentation by Application

    • 6.1 Market segments
      • Chart on Application - Market share (2023-2028) (%)
      • Data Table on Application - Market share (2023-2028) (%)
    • 6.2 Comparison by Application
      • Chart on Comparison by Application
      • Data Table on Comparison by Application
    • 6.3 Lubricants - Market size and forecast (2023-2028)
      • Chart on Lubricants - Market size and forecast (2023-2028) ($ million)
      • Data Table on Lubricants - Market size and forecast (2023-2028) ($ million)
      • Chart on Lubricants - Year-over-year growth (2023-2028) (%)
      • Data Table on Lubricants - Year-over-year growth (2023-2028) (%)
    • 6.4 Lithium battery electrolytes - Market size and forecast (2023-2028)
      • Chart on Lithium battery electrolytes - Market size and forecast (2023-2028) ($ million)
      • Data Table on Lithium battery electrolytes - Market size and forecast (2023-2028) ($ million)
      • Chart on Lithium battery electrolytes - Year-over-year growth (2023-2028) (%)
      • Data Table on Lithium battery electrolytes - Year-over-year growth (2023-2028) (%)
    • 6.5 Solvents - Market size and forecast (2023-2028)
      • Chart on Solvents - Market size and forecast (2023-2028) ($ million)
      • Data Table on Solvents - Market size and forecast (2023-2028) ($ million)
      • Chart on Solvents - Year-over-year growth (2023-2028) (%)
      • Data Table on Solvents - Year-over-year growth (2023-2028) (%)
    • 6.6 Photochromatic - Market size and forecast (2023-2028)
      • Chart on Photochromatic - Market size and forecast (2023-2028) ($ million)
      • Data Table on Photochromatic - Market size and forecast (2023-2028) ($ million)
      • Chart on Photochromatic - Year-over-year growth (2023-2028) (%)
      • Data Table on Photochromatic - Year-over-year growth (2023-2028) (%)
    • 6.7 Others - Market size and forecast (2023-2028)
      • Chart on Others - Market size and forecast (2023-2028) ($ million)
      • Data Table on Others - Market size and forecast (2023-2028) ($ million)
      • Chart on Others - Year-over-year growth (2023-2028) (%)
      • Data Table on Others - Year-over-year growth (2023-2028) (%)
    • 6.8 Market opportunity by Application
      • Market opportunity by Application ($ million)
      • Data Table on Market opportunity by Application ($ million)

    7 Market Segmentation by Type

    • 7.1 Market segments
      • Chart on Type - Market share (2023-2028) (%)
      • Data Table on Type - Market share (2023-2028) (%)
    • 7.2 Comparison by Type
      • Chart on Comparison by Type
      • Data Table on Comparison by Type
    • 7.3 Solid - Market size and forecast (2023-2028)
      • Chart on Solid - Market size and forecast (2023-2028) ($ million)
      • Data Table on Solid - Market size and forecast (2023-2028) ($ million)
      • Chart on Solid - Year-over-year growth (2023-2028) (%)
      • Data Table on Solid - Year-over-year growth (2023-2028) (%)
    • 7.4 Liquid - Market size and forecast (2023-2028)
      • Chart on Liquid - Market size and forecast (2023-2028) ($ million)
      • Data Table on Liquid - Market size and forecast (2023-2028) ($ million)
      • Chart on Liquid - Year-over-year growth (2023-2028) (%)
      • Data Table on Liquid - Year-over-year growth (2023-2028) (%)
    • 7.5 Market opportunity by Type
      • Market opportunity by Type ($ million)
      • Data Table on Market opportunity by Type ($ million)

    8 Market Segmentation by End-User

    • 8.1 Market segments
      • Chart on End-User - Market share (2023-2028) (%)
      • Data Table on End-User - Market share (2023-2028) (%)
    • 8.2 Comparison by End-User
      • Chart on Comparison by End-User
      • Data Table on Comparison by End-User
    • 8.3 Automotive - Market size and forecast (2023-2028)
      • Chart on Automotive - Market size and forecast (2023-2028) ($ million)
      • Data Table on Automotive - Market size and forecast (2023-2028) ($ million)
      • Chart on Automotive - Year-over-year growth (2023-2028) (%)
      • Data Table on Automotive - Year-over-year growth (2023-2028) (%)
    • 8.4 Electronics - Market size and forecast (2023-2028)
      • Chart on Electronics - Market size and forecast (2023-2028) ($ million)
      • Data Table on Electronics - Market size and forecast (2023-2028) ($ million)
      • Chart on Electronics - Year-over-year growth (2023-2028) (%)
      • Data Table on Electronics - Year-over-year growth (2023-2028) (%)
    • 8.5 Industrial - Market size and forecast (2023-2028)
      • Chart on Industrial - Market size and forecast (2023-2028) ($ million)
      • Data Table on Industrial - Market size and forecast (2023-2028) ($ million)
      • Chart on Industrial - Year-over-year growth (2023-2028) (%)
      • Data Table on Industrial - Year-over-year growth (2023-2028) (%)
    • 8.6 Medical - Market size and forecast (2023-2028)
      • Chart on Medical - Market size and forecast (2023-2028) ($ million)
      • Data Table on Medical - Market size and forecast (2023-2028) ($ million)
      • Chart on Medical - Year-over-year growth (2023-2028) (%)
      • Data Table on Medical - Year-over-year growth (2023-2028) (%)
    • 8.7 Market opportunity by End-User
      • Market opportunity by End-User ($ million)
      • Data Table on Market opportunity by End-User ($ million)

    8 Customer Landscape

    • 8.1 Customer landscape overview
      • Exhibit 70: Analysis of price sensitivity, lifecycle, customer purchase basket, adoption rates, and purchase criteria

    9 Geographic Landscape

    • 9.1 Geographic segmentation
      • Exhibit 71: Chart on Market share by geography 2023-2028 (%)
      • Exhibit 72: Data Table on Market share by geography 2023-2028 (%)
    • 9.2 Geographic comparison
      • Exhibit 73: Chart on Geographic comparison
      • Exhibit 74: Data Table on Geographic comparison
    • 9.3 North America - Market size and forecast 2023-2028
      • Exhibit 75: Chart on North America - Market size and forecast 2023-2028 ($ million)
      • Exhibit 76: Data Table on North America - Market size and forecast 2023-2028 ($ million)
      • Exhibit 77: Chart on North America - Year-over-year growth 2023-2028 (%)
      • Exhibit 78: Data Table on North America - Year-over-year growth 2023-2028 (%)
    • 9.4 Europe - Market size and forecast 2023-2028
      • Exhibit 79: Chart on Europe - Market size and forecast 2023-2028 ($ million)
      • Exhibit 80: Data Table on Europe - Market size and forecast 2023-2028 ($ million)
      • Exhibit 81: Chart on Europe - Year-over-year growth 2023-2028 (%)
      • Exhibit 82: Data Table on Europe - Year-over-year growth 2023-2028 (%)
    • 9.5 APAC - Market size and forecast 2023-2028
      • Exhibit 83: Chart on APAC - Market size and forecast 2023-2028 ($ million)
      • Exhibit 84: Data Table on APAC - Market size and forecast 2023-2028 ($ million)
      • Exhibit 85: Chart on APAC - Year-over-year growth 2023-2028 (%)
      • Exhibit 86: Data Table on APAC - Year-over-year growth 2023-2028 (%)
    • 9.6 South America - Market size and forecast 2023-2028
      • Exhibit 87: Chart on South America - Market size and forecast 2023-2028 ($ million)
      • Exhibit 88: Data Table on South America - Market size and forecast 2023-2028 ($ million)
      • Exhibit 89: Chart on South America - Year-over-year growth 2023-2028 (%)
      • Exhibit 90: Data Table on South America - Year-over-year growth 2023-2028 (%)
    • 9.7 Middle East and Africa - Market size and forecast 2023-2028
      • Exhibit 91: Chart on Middle East and Africa - Market size and forecast 2023-2028 ($ million)
      • Exhibit 92: Data Table on Middle East and Africa - Market size and forecast 2023-2028 ($ million)
      • Exhibit 93: Chart on Middle East and Africa - Year-over-year growth 2023-2028 (%)
      • Exhibit 94: Data Table on Middle East and Africa - Year-over-year growth 2023-2028 (%)
    • 9.8 US - Market size and forecast 2023-2028
      • Exhibit 95: Chart on US - Market size and forecast 2023-2028 ($ million)
      • Exhibit 96: Data Table on US - Market size and forecast 2023-2028 ($ million)
      • Exhibit 97: Chart on US - Year-over-year growth 2023-2028 (%)
      • Exhibit 98: Data Table on US - Year-over-year growth 2023-2028 (%)
    • 9.9 China - Market size and forecast 2023-2028
      • Exhibit 99: Chart on China - Market size and forecast 2023-2028 ($ million)
      • Exhibit 100: Data Table on China - Market size and forecast 2023-2028 ($ million)
      • Exhibit 101: Chart on China - Year-over-year growth 2023-2028 (%)
      • Exhibit 102: Data Table on China - Year-over-year growth 2023-2028 (%)
    • 9.10 Germany - Market size and forecast 2023-2028
      • Exhibit 103: Chart on Germany - Market size and forecast 2023-2028 ($ million)
      • Exhibit 104: Data Table on Germany - Market size and forecast 2023-2028 ($ million)
      • Exhibit 105: Chart on Germany - Year-over-year growth 2023-2028 (%)
      • Exhibit 106: Data Table on Germany - Year-over-year growth 2023-2028 (%)
    • 9.11 Japan - Market size and forecast 2023-2028
      • Exhibit 107: Chart on Japan - Market size and forecast 2023-2028 ($ million)
      • Exhibit 108: Data Table on Japan - Market size and forecast 2023-2028 ($ million)
      • Exhibit 109: Chart on Japan - Year-over-year growth 2023-2028 (%)
      • Exhibit 110: Data Table on Japan - Year-over-year growth 2023-2028 (%)
    • 9.12 Canada - Market size and forecast 2023-2028
      • Exhibit 111: Chart on Canada - Market size and forecast 2023-2028 ($ million)
      • Exhibit 112: Data Table on Canada - Market size and forecast 2023-2028 ($ million)
      • Exhibit 113: Chart on Canada - Year-over-year growth 2023-2028 (%)
      • Exhibit 114: Data Table on Canada - Year-over-year growth 2023-2028 (%)
    • 9.13 Market opportunity by geography
      • Exhibit 115: Market opportunity by geography ($ million)
      • Exhibit 116: Data Tables on Market opportunity by geography ($ million)
    • 10.14 UK - Market size and forecast (2023-2028)
      • Chart on UK - Market size and forecast (2023-2028) ($ million)
      • Data Table on UK - Market size and forecast (2023-2028) ($ million)
      • Chart on UK - Year-over-year growth (2023-2028) (%)
      • Data Table on UK - Year-over-year growth (2023-2028) (%)
    • 10.15 Italy - Market size and forecast (2023-2028)
      • Chart on Italy - Market size and forecast (2023-2028) ($ million)
      • Data Table on Italy - Market size and forecast (2023-2028) ($ million)
      • Chart on Italy - Year-over-year growth (2023-2028) (%)
      • Data Table on Italy - Year-over-year growth (2023-2028) (%)
    • 10.16 France - Market size and forecast (2023-2028)
      • Chart on France - Market size and forecast (2023-2028) ($ million)
      • Data Table on France - Market size and forecast (2023-2028) ($ million)
      • Chart on France - Year-over-year growth (2023-2028) (%)
      • Data Table on France - Year-over-year growth (2023-2028) (%)
    • 10.17 India - Market size and forecast (2023-2028)
      • Chart on India - Market size and forecast (2023-2028) ($ million)
      • Data Table on India - Market size and forecast (2023-2028) ($ million)
      • Chart on India - Year-over-year growth (2023-2028) (%)
      • Data Table on India - Year-over-year growth (2023-2028) (%)
    • 10.18 Brazil - Market size and forecast (2023-2028)
      • Chart on Brazil - Market size and forecast (2023-2028) ($ million)
      • Data Table on Brazil - Market size and forecast (2023-2028) ($ million)
      • Chart on Brazil - Year-over-year growth (2023-2028) (%)
      • Data Table on Brazil - Year-over-year growth (2023-2028) (%)
    • 10.19 Egypt - Market size and forecast (2023-2028)
      • Chart on Egypt - Market size and forecast (2023-2028) ($ million)
      • Data Table on Egypt - Market size and forecast (2023-2028) ($ million)
      • Chart on Egypt - Year-over-year growth (2023-2028) (%)
      • Data Table on Egypt - Year-over-year growth (2023-2028) (%)
    • 10.20 UAE - Market size and forecast (2023-2028)
      • Chart on UAE - Market size and forecast (2023-2028) ($ million)
      • Data Table on UAE - Market size and forecast (2023-2028) ($ million)
      • Chart on UAE - Year-over-year growth (2023-2028) (%)
      • Data Table on UAE - Year-over-year growth (2023-2028) (%)
    • 10.21 Oman - Market size and forecast (2023-2028)
      • Chart on Oman - Market size and forecast (2023-2028) ($ million)
      • Data Table on Oman - Market size and forecast (2023-2028) ($ million)
      • Chart on Oman - Year-over-year growth (2023-2028) (%)
      • Data Table on Oman - Year-over-year growth (2023-2028) (%)
    • 10.22 Argentina - Market size and forecast (2023-2028)
      • Chart on Argentina - Market size and forecast (2023-2028) ($ million)
      • Data Table on Argentina - Market size and forecast (2023-2028) ($ million)
      • Chart on Argentina - Year-over-year growth (2023-2028) (%)
      • Data Table on Argentina - Year-over-year growth (2023-2028) (%)
    • 10.23 KSA - Market size and forecast (2023-2028)
      • Chart on KSA - Market size and forecast (2023-2028) ($ million)
      • Data Table on KSA - Market size and forecast (2023-2028) ($ million)
      • Chart on KSA - Year-over-year growth (2023-2028) (%)
      • Data Table on KSA - Year-over-year growth (2023-2028) (%)
    • 10.24 UAE - Market size and forecast (2023-2028)
      • Chart on UAE - Market size and forecast (2023-2028) ($ million)
      • Data Table on UAE - Market size and forecast (2023-2028) ($ million)
      • Chart on UAE - Year-over-year growth (2023-2028) (%)
      • Data Table on UAE - Year-over-year growth (2023-2028) (%)
    • 10.25 Brazil - Market size and forecast (2023-2028)
      • Chart on Brazil - Market size and forecast (2023-2028) ($ million)
      • Data Table on Brazil - Market size and forecast (2023-2028) ($ million)
      • Chart on Brazil - Year-over-year growth (2023-2028) (%)
      • Data Table on Brazil - Year-over-year growth (2023-2028) (%)
    • 10.26 Rest of World (ROW) - Market size and forecast (2023-2028)
      • Chart on Rest of World (ROW) - Market size and forecast (2023-2028) ($ million)
      • Data Table on Rest of World (ROW) - Market size and forecast (2023-2028) ($ million)
      • Chart on Rest of World (ROW) - Year-over-year growth (2023-2028) (%)
      • Data Table on Rest of World (ROW) - Year-over-year growth (2023-2028) (%)

    10 Drivers, Challenges, and Trends

    • 10.1 Market drivers
      • 10.2 Market challenges
        • 10.3 Impact of drivers and challenges
          • Exhibit 117: Impact of drivers and challenges in 2023 and 2028
        • 10.4 Market trends

          11 Vendor Landscape

          • 11.1 Overview
            • 11.2 Vendor landscape
              • Exhibit 118: Overview on Criticality of inputs and Factors of differentiation
            • 11.3 Landscape disruption
              • Exhibit 119: Overview on factors of disruption
            • 11.4 Industry risks
              • Exhibit 120: Impact of key risks on business

            13 Competitive Analysis

            • 13.1 Companies profiled
              • Companies covered
            • 13.2 Market positioning of companies
              • Matrix on companies position and classification
            • 13.3 Asahi Kasei
              • Asahi Kasei - Overview
              • Asahi Kasei - Product / Service
              • Asahi Kasei - Key offerings
            • 13.4 BASF SE
              • BASF SE - Overview
              • BASF SE - Product / Service
              • BASF SE - Key offerings
            • 13.5 Dongguan Kaixin Battery Material
              • Dongguan Kaixin Battery Material - Overview
              • Dongguan Kaixin Battery Material - Product / Service
              • Dongguan Kaixin Battery Material - Key offerings
            • 13.6 Empower Materials
              • Empower Materials - Overview
              • Empower Materials - Product / Service
              • Empower Materials - Key offerings
            • 13.7 FUJIFILM Wako Pure Chemical
              • FUJIFILM Wako Pure Chemical - Overview
              • FUJIFILM Wako Pure Chemical - Product / Service
              • FUJIFILM Wako Pure Chemical - Key offerings
            • 13.8 Huntsman Corporation
              • Huntsman Corporation - Overview
              • Huntsman Corporation - Product / Service
              • Huntsman Corporation - Key offerings
            • 13.9 Jiangsu Huasheng Chemical
              • Jiangsu Huasheng Chemical - Overview
              • Jiangsu Huasheng Chemical - Product / Service
              • Jiangsu Huasheng Chemical - Key offerings
            • 13.10 Liaoning Oxiranchem
              • Liaoning Oxiranchem - Overview
              • Liaoning Oxiranchem - Product / Service
              • Liaoning Oxiranchem - Key offerings
            • 13.11 Merck KGaA
              • Merck KGaA - Overview
              • Merck KGaA - Product / Service
              • Merck KGaA - Key offerings
            • 13.12 Mitsubishi Chemical
              • Mitsubishi Chemical - Overview
              • Mitsubishi Chemical - Product / Service
              • Mitsubishi Chemical - Key offerings
            • 13.13 New Japan Chemical
              • New Japan Chemical - Overview
              • New Japan Chemical - Product / Service
              • New Japan Chemical - Key offerings
            • 13.14 Oriental Union Chemical
              • Oriental Union Chemical - Overview
              • Oriental Union Chemical - Product / Service
              • Oriental Union Chemical - Key offerings
            • 13.15 OUCC
              • OUCC - Overview
              • OUCC - Product / Service
              • OUCC - Key offerings
            • 13.16 Shandong Senjie Chemical
              • Shandong Senjie Chemical - Overview
              • Shandong Senjie Chemical - Product / Service
              • Shandong Senjie Chemical - Key offerings
            • 13.17 Shandong Shida Shenghua
              • Shandong Shida Shenghua - Overview
              • Shandong Shida Shenghua - Product / Service
              • Shandong Shida Shenghua - Key offerings
            • 13.18 Shanghai Chemical International
              • Shanghai Chemical International - Overview
              • Shanghai Chemical International - Product / Service
              • Shanghai Chemical International - Key offerings
            • 13.19 Taiwan Hopax Chemicals
              • Taiwan Hopax Chemicals - Overview
              • Taiwan Hopax Chemicals - Product / Service
              • Taiwan Hopax Chemicals - Key offerings
            • 13.20 Toagosei Co.
              • Toagosei Co. - Overview
              • Toagosei Co. - Product / Service
              • Toagosei Co. - Key offerings
            • 13.21 Tokyo Chemical Industry
              • Tokyo Chemical Industry - Overview
              • Tokyo Chemical Industry - Product / Service
              • Tokyo Chemical Industry - Key offerings
            • 13.22 Actylis
              • Actylis - Overview
              • Actylis - Product / Service
              • Actylis - Key offerings
            • 13.23 Asahi Kasei Corp.
              • Asahi Kasei Corp. - Overview
              • Asahi Kasei Corp. - Product / Service
              • Asahi Kasei Corp. - Key offerings
            • 13.24 ATAMAN Kimya AS
              • ATAMAN Kimya AS - Overview
              • ATAMAN Kimya AS - Product / Service
              • ATAMAN Kimya AS - Key offerings
            • 13.25 BASF SE
              • BASF SE - Overview
              • BASF SE - Product / Service
              • BASF SE - Key offerings
            • 13.26 Ereztech LLC
              • Ereztech LLC - Overview
              • Ereztech LLC - Product / Service
              • Ereztech LLC - Key offerings
            • 13.27 FUJIFILM Holdings Corp.
              • FUJIFILM Holdings Corp. - Overview
              • FUJIFILM Holdings Corp. - Product / Service
              • FUJIFILM Holdings Corp. - Key offerings
            • 13.28 Haihang Industry Co. Ltd.
              • Haihang Industry Co. Ltd. - Overview
              • Haihang Industry Co. Ltd. - Product / Service
              • Haihang Industry Co. Ltd. - Key offerings
            • 13.29 Merck KGaA
              • Merck KGaA - Overview
              • Merck KGaA - Product / Service
              • Merck KGaA - Key offerings
            • 13.30 Mitsubishi Chemical Group Corp.
              • Mitsubishi Chemical Group Corp. - Overview
              • Mitsubishi Chemical Group Corp. - Product / Service
              • Mitsubishi Chemical Group Corp. - Key offerings
            • 13.31 National Analytical Corp.
              • National Analytical Corp. - Overview
              • National Analytical Corp. - Product / Service
              • National Analytical Corp. - Key offerings
            • 13.32 Oriental Union Chemical Corp.
              • Oriental Union Chemical Corp. - Overview
              • Oriental Union Chemical Corp. - Product / Service
              • Oriental Union Chemical Corp. - Key offerings
            • 13.33 Otto Chemie Pvt. Ltd.
              • Otto Chemie Pvt. Ltd. - Overview
              • Otto Chemie Pvt. Ltd. - Product / Service
              • Otto Chemie Pvt. Ltd. - Key offerings
            • 13.34 Shandong Lixing Advanced Material Co. Ltd.
              • Shandong Lixing Advanced Material Co. Ltd. - Overview
              • Shandong Lixing Advanced Material Co. Ltd. - Product / Service
              • Shandong Lixing Advanced Material Co. Ltd. - Key offerings
            • 13.35 Toagosei Co. Ltd.
              • Toagosei Co. Ltd. - Overview
              • Toagosei Co. Ltd. - Product / Service
              • Toagosei Co. Ltd. - Key offerings
            • 13.36 Tokyo Chemical Industry Co. Ltd.
              • Tokyo Chemical Industry Co. Ltd. - Overview
              • Tokyo Chemical Industry Co. Ltd. - Product / Service
              • Tokyo Chemical Industry Co. Ltd. - Key offerings
            • 13.37 Vizag Chemical International
              • Vizag Chemical International - Overview
              • Vizag Chemical International - Product / Service
              • Vizag Chemical International - Key offerings
            • 13.38 Zhengzhou Alfa Chemical Co. Ltd.
              • Zhengzhou Alfa Chemical Co. Ltd. - Overview
              • Zhengzhou Alfa Chemical Co. Ltd. - Product / Service
              • Zhengzhou Alfa Chemical Co. Ltd. - Key offerings
            • 13.39 Zhengzhou Meiya Chemical Products Co. Ltd.
              • Zhengzhou Meiya Chemical Products Co. Ltd. - Overview
              • Zhengzhou Meiya Chemical Products Co. Ltd. - Product / Service
              • Zhengzhou Meiya Chemical Products Co. Ltd. - Key offerings
            • 13.40 Spectrum Laboratory Products Inc.
              • Spectrum Laboratory Products Inc. - Overview
              • Spectrum Laboratory Products Inc. - Product / Service
              • Spectrum Laboratory Products Inc. - Key offerings
            • 13.41 Huntsman International LLC
              • Huntsman International LLC - Overview
              • Huntsman International LLC - Product / Service
              • Huntsman International LLC - Key offerings

            13 Appendix

            • 13.1 Scope of the report
              • 13.2 Inclusions and exclusions checklist
                • Exhibit 179: Inclusions checklist
                • Exhibit 180: Exclusions checklist
              • 13.3 Currency conversion rates for US$
                • Exhibit 181: Currency conversion rates for US$
              • 13.4 Research methodology
                • Exhibit 182: Research methodology
                • Exhibit 183: Validation techniques employed for market sizing
                • Exhibit 184: Information sources
              • 13.5 List of abbreviations
                • Exhibit 185: List of abbreviations

              Research Methodology

              Technavio presents a detailed picture of the market by way of study, synthesis, and summation of data from multiple sources. The analysts have presented the various facets of the market with a particular focus on identifying the key industry influencers. The data thus presented is comprehensive, reliable, and the result of extensive research, both primary and secondary.

              INFORMATION SOURCES

              Primary sources

              • Manufacturers and suppliers
              • Channel partners
              • Industry experts
              • Strategic decision makers

              Secondary sources

              • Industry journals and periodicals
              • Government data
              • Financial reports of key industry players
              • Historical data
              • Press releases

              DATA ANALYSIS

              Data Synthesis

              • Collation of data
              • Estimation of key figures
              • Analysis of derived insights

              Data Validation

              • Triangulation with data models
              • Reference against proprietary databases
              • Corroboration with industry experts

              REPORT WRITING

              Qualitative

              • Market drivers
              • Market challenges
              • Market trends
              • Five forces analysis

              Quantitative

              • Market size and forecast
              • Market segmentation
              • Geographical insights
              • Competitive landscape

              Interested in this report?

              Get your sample now to see our research methodology and insights!

              Download Now

              Frequently Asked Questions

              Ethylene Carbonate market growth will increase by $ 223.48 mn during 2024-2028.

              The Ethylene Carbonate market is expected to grow at a CAGR of 10.32% during 2024-2028.

              Ethylene Carbonate market is segmented by Application( Lubricants, Lithium battery electrolytes, Solvents, Photochromatic, Others) Type( Solid, Liquid, Europe, MEA, South America)

              Asahi Kasei, BASF SE, Dongguan Kaixin Battery Material, Empower Materials, FUJIFILM Wako Pure Chemical, Huntsman Corporation, Jiangsu Huasheng Chemical, Liaoning Oxiranchem, Merck KGaA, Mitsubishi Chemical, New Japan Chemical, Oriental Union Chemical, OUCC, Shandong Senjie Chemical, Shandong Shida Shenghua, Shanghai Chemical International, Taiwan Hopax Chemicals, Toagosei Co., Tokyo Chemical Industry are a few of the key vendors in the Ethylene Carbonate market.

              North America will register the highest growth rate of 35% among the other regions. Therefore, the Ethylene Carbonate market in North America is expected to garner significant business opportunities for the vendors during the forecast period.

              US, Canada, Germany, UK, Italy, France, China, India, Japan, Brazil, Egypt, UAE, Oman, Argentina, KSA, UAE, Brazil, Rest of World (ROW)

              • Growing automotive productionOwing to its superior properties is the driving factor this market.
              • including low toxicity and high permittivity is the driving factor this market.
              • ethylene carbonate is increasingly being used as a protective surface coating on vehicles in response to rising environmental concerns regarding vehicle pollution. Large quantities of ethylene carbonate are used to improve the smoothness of automobile bodies. Ethylene carbonate has high dielectric strength is the driving factor this market.
              • that is is the driving factor this market.
              • it can withstand high electric field without becoming electrically conductive is the driving factor this market.
              • and its application has increased in the automotive industry to ensure safety and protection against electric shock in the production of parts such as spark plugs is the driving factor this market.
              • ignition cable sets is the driving factor this market.
              • and battery terminals. The sales of automobiles have increased from 2020 in various countries globally. For example is the driving factor this market.
              • sales of cars is the driving factor this market.
              • sedans is the driving factor this market.
              • and utility vehicles in India reached a record 4 million units in 2023 is the driving factor this market.
              • which is an increase of 8.2 percent from 2022. Moreover is the driving factor this market.
              • according to a report by Chinas Association of Automobile Manufacturers is the driving factor this market.
              • sales of vehicles in China in 2023 increased by 12% to 30 is the driving factor this market.
              • 1 million vehicles from 2021. This rise in the production of automobiles will thereby drive the demand for ethylene carbonate. Additionally is the driving factor this market.
              • ethylene carbonate is used to clean and cool the engine of a vehicle. In addition is the driving factor this market.
              • China is the driving factor this market.
              • Germany is the driving factor this market.
              • India is the driving factor this market.
              • France is the driving factor this market.
              • Italy is the driving factor this market.
              • South Korea is the driving factor this market.
              • Japan is the driving factor this market.
              • and the United States use ethylene carbonate in automobiles as a protective coating and lubricant. These nations are global manufacturing powerhouses for the automobile industry. Consequently is the driving factor this market.
              • the increasing production of automobiles will drive the growth of the global ethylene carbonate market over the forecast period. is the driving factor this market.

              The Ethylene Carbonate market vendors should focus on grabbing business opportunities from the Lubricants segment as it accounted for the largest market share in the base year.
              RIA - Research AI Assistant
              Ask RIA