Ethylene Market Analysis, Size, and Forecast 2025-2029: APAC (China, India, Japan), North America (US and Canada), Middle East and Africa (UAE), Europe (France, Germany, UK), and South America (Brazil)

Ethylene Market Analysis, Size, and Forecast 2025-2029:
APAC (China, India, Japan), North America (US and Canada), Middle East and Africa (UAE), Europe (France, Germany, UK), and South America (Brazil)

Published: Jan 2025 223 Pages SKU: IRTNTR72622

Market Overview at a Glance

$63.3 B
Market Opportunity
6.5%
CAGR
5.9
YoY growth 2024-2025(%)

Ethylene Market Size 2025-2029

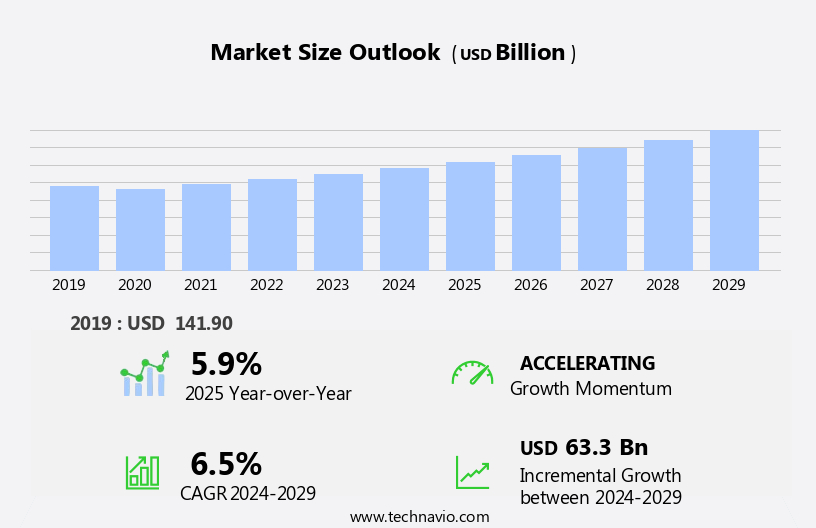
The ethylene market size is forecast to increase by USD 63.3 billion at a CAGR of 6.5% between 2024 and 2029.

  • The market is experiencing significant growth driven by the increasing demand for polyethylene products across various industries, including packaging, construction, and automotive. This trend is expected to continue as ethylene-derived plastics offer advantages such as durability, lightweight, and cost-effectiveness. However, market dynamics are influenced by the emergence of bio-ethylene, a sustainable alternative to traditional ethylene derived from fossil fuels. This shift towards renewable sources presents both opportunities and challenges for market participants.
  • On the one hand, bio-ethylene offers a more sustainable production process and potential cost savings through government incentives and carbon credits. On the other hand, the production of bio-ethylene is currently more expensive than traditional ethylene, and scaling up production remains a significant challenge. Additionally, volatility in raw material prices, particularly for natural gas and crude oil, continues to impact the market's profitability and strategic planning. Companies seeking to capitalize on market opportunities and navigate challenges effectively must stay informed of these trends and be agile in their business strategies.

What will be the Size of the Ethylene Market during the forecast period?

Ethylene Market Size

 Request Free Sample

  • The market encompasses the production, trade, and application of ethylene, a colorless, flammable organic compound. Ethylene is a key petrochemical derivative and the primary building block for various ethylene-based derivatives, including polyethylene (PE), ethylene oxide, ethylene glycol, high-density polyethylene (HDPE), and low-density polyethylene (LDPE). These materials are widely used in various industries, including construction, flexible packaging, and the production of bio-based products, lightweight plastics, and market derivatives. The market size is substantial, driven by the increasing demand for ethylene-based derivatives in consumer goods, food, beverages, medications, and various industrial applications. The market's growth is influenced by factors such as the availability of shale oil output, which has led to increased ethylene production capacity.
  • Additionally, the shift towards sustainable and eco-friendly alternatives, such as bio-polyethylene, is gaining momentum due to growing concerns about carbon footprint and the need for improved barrier qualities in packaging materials. Overall, the market is expected to continue its strong growth trajectory, driven by the diverse applications and demand for ethylene-based derivatives in various industries.

How is this Ethylene Industry segmented?

The ethylene industry research report provides comprehensive data (region-wise segment analysis), with forecasts and estimates in "USD billion" for the period 2025-2029, as well as historical data from 2019-2023 for the following segments.
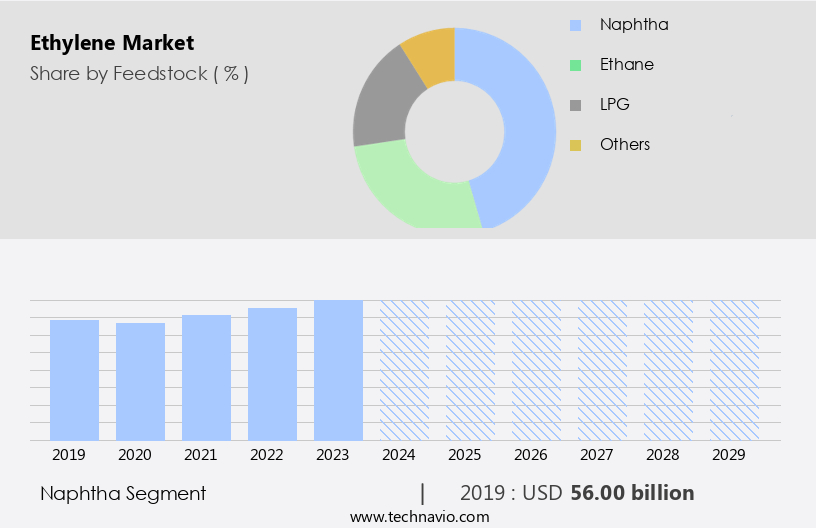
  • Feedstock
    • Naphtha
    • Ethane
    • LPG
    • Others
  • Application
    • LDPE
    • HDPE
    • Ethylene oxide
    • Vinyls
    • Others
  • Packaging
    • Automotive
    • Building & Construction
    • Agrochemical
    • Textile
    • Chemicals
    • Others
  • Geography
    • APAC
      • China
      • India
      • Japan
    • North America
      • US
      • Canada
    • Middle East and Africa
      • UAE
    • Europe
      • France
      • Germany
      • UK
    • South America
      • Brazil
    • Rest of World (ROW)

By Feedstock Insights

The naphtha segment is estimated to witness significant growth during the forecast period. Ethylene is a colorless, flammable organic compound used extensively as a raw material in the production of various plastics and petrochemical derivatives. The largest source of ethylene is naphtha, which accounted for over half of the global ethylene production in 2024. However, the naphtha segment is expected to lose market share due to its energy-intensive production process, which results in significant carbon emissions. One kilogram of ethylene production emits approximately 1.8-2 kilograms of carbon dioxide. Europe and APAC are the leading regions in naphtha-based ethylene production. Ethylene is a key ingredient in the production of polyethylene, ethylene glycol, high-density polyethylene (HDPE), low-density polyethylene (LDPE), vinyl acetate, and various ethylene-based derivatives.

Ethylene Market Size

Get a glance at the market report of share of various segments Request Free Sample

The naphtha segment was valued at USD 56.00 billion in 2019 and showed a gradual increase during the forecast period.

Regional Analysis

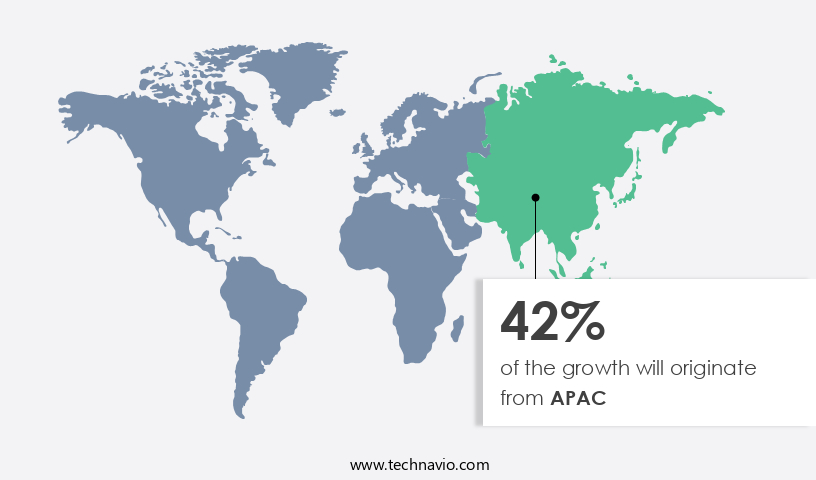
APAC is estimated to contribute 42% to the growth of the global market during the forecast period. Technavio's analysts have elaborately explained the regional trends and drivers that shape the market during the forecast period.

Ethylene Market Share by Geography

For more insights on the market size of various regions, Request Free Sample

Ethylene, a colorless and flammable organic compound, is a key petrochemical feedstock and chemical intermediate. It is extensively used in the production of polyethylene, ethylene glycol, and various ethylene-based derivatives such as high-density polyethylene (HDPE), low-density polyethylene (LDPE), vinyl acetate, and ethylene vinyl acetate. Ethylene is also used in the production of plastics, agrochemicals, textiles, and agrochemicals. The Asia Pacific (APAC) region is the largest market for ethylene, driven by the increasing use of plastic in packaging and construction industries in countries like China, India, South Korea, Singapore, Malaysia, and Japan. The growth of the retail and e-commerce industries in the region is a significant factor fueling the demand for packaging solutions.

Market Dynamics

Our researchers analyzed the data with 2024 as the base year, along with the key drivers, trends, and challenges. A holistic analysis of drivers will help companies refine their marketing strategies to gain a competitive advantage.

What are the key market drivers leading to the rise in the adoption of Ethylene Industry?

  • Increasing demand for polyethylene products from various industries is the key driver of the market.  The market is driven by the expanding demand for polyethylene products across various industries, including consumer electronics, construction, and automotive. Ethylene is a crucial component in producing HDPE, LDPE, and LLDPE, which are extensively used in manufacturing these products. 
  • The global plastic industry is experiencing significant growth, with China and India being the leading consumers. In India, the demand for plastics is primarily driven by the electronics sector, which is projected to expand at an annual rate of 17%. Factors such as increasing purchasing power, high penetration of electronic products, and rapid technological advancements are fueling this growth. The market is poised to benefit from this increasing demand for plastics, particularly in the electronics industry.

What are the market trends shaping the Ethylene Industry?

  • Emergence of bio-ethylene is the upcoming market trend. Ethylene is a fundamental organic commodity chemical with significant applications as a feedstock for various downstream chemical products, particularly in the production of plastics. As the largest bulk chemical by volume in this sector, ethylene's market dynamics are influenced by the price fluctuations of crude oil and the depletion of fossil fuel resources. 
  • To mitigate these challenges, researchers and manufacturers are exploring alternative feedstocks for ethylene production, such as bio-ethanol. The US and Brazil, as major producers of bio-ethanol derived from corn and sugarcane, respectively, account for an 87% share of the global bio-ethanol production. Additionally, lignocellulosic biomass from wood and straw can also be utilized to produce bio-ethanol, contributing to the ongoing research and development efforts in this area.

What challenges does the Ethylene Industry face during its growth?

  • Volatility in raw material prices is a key challenge affecting the industry growth. Ethylene, a critical building block in the production of various polymers and elastomers, is manufactured from ethane, naphtha, LPG, and other compounds. The price volatility of these raw materials, directly linked to natural gas and crude oil, poses significant challenges for ethylene manufacturers. 
  • Crude oil prices are influenced by the demand-supply imbalance and geopolitical instability in major oil-producing regions. Global natural gas prices in the overseas market are determined by production levels, economic conditions of producing countries, and import/export prices. These factors contribute to the unpredictability in the market, necessitating strategic planning and adaptability for manufacturers.

Exclusive Customer Landscape

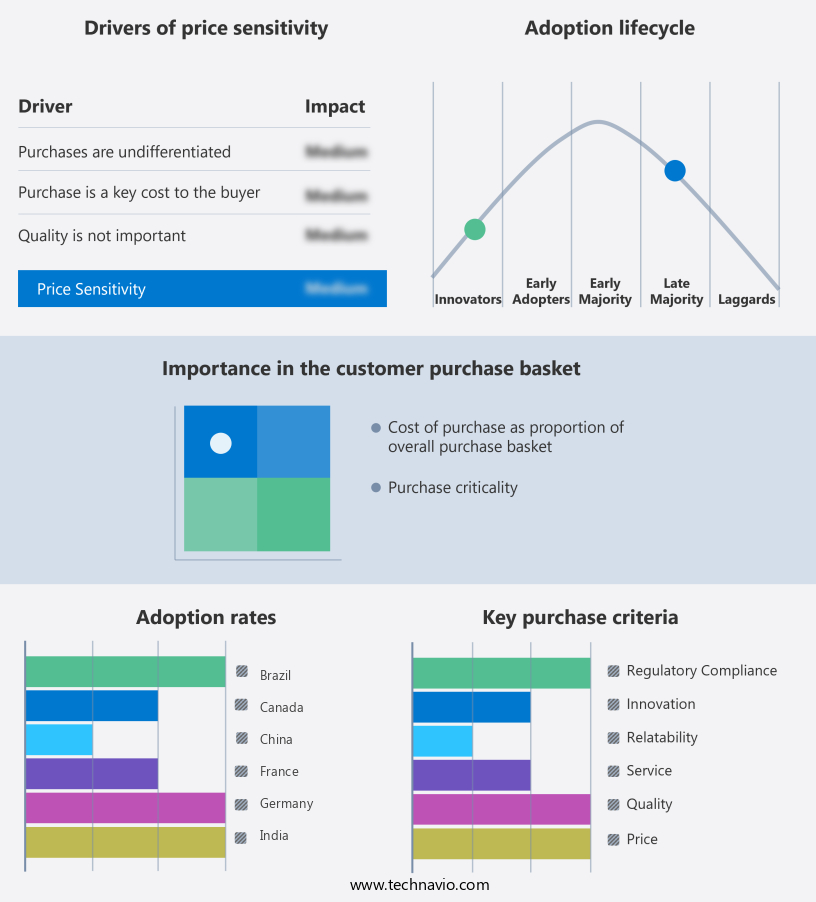
The ethylene market forecasting report includes the adoption lifecycle of the market, covering from the innovator's stage to the laggard's stage. It focuses on adoption rates in different regions based on penetration. Furthermore, the ethylene market report also includes key purchase criteria and drivers of price sensitivity to help companies evaluate and develop their market growth analysis strategies.

Ethylene Market Share by Geography

 Customer Landscape

Key Companies & Market Insights

Companies are implementing various strategies, such as strategic alliances, ethylene market forecast, partnerships, mergers and acquisitions, geographical expansion, and product/service launches, to enhance their presence in the industry.

The industry research and growth report includes detailed analyses of the competitive landscape of the market and information about key companies, including:

  • BASF SE
  • Braskem SA
  • Chevron Phillips Chemical Co. LLC
  • China National Petroleum Corp.
  • Eastman Chemical Co.
  • Exxon Mobil Corp.
  • Formosa Plastics Corp.
  • Huntsman Corp.
  • Koch Industries Inc.
  • LyondellBasell Industries NV
  • Merck KGaA
  • Mitsubishi Chemical Group Corp.
  • Mitsui Chemicals Inc.
  • NOVA Chemicals Corp.
  • Reliance Industries Ltd.
  • Saudi Basic Industries Corp.
  • Shell plc
  • Sumitomo Chemical Co. Ltd.
  • The Dow Chemical Co.
  • TotalEnergies SE

Qualitative and quantitative analysis of companies has been conducted to help clients understand the wider business environment as well as the strengths and weaknesses of key industry players. Data is qualitatively analyzed to categorize companies as pure play, category-focused, industry-focused, and diversified; it is quantitatively analyzed to categorize companies as dominant, leading, strong, tentative, and weak.

Recent Development and News in Ethylene Market

  • In November 2024, Sinopec launched a new 1.2 million tonnes per year ethylene facility in Tianjin, China, increasing its subsidiary's total ethylene capacity to 2.5 million tonnes annually, with partial solar power integration to enhance efficiency.
  • In December 2024, Eastman Chemical Company boosted its sustainable ethylene glycol production by 20%, focusing on bio-based ethylene derivatives for eco-friendly packaging and textile applications.
  • In February 2025, Braskem collaborated with Toyo Engineering to build a bio-based ethylene plant in Thailand using sugarcane ethanol, targeting a 15% increase in bio-polyethylene output by 2027.
  • In March 2025, LyondellBasell acquired a 35% stake in Saudi Arabia's NATPET, adding 1 million tonnes to its annual ethylene capacity, aiming for a 10% market share growth by 2028.

Research Analyst Overview

Ethylene is a colorless, flammable organic compound that serves as a fundamental building block in the production of various polymers and petrochemical derivatives. This versatile compound is derived from raw material sources such as natural gas and naphtha, and its demand is driven by numerous industries, including agriculture, consumer goods, construction, and healthcare. In the realm of agriculture, ethylene plays a crucial role as a ripening agent for fruits and vegetables, ensuring optimal harvest and preservation. In the consumer goods sector, ethylene is utilized in the production of high-density polyethylene (HDPE) and low-density polyethylene (LDPE), which are essential in creating lightweight plastics for various applications, such as packaging solutions.

In addition, the construction industry relies on ethylene to manufacture PVC pipes and other vinyl-based products, which offer superior chemical resistance and durability. Ethylene-based derivatives are also used in the production of textiles, agrochemicals, and rubber and plastics. The demand for ethylene in the packaging industry is significant due to its barrier qualities, which make it an ideal material for producing plastic bags, bottles, and containers for various food, beverages, and medications. Ethylene's role in e-commerce continues to grow as the demand for efficient and lightweight packaging solutions increases. The production of ethylene oxide and ethylene glycol is another essential application, as these derivatives are used in the manufacturing of various chemicals, soaps, and detergents.

Moreover, ethylene vinyl acetate (EVA) is another ethylene-based derivative that is widely used in the production of adhesives, sealants, and coatings. The market is influenced by various factors, including the availability and price of raw material sources, such as natural gas and naphtha. The emergence of shale oil output and the shift towards bio-ethanol as a raw material source have significantly impacted the market dynamics. The growing emphasis on environmental protection and the production of bio-based ethylene and bio-polyethylene have also influenced market trends. The use of ethylene in luxury automobiles, particularly in the production of high-performance plastics, highlights its importance in the automotive industry.

Furthermore, ethylene derivatives are also used in the production of ethylene-vinyl acetate (EVA) copolymers, which are used in pipe applications and as binders in the production of carbon fiber reinforced polymers. The demand for ethylene in the production of ethylene oxide and ethylene glycol is driven by the demand for petrochemical feedstocks and chemical intermediaries. Ethylene's role in the production of various polymers and petrochemical derivatives makes it an essential component in numerous industries, from agriculture to healthcare, construction to consumer goods. The market is subject to various environmental concerns, including its carbon footprint and its contribution to climate change and carbon emissions.

In addition, efforts to reduce the carbon footprint of ethylene production and promote the use of bio-based ethylene and green polyethylene are ongoing. Ethylene's role as a raw material source for various industries and its versatility make it a critical component in the global economy. Its production and application continue to evolve, driven by technological advancements, market demands, and environmental concerns.

Dive into Technavio's strong research methodology, blending expert interviews, extensive data synthesis, and validated models for unparalleled Ethylene Market insights. See full methodology.

Market Scope

Report Coverage

Details

Page number

223

Base year

2024

Historic period

2019-2023

Forecast period

2025-2029

Growth momentum & CAGR

Accelerate at a CAGR of 6.5%

Market growth 2025-2029

USD 63.3 billion

Market structure

Fragmented

YoY growth 2024-2025(%)

5.9

Key countries

China, US, Japan, Canada, India, UAE, Germany, UK, France, and Brazil

Competitive landscape

Leading Companies, market growth and forecasting, Market Positioning of Companies, Competitive Strategies, and Industry Risks

Request Free Sample

What are the Key Data Covered in this Ethylene Market Research and Growth Report?

  • CAGR of the Ethylene industry during the forecast period
  • Detailed information on factors that will drive the growth and forecasting between 2025 and 2029
  • Precise estimation of the size of the market and its contribution of the industry in focus to the parent market
  • Accurate predictions about upcoming growth and trends and changes in consumer behaviour
  • Growth of the market across APAC, North America, Middle East and Africa, Europe, and South America
  • Thorough analysis of the market's competitive landscape and detailed information about companies
  • Comprehensive analysis of factors that will challenge the ethylene market growth of industry companies

We can help! Our analysts can customize this ethylene market research report to meet your requirements.

Get in touch

1 Executive Summary

  • 1.1 Market overview
    • Executive Summary - Chart on Market Overview
    • Executive Summary - Data Table on Market Overview
    • Executive Summary - Chart on Global Market Characteristics
    • Executive Summary - Chart on Market by Geography
    • Executive Summary - Chart on Market Segmentation by Feedstock
    • Executive Summary - Chart on Market Segmentation by Application
    • Executive Summary - Chart on Incremental Growth
    • Executive Summary - Data Table on Incremental Growth
    • Executive Summary - Chart on Company Market Positioning

2 Technavio Analysis

  • 2.1 Analysis of price sensitivity, lifecycle, customer purchase basket, adoption rates, and purchase criteria
    • Analysis of price sensitivity, lifecycle, customer purchase basket, adoption rates, and purchase criteria
  • 2.2 Criticality of inputs and Factors of differentiation
    • Overview on criticality of inputs and factors of differentiation
  • 2.3 Factors of disruption
    • Overview on factors of disruption
  • 2.4 Impact of drivers and challenges
    • Impact of drivers and challenges in 2024 and 2029

3 Market Landscape

  • 3.1 Market ecosystem
    • Parent Market
    • Data Table on - Parent Market
  • 3.2 Market characteristics
    • Market characteristics analysis
  • 3.3 Value chain analysis
    • Value chain analysis

4 Market Sizing

  • 4.1 Market definition
    • Offerings of companies included in the market definition
  • 4.2 Market segment analysis
    • Market segments
  • 4.3 Market size 2024
    • 4.4 Market outlook: Forecast for 2024-2029
      • Chart on Global - Market size and forecast 2024-2029 ($ billion)
      • Data Table on Global - Market size and forecast 2024-2029 ($ billion)
      • Chart on Global Market: Year-over-year growth 2024-2029 (%)
      • Data Table on Global Market: Year-over-year growth 2024-2029 (%)

    5 Historic Market Size

    • 5.1 Global Ethylene Market 2019 - 2023
      • Historic Market Size - Data Table on Global Ethylene Market 2019 - 2023 ($ billion)
    • 5.2 Feedstock segment analysis 2019 - 2023
      • Historic Market Size - Feedstock Segment 2019 - 2023 ($ billion)
    • 5.3 Application segment analysis 2019 - 2023
      • Historic Market Size - Application Segment 2019 - 2023 ($ billion)
    • 5.4 Geography segment analysis 2019 - 2023
      • Historic Market Size - Geography Segment 2019 - 2023 ($ billion)
    • 5.5 Country segment analysis 2019 - 2023
      • Historic Market Size - Country Segment 2019 - 2023 ($ billion)

    6 Qualitative Analysis

    • 6.1 The AI impact on Global Ethylene Market

      7 Five Forces Analysis

      • 7.1 Five forces summary
        • Five forces analysis - Comparison between 2024 and 2029
      • 7.2 Bargaining power of buyers
        • Bargaining power of buyers - Impact of key factors 2024 and 2029
      • 7.3 Bargaining power of suppliers
        • Bargaining power of suppliers - Impact of key factors in 2024 and 2029
      • 7.4 Threat of new entrants
        • Threat of new entrants - Impact of key factors in 2024 and 2029
      • 7.5 Threat of substitutes
        • Threat of substitutes - Impact of key factors in 2024 and 2029
      • 7.6 Threat of rivalry
        • Threat of rivalry - Impact of key factors in 2024 and 2029
      • 7.7 Market condition
        • Chart on Market condition - Five forces 2024 and 2029

      8 Market Segmentation by Feedstock

      • 8.1 Market segments
        • Chart on Feedstock - Market share (2024-2029) (%)
        • Data Table on Feedstock - Market share (2024-2029) (%)
      • 8.2 Comparison by Feedstock
        • Chart on Comparison by Feedstock
        • Data Table on Comparison by Feedstock
      • 8.3 Naphtha - Market size and forecast (2024-2029)
        • Chart on Naphtha - Market size and forecast (2024-2029) ($ billion)
        • Data Table on Naphtha - Market size and forecast (2024-2029) ($ billion)
        • Chart on Naphtha - Year-over-year growth (2024-2029) (%)
        • Data Table on Naphtha - Year-over-year growth (2024-2029) (%)
      • 8.4 Ethane - Market size and forecast (2024-2029)
        • Chart on Ethane - Market size and forecast (2024-2029) ($ billion)
        • Data Table on Ethane - Market size and forecast (2024-2029) ($ billion)
        • Chart on Ethane - Year-over-year growth (2024-2029) (%)
        • Data Table on Ethane - Year-over-year growth (2024-2029) (%)
      • 8.5 LPG - Market size and forecast (2024-2029)
        • Chart on LPG - Market size and forecast (2024-2029) ($ billion)
        • Data Table on LPG - Market size and forecast (2024-2029) ($ billion)
        • Chart on LPG - Year-over-year growth (2024-2029) (%)
        • Data Table on LPG - Year-over-year growth (2024-2029) (%)
      • 8.6 Others - Market size and forecast (2024-2029)
        • Chart on Others - Market size and forecast (2024-2029) ($ billion)
        • Data Table on Others - Market size and forecast (2024-2029) ($ billion)
        • Chart on Others - Year-over-year growth (2024-2029) (%)
        • Data Table on Others - Year-over-year growth (2024-2029) (%)
      • 8.7 Market opportunity by Feedstock
        • Market opportunity by Feedstock ($ billion)
        • Data Table on Market opportunity by Feedstock ($ billion)

      9 Market Segmentation by Application

      • 9.1 Market segments
        • Chart on Application - Market share (2024-2029) (%)
        • Data Table on Application - Market share (2024-2029) (%)
      • 9.2 Comparison by Application
        • Chart on Comparison by Application
        • Data Table on Comparison by Application
      • 9.3 LDPE - Market size and forecast (2024-2029)
        • Chart on LDPE - Market size and forecast (2024-2029) ($ billion)
        • Data Table on LDPE - Market size and forecast (2024-2029) ($ billion)
        • Chart on LDPE - Year-over-year growth (2024-2029) (%)
        • Data Table on LDPE - Year-over-year growth (2024-2029) (%)
      • 9.4 HDPE - Market size and forecast (2024-2029)
        • Chart on HDPE - Market size and forecast (2024-2029) ($ billion)
        • Data Table on HDPE - Market size and forecast (2024-2029) ($ billion)
        • Chart on HDPE - Year-over-year growth (2024-2029) (%)
        • Data Table on HDPE - Year-over-year growth (2024-2029) (%)
      • 9.5 Ethylene oxide - Market size and forecast (2024-2029)
        • Chart on Ethylene oxide - Market size and forecast (2024-2029) ($ billion)
        • Data Table on Ethylene oxide - Market size and forecast (2024-2029) ($ billion)
        • Chart on Ethylene oxide - Year-over-year growth (2024-2029) (%)
        • Data Table on Ethylene oxide - Year-over-year growth (2024-2029) (%)
      • 9.6 Vinyls - Market size and forecast (2024-2029)
        • Chart on Vinyls - Market size and forecast (2024-2029) ($ billion)
        • Data Table on Vinyls - Market size and forecast (2024-2029) ($ billion)
        • Chart on Vinyls - Year-over-year growth (2024-2029) (%)
        • Data Table on Vinyls - Year-over-year growth (2024-2029) (%)
      • 9.7 Others - Market size and forecast (2024-2029)
        • Chart on Others - Market size and forecast (2024-2029) ($ billion)
        • Data Table on Others - Market size and forecast (2024-2029) ($ billion)
        • Chart on Others - Year-over-year growth (2024-2029) (%)
        • Data Table on Others - Year-over-year growth (2024-2029) (%)
      • 9.8 Market opportunity by Application
        • Market opportunity by Application ($ billion)
        • Data Table on Market opportunity by Application ($ billion)

      10 Market Segmentation by Packaging

      • 10.1 Market segments
        • Chart on Packaging - Market share (2024-2029) (%)
        • Data Table on Packaging - Market share (2024-2029) (%)
        • Market opportunity by Packaging ($ billion)
        • Data Table on Market opportunity by Packaging ($ billion)
      • 10.2 Comparison by Packaging
        • Chart on Comparison by Packaging
        • Data Table on Comparison by Packaging
      • 10.3 Packaging - Market size and forecast (2024-2029)
        • Chart on Packaging - Market size and forecast (2024-2029) ($ billion)
        • Data Table on Packaging - Market size and forecast (2024-2029) ($ billion)
        • Chart on Packaging - Year-over-year growth (2024-2029) (%)
        • Data Table on Packaging - Year-over-year growth (2024-2029) (%)
      • 10.4 Automotive - Market size and forecast (2024-2029)
        • Chart on Automotive - Market size and forecast (2024-2029) ($ billion)
        • Data Table on Automotive - Market size and forecast (2024-2029) ($ billion)
        • Chart on Automotive - Year-over-year growth (2024-2029) (%)
        • Data Table on Automotive - Year-over-year growth (2024-2029) (%)
      • 10.5 Building&Construction - Market size and forecast (2024-2029)
        • Chart on Building&Construction - Market size and forecast (2024-2029) ($ billion)
        • Data Table on Building&Construction - Market size and forecast (2024-2029) ($ billion)
        • Chart on Building&Construction - Year-over-year growth (2024-2029) (%)
        • Data Table on Building&Construction - Year-over-year growth (2024-2029) (%)
      • 10.6 Agrochemical - Market size and forecast (2024-2029)
        • Chart on Agrochemical - Market size and forecast (2024-2029) ($ billion)
        • Data Table on Agrochemical - Market size and forecast (2024-2029) ($ billion)
        • Chart on Agrochemical - Year-over-year growth (2024-2029) (%)
        • Data Table on Agrochemical - Year-over-year growth (2024-2029) (%)
      • 10.7 Textile - Market size and forecast (2024-2029)
        • Chart on Textile - Market size and forecast (2024-2029) ($ billion)
        • Data Table on Textile - Market size and forecast (2024-2029) ($ billion)
        • Chart on Textile - Year-over-year growth (2024-2029) (%)
        • Data Table on Textile - Year-over-year growth (2024-2029) (%)
      • 10.8 Chemicals - Market size and forecast (2024-2029)
        • Chart on Chemicals - Market size and forecast (2024-2029) ($ billion)
        • Data Table on Chemicals - Market size and forecast (2024-2029) ($ billion)
        • Chart on Chemicals - Year-over-year growth (2024-2029) (%)
        • Data Table on Chemicals - Year-over-year growth (2024-2029) (%)
      • 10.9 Others - Market size and forecast (2024-2029)
        • Chart on Others - Market size and forecast (2024-2029) ($ billion)
        • Data Table on Others - Market size and forecast (2024-2029) ($ billion)
        • Chart on Others - Year-over-year growth (2024-2029) (%)
        • Data Table on Others - Year-over-year growth (2024-2029) (%)

      11 Market Segmentation by Distribution Channel

      • 11.1 Market segments
        • Chart on Distribution Channel - Market share (2024-2029) (%)
        • Data Table on Distribution Channel - Market share (2024-2029) (%)
      • 11.2 Comparison by Distribution Channel
        • Chart on Comparison by Distribution Channel
        • Data Table on Comparison by Distribution Channel
      • 11.3 Direct Sales - Market size and forecast (2024-2029)
        • Chart on Direct Sales - Market size and forecast (2024-2029) ($ billion)
        • Data Table on Direct Sales - Market size and forecast (2024-2029) ($ billion)
        • Chart on Direct Sales - Year-over-year growth (2024-2029) (%)
        • Data Table on Direct Sales - Year-over-year growth (2024-2029) (%)
      • 11.4 Distributors - Market size and forecast (2024-2029)
        • Chart on Distributors - Market size and forecast (2024-2029) ($ billion)
        • Data Table on Distributors - Market size and forecast (2024-2029) ($ billion)
        • Chart on Distributors - Year-over-year growth (2024-2029) (%)
        • Data Table on Distributors - Year-over-year growth (2024-2029) (%)
      • 11.5 Market opportunity by Distribution Channel
        • Market opportunity by Distribution Channel ($ billion)
        • Data Table on Market opportunity by Distribution Channel ($ billion)

      12 Customer Landscape

      • 12.1 Customer landscape overview
        • Analysis of price sensitivity, lifecycle, customer purchase basket, adoption rates, and purchase criteria

      13 Geographic Landscape

      • 13.1 Geographic segmentation
        • Chart on Market share by geography 2024-2029 (%)
        • Data Table on Market share by geography 2024-2029 (%)
      • 13.2 Geographic comparison
        • Chart on Geographic comparison
        • Data Table on Geographic comparison
      • 13.3 APAC - Market size and forecast 2024-2029
        • Chart on APAC - Market size and forecast 2024-2029 ($ billion)
        • Data Table on APAC - Market size and forecast 2024-2029 ($ billion)
        • Chart on APAC - Year-over-year growth 2024-2029 (%)
        • Data Table on APAC - Year-over-year growth 2024-2029 (%)
      • 13.4 North America - Market size and forecast 2024-2029
        • Chart on North America - Market size and forecast 2024-2029 ($ billion)
        • Data Table on North America - Market size and forecast 2024-2029 ($ billion)
        • Chart on North America - Year-over-year growth 2024-2029 (%)
        • Data Table on North America - Year-over-year growth 2024-2029 (%)
      • 13.5 Middle East and Africa - Market size and forecast 2024-2029
        • Chart on Middle East and Africa - Market size and forecast 2024-2029 ($ billion)
        • Data Table on Middle East and Africa - Market size and forecast 2024-2029 ($ billion)
        • Chart on Middle East and Africa - Year-over-year growth 2024-2029 (%)
        • Data Table on Middle East and Africa - Year-over-year growth 2024-2029 (%)
      • 13.6 Europe - Market size and forecast 2024-2029
        • Chart on Europe - Market size and forecast 2024-2029 ($ billion)
        • Data Table on Europe - Market size and forecast 2024-2029 ($ billion)
        • Chart on Europe - Year-over-year growth 2024-2029 (%)
        • Data Table on Europe - Year-over-year growth 2024-2029 (%)
      • 13.7 South America - Market size and forecast 2024-2029
        • Chart on South America - Market size and forecast 2024-2029 ($ billion)
        • Data Table on South America - Market size and forecast 2024-2029 ($ billion)
        • Chart on South America - Year-over-year growth 2024-2029 (%)
        • Data Table on South America - Year-over-year growth 2024-2029 (%)
      • 13.8 China - Market size and forecast 2024-2029
        • Chart on China - Market size and forecast 2024-2029 ($ billion)
        • Data Table on China - Market size and forecast 2024-2029 ($ billion)
        • Chart on China - Year-over-year growth 2024-2029 (%)
        • Data Table on China - Year-over-year growth 2024-2029 (%)
      • 13.9 US - Market size and forecast 2024-2029
        • Chart on US - Market size and forecast 2024-2029 ($ billion)
        • Data Table on US - Market size and forecast 2024-2029 ($ billion)
        • Chart on US - Year-over-year growth 2024-2029 (%)
        • Data Table on US - Year-over-year growth 2024-2029 (%)
      • 13.10 Japan - Market size and forecast 2024-2029
        • Chart on Japan - Market size and forecast 2024-2029 ($ billion)
        • Data Table on Japan - Market size and forecast 2024-2029 ($ billion)
        • Chart on Japan - Year-over-year growth 2024-2029 (%)
        • Data Table on Japan - Year-over-year growth 2024-2029 (%)
      • 13.11 Canada - Market size and forecast 2024-2029
        • Chart on Canada - Market size and forecast 2024-2029 ($ billion)
        • Data Table on Canada - Market size and forecast 2024-2029 ($ billion)
        • Chart on Canada - Year-over-year growth 2024-2029 (%)
        • Data Table on Canada - Year-over-year growth 2024-2029 (%)
      • 13.12 India - Market size and forecast 2024-2029
        • Chart on India - Market size and forecast 2024-2029 ($ billion)
        • Data Table on India - Market size and forecast 2024-2029 ($ billion)
        • Chart on India - Year-over-year growth 2024-2029 (%)
        • Data Table on India - Year-over-year growth 2024-2029 (%)
      • 13.13 UAE - Market size and forecast 2024-2029
        • Chart on UAE - Market size and forecast 2024-2029 ($ billion)
        • Data Table on UAE - Market size and forecast 2024-2029 ($ billion)
        • Chart on UAE - Year-over-year growth 2024-2029 (%)
        • Data Table on UAE - Year-over-year growth 2024-2029 (%)
      • 13.14 Germany - Market size and forecast 2024-2029
        • Chart on Germany - Market size and forecast 2024-2029 ($ billion)
        • Data Table on Germany - Market size and forecast 2024-2029 ($ billion)
        • Chart on Germany - Year-over-year growth 2024-2029 (%)
        • Data Table on Germany - Year-over-year growth 2024-2029 (%)
      • 13.15 UK - Market size and forecast 2024-2029
        • Chart on UK - Market size and forecast 2024-2029 ($ billion)
        • Data Table on UK - Market size and forecast 2024-2029 ($ billion)
        • Chart on UK - Year-over-year growth 2024-2029 (%)
        • Data Table on UK - Year-over-year growth 2024-2029 (%)
      • 13.16 France - Market size and forecast 2024-2029
        • Chart on France - Market size and forecast 2024-2029 ($ billion)
        • Data Table on France - Market size and forecast 2024-2029 ($ billion)
        • Chart on France - Year-over-year growth 2024-2029 (%)
        • Data Table on France - Year-over-year growth 2024-2029 (%)
      • 13.17 Brazil - Market size and forecast 2024-2029
        • Chart on Brazil - Market size and forecast 2024-2029 ($ billion)
        • Data Table on Brazil - Market size and forecast 2024-2029 ($ billion)
        • Chart on Brazil - Year-over-year growth 2024-2029 (%)
        • Data Table on Brazil - Year-over-year growth 2024-2029 (%)
      • 13.18 Market opportunity by geography
        • Market opportunity by geography ($ billion)
        • Data Tables on Market opportunity by geography ($ billion)
      • 13.19 Rest of World (ROW) - Market size and forecast (2024-2029)
        • Chart on Rest of World (ROW) - Market size and forecast (2024-2029) ($ billion)
        • Data Table on Rest of World (ROW) - Market size and forecast (2024-2029) ($ billion)
        • Chart on Rest of World (ROW) - Year-over-year growth (2024-2029) (%)
        • Data Table on Rest of World (ROW) - Year-over-year growth (2024-2029) (%)

      14 Drivers, Challenges, and Opportunity/Restraints

      • 14.1 Market drivers
        • 14.2 Market challenges
          • 14.3 Impact of drivers and challenges
            • Impact of drivers and challenges in 2024 and 2029
          • 14.4 Market opportunities/restraints

            15 Competitive Landscape

            • 15.1 Overview
              • 15.2 Competitive Landscape
                • Overview on criticality of inputs and factors of differentiation
              • 15.3 Landscape disruption
                • Overview on factors of disruption
              • 15.4 Industry risks
                • Impact of key risks on business

              16 Competitive Analysis

              • 16.1 Companies profiled
                • Companies covered
              • 16.2 Company ranking index
                • Company ranking index
              • 16.3 Market positioning of companies
                • Matrix on companies position and classification
              • 16.4 BASF SE
                • BASF SE - Overview
                • BASF SE - Business segments
                • BASF SE - Key news
                • BASF SE - Key offerings
                • BASF SE - Segment focus
                • SWOT
              • 16.5 Chevron Phillips Chemical Co. LLC
                • Chevron Phillips Chemical Co. LLC - Overview
                • Chevron Phillips Chemical Co. LLC - Product / Service
                • Chevron Phillips Chemical Co. LLC - Key offerings
                • SWOT
              • 16.6 China National Petroleum Corp.
                • China National Petroleum Corp. - Overview
                • China National Petroleum Corp. - Product / Service
                • China National Petroleum Corp. - Key offerings
                • SWOT
              • 16.7 Eastman Chemical Co.
                • Eastman Chemical Co. - Overview
                • Eastman Chemical Co. - Business segments
                • Eastman Chemical Co. - Key news
                • Eastman Chemical Co. - Key offerings
                • Eastman Chemical Co. - Segment focus
                • SWOT
              • 16.8 Exxon Mobil Corp.
                • Exxon Mobil Corp. - Overview
                • Exxon Mobil Corp. - Business segments
                • Exxon Mobil Corp. - Key news
                • Exxon Mobil Corp. - Key offerings
                • Exxon Mobil Corp. - Segment focus
                • SWOT
              • 16.9 Formosa Plastics Corp.
                • Formosa Plastics Corp. - Overview
                • Formosa Plastics Corp. - Product / Service
                • Formosa Plastics Corp. - Key news
                • Formosa Plastics Corp. - Key offerings
                • SWOT
              • 16.10 Huntsman Corp.
                • Huntsman Corp. - Overview
                • Huntsman Corp. - Business segments
                • Huntsman Corp. - Key news
                • Huntsman Corp. - Key offerings
                • Huntsman Corp. - Segment focus
                • SWOT
              • 16.11 LyondellBasell Industries NV
                • LyondellBasell Industries NV - Overview
                • LyondellBasell Industries NV - Business segments
                • LyondellBasell Industries NV - Key news
                • LyondellBasell Industries NV - Key offerings
                • LyondellBasell Industries NV - Segment focus
                • SWOT
              • 16.12 Merck KGaA
                • Merck KGaA - Overview
                • Merck KGaA - Business segments
                • Merck KGaA - Key news
                • Merck KGaA - Key offerings
                • Merck KGaA - Segment focus
                • SWOT
              • 16.13 Mitsubishi Chemical Group Corp.
                • Mitsubishi Chemical Group Corp. - Overview
                • Mitsubishi Chemical Group Corp. - Business segments
                • Mitsubishi Chemical Group Corp. - Key news
                • Mitsubishi Chemical Group Corp. - Key offerings
                • Mitsubishi Chemical Group Corp. - Segment focus
                • SWOT
              • 16.14 Reliance Industries Ltd.
                • Reliance Industries Ltd. - Overview
                • Reliance Industries Ltd. - Business segments
                • Reliance Industries Ltd. - Key news
                • Reliance Industries Ltd. - Key offerings
                • Reliance Industries Ltd. - Segment focus
                • SWOT
              • 16.15 Saudi Basic Industries Corp.
                • Saudi Basic Industries Corp. - Overview
                • Saudi Basic Industries Corp. - Business segments
                • Saudi Basic Industries Corp. - Key offerings
                • Saudi Basic Industries Corp. - Segment focus
                • SWOT
              • 16.16 Shell plc
                • Shell plc - Overview
                • Shell plc - Business segments
                • Shell plc - Key news
                • Shell plc - Key offerings
                • Shell plc - Segment focus
                • SWOT
              • 16.17 The Dow Chemical Co.
                • The Dow Chemical Co. - Overview
                • The Dow Chemical Co. - Business segments
                • The Dow Chemical Co. - Key news
                • The Dow Chemical Co. - Key offerings
                • The Dow Chemical Co. - Segment focus
                • SWOT
              • 16.18 TotalEnergies SE
                • TotalEnergies SE - Overview
                • TotalEnergies SE - Business segments
                • TotalEnergies SE - Key news
                • TotalEnergies SE - Key offerings
                • TotalEnergies SE - Segment focus
                • SWOT

              17 Appendix

              • 17.1 Scope of the report
                • 17.2 Inclusions and exclusions checklist
                  • Inclusions checklist
                  • Exclusions checklist
                • 17.3 Currency conversion rates for US$
                  • Currency conversion rates for US$
                • 17.4 Research methodology
                  • Research methodology
                • 17.5 Data procurement
                  • Information sources
                • 17.6 Data validation
                  • Data validation
                • 17.7 Validation techniques employed for market sizing
                  • Validation techniques employed for market sizing
                • 17.8 Data synthesis
                  • Data synthesis
                • 17.9 360 degree market analysis
                  • 360 degree market analysis
                • 17.10 List of abbreviations
                  • List of abbreviations

                Research Methodology

                Technavio presents a detailed picture of the market by way of study, synthesis, and summation of data from multiple sources. The analysts have presented the various facets of the market with a particular focus on identifying the key industry influencers. The data thus presented is comprehensive, reliable, and the result of extensive research, both primary and secondary.

                INFORMATION SOURCES

                Primary sources

                • Manufacturers and suppliers
                • Channel partners
                • Industry experts
                • Strategic decision makers

                Secondary sources

                • Industry journals and periodicals
                • Government data
                • Financial reports of key industry players
                • Historical data
                • Press releases

                DATA ANALYSIS

                Data Synthesis

                • Collation of data
                • Estimation of key figures
                • Analysis of derived insights

                Data Validation

                • Triangulation with data models
                • Reference against proprietary databases
                • Corroboration with industry experts

                REPORT WRITING

                Qualitative

                • Market drivers
                • Market challenges
                • Market trends
                • Five forces analysis

                Quantitative

                • Market size and forecast
                • Market segmentation
                • Geographical insights
                • Competitive landscape

                Interested in this report?

                Get your sample now to see our research methodology and insights!

                Download Now

                Frequently Asked Questions

                Ethylene market growth will increase by $ 63.3 bn during 2025-2029.

                The Ethylene market is expected to grow at a CAGR of 6.5% during 2025-2029.

                Ethylene market is segmented by Feedstock( Naphtha, Ethane, LPG, Others) Application( LDPE, HDPE, Ethylene oxide, Vinyls, Others)

                BASF SE, Braskem SA, Chevron Phillips Chemical Co. LLC, China National Petroleum Corp., Eastman Chemical Co., Exxon Mobil Corp., Formosa Plastics Corp., Huntsman Corp., Koch Industries Inc., LyondellBasell Industries NV, Merck KGaA, Mitsubishi Chemical Group Corp., Mitsui Chemicals Inc., NOVA Chemicals Corp., Reliance Industries Ltd., Saudi Basic Industries Corp., Shell plc, Sumitomo Chemical Co. Ltd., The Dow Chemical Co., TotalEnergies SE are a few of the key vendors in the Ethylene market.

                APAC will register the highest growth rate of 42% among the other regions. Therefore, the Ethylene market in APAC is expected to garner significant business opportunities for the vendors during the forecast period.

                China, US, Japan, Canada, India, UAE, Germany, UK, France, Brazil, Rest of World (ROW)

                • Increasing demand for polyethylene products from various industriesOne of the major drivers of the global ethylene market is the increasing demand for polyethylene products from various industries such as consumer electronics is the driving factor this market.
                • construction is the driving factor this market.
                • and automotive. Ethylene is primarily used in polyethylene products such as HDPE is the driving factor this market.
                • LDPE is the driving factor this market.
                • and LLDPE. The increasing demand for plastic is likely to have a considerable impact on the global polyethylene market. Globally is the driving factor this market.
                • China and India exhibit the highest demand for plastics. In India is the driving factor this market.
                • plastics are extensively used in electronic products. The demand for electronic products in the country is estimated to increase at an annual rate of 17%. Factors that help increase the market penetration of electronic products are better purchasing power is the driving factor this market.
                • high penetration of electronic products is the driving factor this market.
                • and rapid advances in technology. The use of lightweight products in vehicles has increased the consumption of plastics in the automotive sector. Plastics help reduce the over vehicle weight is the driving factor this market.
                • thereby minimizing emissions. Vehicle parts made of plastic resist corrosion and are flexible. They offer thermal insulation and noise reduction is the driving factor this market.
                • along with allowing optimum space utilization. The construction sector is expected to drive the consumption of polyethylene products is the driving factor this market.
                • especially HDPE. HDPE is used in applications such as storage tanks is the driving factor this market.
                • geosynthetics is the driving factor this market.
                • decorative items is the driving factor this market.
                • and pipes. It is used for other applications is the driving factor this market.
                • such as colored sheeting is the driving factor this market.
                • shrink sheeting is the driving factor this market.
                • and custom poly sheeting. The rising residential and non-residential construction spending is projected to increase the consumption of HDPE plastic resins that are used in telephone ducts is the driving factor this market.
                • pipes and plumbing is the driving factor this market.
                • and electrical boxes. The upcoming construction projects is the driving factor this market.
                • such as commercial buildings and residential projects is the driving factor this market.
                • will further increase the consumption of HDPE. Thus is the driving factor this market.
                • the rising demand for polyethylene from these industries is expected to foster the demand for ethylene during the forecast period is the driving factor this market.
                • thereby driving the growth of the global ethylene market during the forecast period. is the driving factor this market.

                The Ethylene market vendors should focus on grabbing business opportunities from the Naphtha segment as it accounted for the largest market share in the base year.
                RIA - Research AI Assistant
                Ask RIA