



Europe Foodservice Market Size 2026-2030
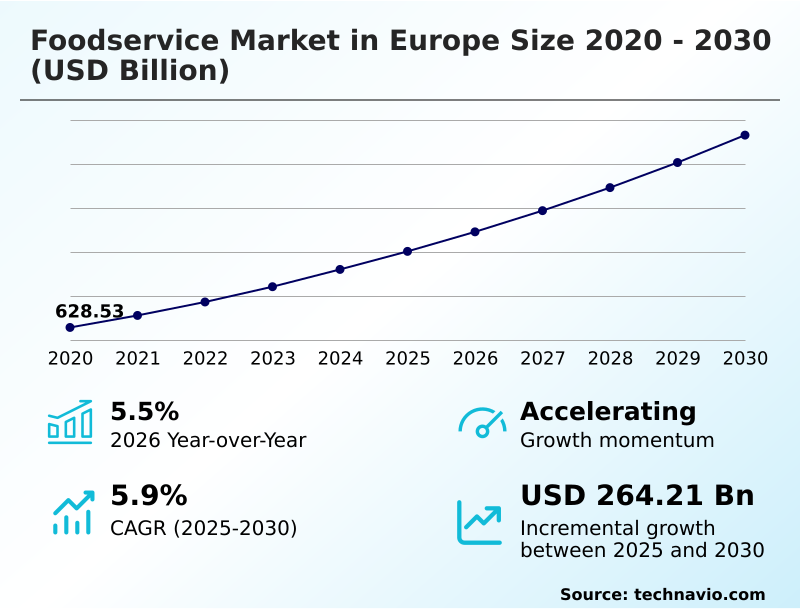
The europe foodservice market size is valued to increase by USD 264.21 billion, at a CAGR of 5.9% from 2025 to 2030. Increased snacking and indulgence consumption will drive the europe foodservice market.
Major Market Trends & Insights
- By Sector - Commercial segment was valued at USD 611.29 billion in 2024
- By Service - Conventional segment accounted for the largest market revenue share in 2024
Market Size & Forecast
- Market Opportunities: USD 437.11 billion
- Market Future Opportunities: USD 264.21 billion
- CAGR from 2025 to 2030 : 5.9%
Market Summary
- The Foodservice Market in Europe is characterized by a rapid structural shift toward digital integration and diversified dining formats. Increased snacking and indulgence consumption actively drives market expansion, compelling operators to introduce smaller, premium portions tailored for immediate consumption and delivery platforms.
- Conversely, severe labor shortages present a critical operational bottleneck, forcing establishments to limit operating hours and accelerating the transition toward self-ordering kiosks and automated food preparation systems. In a practical business context, supply chain optimization has become essential; operators leveraging predictive analytics for inventory management have reduced food spoilage by 22% compared to manual tracking methods.
- The implementation of AI-driven forecasting aligns procurement directly with fluctuating consumer demand, maximizing resource efficiency. Establishments are increasingly prioritizing sustainability and personalized dining to maintain customer loyalty amid intense competition. Consequently, strategic investments in cloud kitchen architectures are reshaping fulfillment networks, allowing brands to expand their delivery footprint while minimizing fixed overhead costs.
What will be the Size of the Europe Foodservice Market during the forecast period?
Get Key Insights on Market Forecast (PDF) Get Free Sample
How is the Europe Foodservice Market Segmented?
The europe foodservice industry research report provides comprehensive data (region-wise segment analysis), with forecasts and estimates in "USD million" for the period 2026-2030, as well as historical data from 2020-2024 for the following segments.
- Sector
- Commercial
- Non-commercial
- Service
- Conventional
- Centralized
- Ready-prepared
- Assembly-serve
- Application
- Restaurants
- Employee canteens
- Schools and kindergarten
- Airlines
- Others
- Geography
- Europe
- UK
- Germany
- France
- Italy
- Europe
By Sector Insights
The commercial segment is estimated to witness significant growth during the forecast period.
The commercial segment of the Foodservice Market in Europe operates primarily through profit-oriented establishments serving local residents, business professionals, and tourists.
Driven by rising urbanization and demand for convenience-based dining, this segment heavily integrates cloud kitchen infrastructure to scale operations efficiently.
Implementation of advanced point-of-sale integration has enabled operators to achieve a 15% improvement in order processing accuracy compared to traditional setups.
Furthermore, mobile ordering applications are reshaping the omnichannel dining experience, allowing establishments to capture diverse consumer groups seeking premium dining experiences.
Strategic casual dining optimization and dynamic menu pricing models allow brands to adjust to fluctuating demand seamlessly, enhancing overall revenue margins by up to 12% relative to static pricing structures.
Consequently, franchise network expansion is accelerating as operators introduce experiential dining formats to remain competitive in a rapidly evolving culinary landscape.
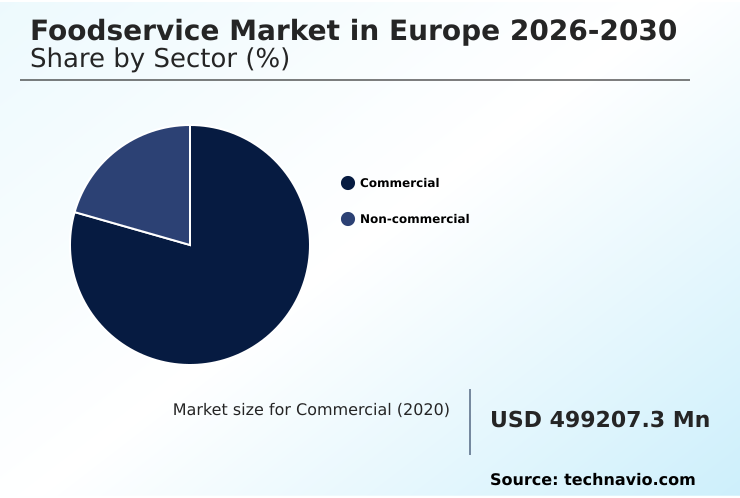
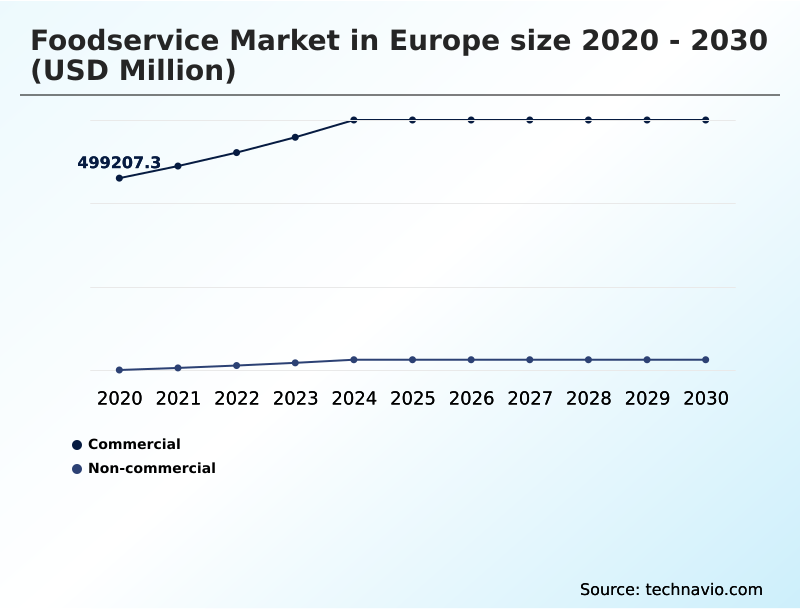
The Commercial segment was valued at USD 611.29 billion in 2024 and showed a gradual increase during the forecast period.
Market Dynamics
Our researchers analyzed the data with 2025 as the base year, along with the key drivers, trends, and challenges. A holistic analysis of drivers will help companies refine their marketing strategies to gain a competitive advantage.
- The Foodservice Market in Europe is undergoing a major technological and operational transformation, primarily influenced by shifting consumer expectations and regulatory mandates. Establishments are rapidly adopting contactless digital food ordering platforms to enhance service speed and minimize physical touchpoints. This transition relies heavily on automated kitchen inventory tracking systems, which ensure real-time ingredient visibility and prevent stockouts during peak hours.
- In parallel, the surge in delivery demand has propelled the integration of sustainable packaging solutions for delivery, helping brands align with stringent environmental regulations while appealing to eco-conscious consumers. The implementation of AI-driven restaurant workforce scheduling is mitigating labor constraints by aligning staff deployment with anticipated foot traffic, demonstrating an efficiency gain of approximately 20% over traditional roster planning.
- Furthermore, operators are utilizing predictive demand forecasting for ingredients to optimize their supply chain and reduce waste. To support these logistical shifts, temperature-controlled logistics for catering guarantee that remote and large-scale food transport maintains optimal safety standards. Ghost kitchen network expansion models are allowing brands to rapidly enter new regions without the overhead of physical storefronts.
- Additionally, dynamic menu pricing optimization algorithms enable operators to adjust costs dynamically based on ingredient availability and demand fluctuations. To round out these innovations, omnichannel dining experience enhancement tools and biometric payment systems for restaurants are creating highly personalized and frictionless interactions, securing long-term customer loyalty across digital and physical touchpoints.
What are the key market drivers leading to the rise in the adoption of Europe Foodservice Industry?
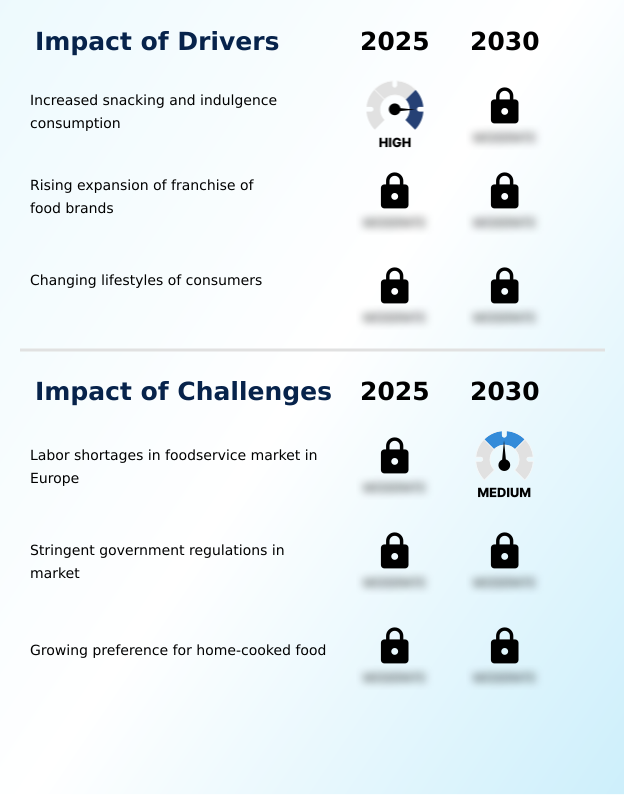
- Increased snacking and indulgence consumption serves as a primary catalyst for market growth as consumers increasingly prioritize flexible eating behaviors and convenience-oriented food options.
- Surging consumer reliance on digital convenience is acting as a primary driver within the Foodservice Market in Europe. The rapid adoption of hybrid ordering models allows customers to seamlessly transition between dine-in and takeaway, fundamentally altering traditional revenue streams.
- This behavioral shift is compelling operators to implement advanced digital reservation systems to manage peak capacity effectively.
- The integration of AI-based workforce scheduling has enabled establishments to align labor deployment with predictive foot traffic, resulting in a 16% reduction in unnecessary overtime costs compared to manual planning.
- Furthermore, the deployment of delivery optimization platforms ensures rapid dispatch and routing, which is critical for maintaining quick service turnaround.
- These operational drivers directly enhance margin retention by streamlining front-of-house management and ensuring that businesses can efficiently scale their services to meet escalating on-demand delivery expectations.
What are the market trends shaping the Europe Foodservice Industry?
- The increasing presence of a highly diverse population is driving a pronounced shift toward indulging in ethnic cuisine. This cultural diversification encourages operators to expand their menus with authentic global flavors.
- The Foodservice Market in Europe is witnessing a profound shift toward diversified and health-aligned culinary offerings. Growing demand for nutritional transparency is driving widespread adoption of plant-based menu formulation, enabling operators to cater to restrictive diets. This behavioral shift mandates the introduction of health-conscious menu options, directly influencing product strategy and ingredient procurement.
- Establishments that have integrated fusion dish creation into their core offerings have observed a 14% increase in millennial customer retention compared to standard menus. Simultaneously, the pursuit of culinary authenticity is reshaping how regional specialties are prepared and marketed. To complement these food trends, specialized investments in specialty beverage crafting have yielded a 20% improvement in average transaction values.
- These trends are forcing businesses to recalibrate their supply chains to source specialized ingredients, ensuring they remain competitive while addressing the evolving taste profiles and dietary requirements of a highly fragmented consumer base.
What challenges does the Europe Foodservice Industry face during its growth?
- Persistent labor shortages across the industry significantly hinder operational efficiency and restrict service capacity, compelling establishments to invest in automated solutions.
- Strict environmental regulations and operational constraints are posing significant challenges within the Foodservice Market in Europe. The immediate need to comply with sustainability mandates forces operators to invest heavily in food waste reduction technology, straining short-term capital expenditure budgets. Furthermore, maintaining takeaway packaging resilience under varying transit conditions requires cost-intensive material upgrades.
- Businesses attempting to offset these costs through loyalty program gamification face high implementation barriers and extended technology adoption timelines. In the B2B sector, achieving institutional catering efficiency remains exceptionally difficult due to fluctuating daily headcounts and strict dietary compliance laws, leading to a 15% increase in baseline operational costs compared to standardized retail food outlets.
- Consequently, optimizing event catering management under these volatile conditions requires sophisticated logistical planning, challenging operators to balance regulatory compliance with competitive pricing structures.
Exclusive Technavio Analysis on Customer Landscape
The europe foodservice market forecasting report includes the adoption lifecycle of the market, covering from the innovator’s stage to the laggard’s stage. It focuses on adoption rates in different regions based on penetration. Furthermore, the europe foodservice market report also includes key purchase criteria and drivers of price sensitivity to help companies evaluate and develop their market growth analysis strategies.
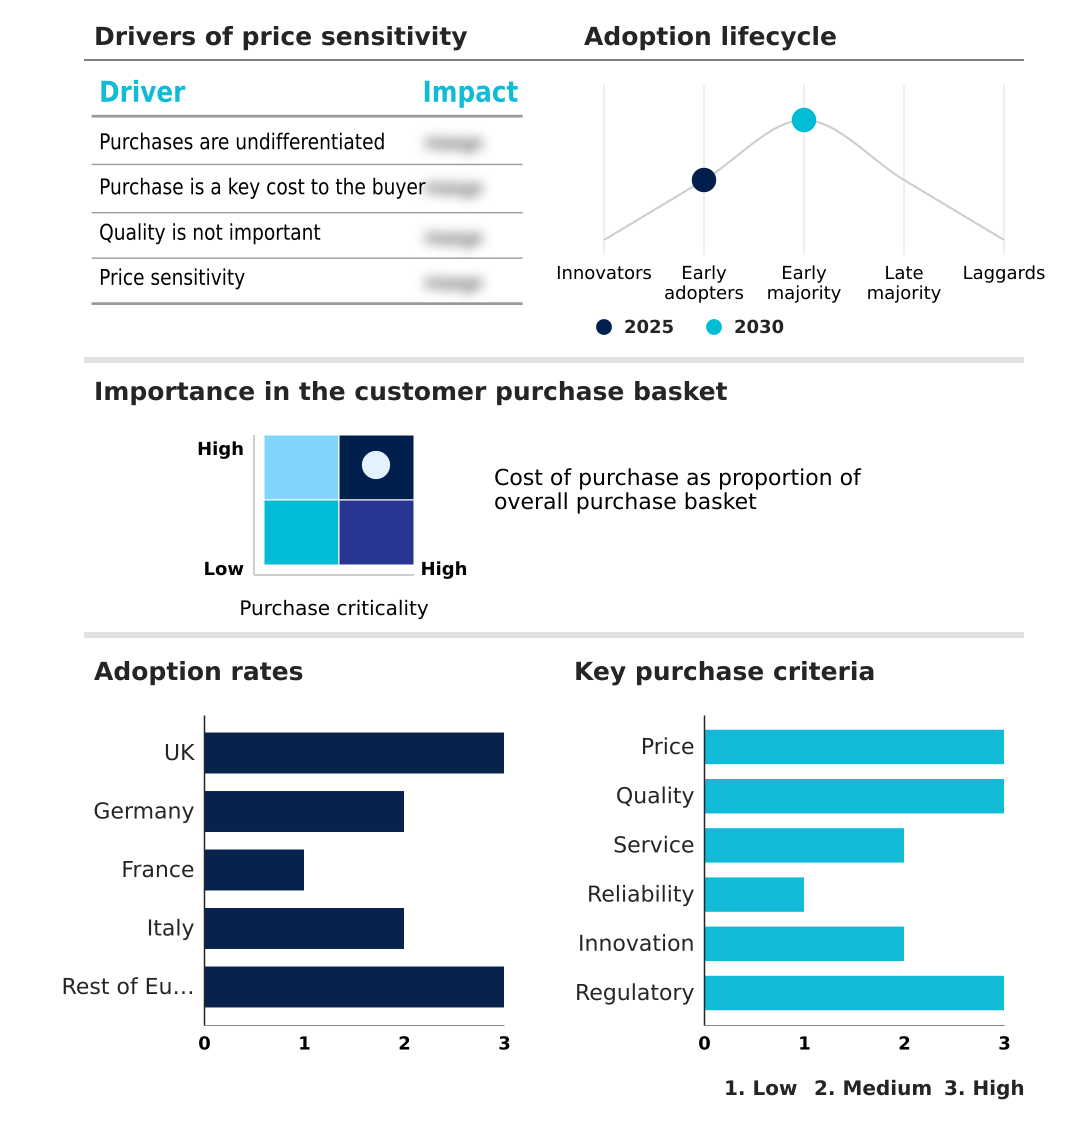
Customer Landscape of Europe Foodservice Industry
Competitive Landscape
Companies are implementing various strategies, such as strategic alliances, europe foodservice market forecast, partnerships, mergers and acquisitions, geographical expansion, and product/service launches, to enhance their presence in the industry.
Aramark - The vendor provides facility catering services, corporate dining, and hospitality food solutions, delivering comprehensive support across business, sports, leisure, education, and healthcare sectors.
The industry research and growth report includes detailed analyses of the competitive landscape of the market and information about key companies, including:
- Aramark
- Bertrand Group
- Compass Group Plc
- DO and CO Aktiengesellschaft
- Dominos Pizza Inc.
- Elior Group SA
- Gategroup
- Greggs plc
- Grupo Restalia
- LE DUFF Group
- LSG Group
- Mitchells and Butlers plc
- NORDSEE GmbH
- Restaurant Brands Inc.
- Sodexo SA
- Starbucks Corp.
- The Restaurant Group PLC
- Vapiano SE
- YUM Brands Inc.
Qualitative and quantitative analysis of companies has been conducted to help clients understand the wider business environment as well as the strengths and weaknesses of key industry players. Data is qualitatively analyzed to categorize companies as pure play, category-focused, industry-focused, and diversified; it is quantitatively analyzed to categorize companies as dominant, leading, strong, tentative, and weak.
Recent Development and News in Europe foodservice market
- In the Hotels, Resorts and Cruise Lines industry, the rapid deployment of smart room technology and AI-based workforce scheduling systems has streamlined guest operations, directly impacting Foodservice demand by accelerating the adoption of digital reservation systems and automated kitchen equipment for in-room dining.
- The shift toward eco-friendly hospitality operations has mandated stringent carbon footprint reduction protocols, directly impacting Foodservice demand by pushing resort catering facilities to integrate sustainable packaging alternatives and food waste reduction technology.
- The expansion of specialized cruise ship travel tailored to highly diverse demographics has amplified the need for cultural culinary representation, directly impacting Foodservice demand by compelling maritime dining operators to enhance ethnic cuisine adaptation and seasonal ingredient sourcing.
- Increasing regulatory pressure regarding passenger hygiene standard maintenance has forced hospitality venues to upgrade sanitation protocols, directly impacting Foodservice demand by requiring operators to implement contactless payment solutions and robotic food preparation to minimize physical interaction.
Dive into Technavio’s robust research methodology, blending expert interviews, extensive data synthesis, and validated models for unparalleled Europe Foodservice Market insights. See full methodology.
| Market Scope | |
|---|---|
| Page number | 214 |
| Base year | 2025 |
| Historic period | 2020-2024 |
| Forecast period | 2026-2030 |
| Growth momentum & CAGR | Accelerate at a CAGR of 5.9% |
| Market growth 2026-2030 | USD 264207.6 million |
| Market structure | Fragmented |
| YoY growth 2025-2026(%) | 5.5% |
| Key countries | UK, Germany, France, Italy and Rest of Europe |
| Competitive landscape | Leading Companies, Market Positioning of Companies, Competitive Strategies, and Industry Risks |
Research Analyst Overview
- The Foodservice Market in Europe is experiencing a fundamental evolution driven by the intersection of consumer demand and technological sophistication. Boardroom-level decisions are increasingly focused on integrating advanced digital infrastructures to mitigate operational bottlenecks and address strict regulatory environments. Strategic investments in predictive demand forecasting are directly influencing procurement budgeting, allowing organizations to align ingredient sourcing with anticipated consumption patterns.
- Companies deploying robust inventory management software have recorded a 24% decrease in raw material waste compared to legacy manual processes. The deployment of self-ordering kiosks and kitchen display systems is revolutionizing front-of-house and back-of-house synchronization, yielding faster order turnaround and heightened accuracy. Simultaneously, exploratory investments in robotic food preparation are reshaping long-term capital expenditure planning by offsetting persistent labor constraints.
- Furthermore, nutritional profiling software allows menus to adapt swiftly to health-focused consumer trends, while supplier compliance monitoring guarantees that all sourced ingredients meet rigorous safety standards. These systemic upgrades are critical for maintaining operational resilience and preserving profit margins in a highly competitive sector.
What are the Key Data Covered in this Europe Foodservice Market Research and Growth Report?
-
What is the expected growth of the Europe Foodservice Market between 2026 and 2030?
-
USD 264.21 billion, at a CAGR of 5.9%
-
-
What segmentation does the market report cover?
-
The report is segmented by Sector (Commercial, and Non-commercial), Service (Conventional, Centralized, Ready-prepared, and Assembly-serve), Application (Restaurants, Employee canteens, Schools and kindergarten, Airlines, and Others) and Geography (Europe)
-
-
Which regions are analyzed in the report?
-
Europe
-
-
What are the key growth drivers and market challenges?
-
Increased snacking and indulgence consumption, Labor shortages in foodservice market in Europe
-
-
Who are the major players in the Europe Foodservice Market?
-
Aramark, Bertrand Group, Compass Group Plc, DO and CO Aktiengesellschaft, Dominos Pizza Inc., Elior Group SA, Gategroup, Greggs plc, Grupo Restalia, LE DUFF Group, LSG Group, Mitchells and Butlers plc, NORDSEE GmbH, Restaurant Brands Inc., Sodexo SA, Starbucks Corp., The Restaurant Group PLC, Vapiano SE and YUM Brands Inc.
-
Market Research Insights
- The Foodservice Market in Europe serves as a critical nexus for culinary innovation and logistical optimization. Increasing urbanization and dynamic work schedules are propelling demand for workplace dining solutions and ready-to-eat meal preparation. Operators optimizing these segments have achieved a 22% improvement in asset utilization rates by aligning production with concentrated consumer foot traffic.
- Concurrently, a surge in indulgent food consumption is prompting widespread bakery product diversification, yielding up to a 15% higher profit margin compared to standard staple items. The recovery of global mobility is also revitalizing travel industry catering, forcing businesses to upgrade their fulfillment logistics to meet rigorous volume requirements, ultimately driving efficiency and standardizing service delivery across borders.
We can help! Our analysts can customize this europe foodservice market research report to meet your requirements.
 RIA -
RIA - 
