
Eyewear Market Size 2026-2030
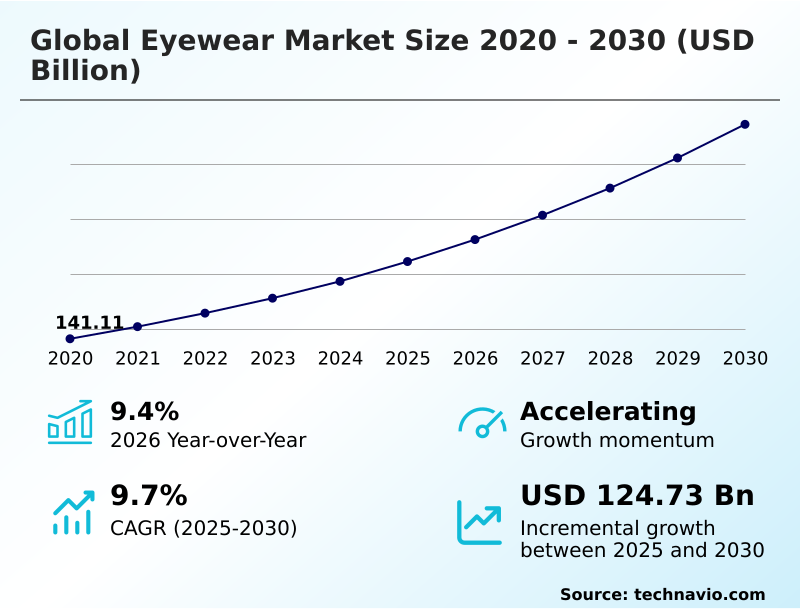
The eyewear market size is valued to increase by USD 124.73 billion, at a CAGR of 9.7% from 2025 to 2030. Rising prevalence of ophthalmic disorders and digital eye strain will drive the eyewear market.
Major Market Trends & Insights
- Europe dominated the market and accounted for a 32.9% growth during the forecast period.
- By Product - Eyeglass or spectacles segment was valued at USD 143.98 billion in 2024
- By Distribution Channel - Offline segment accounted for the largest market revenue share in 2024
Market Size & Forecast
- Market Opportunities: USD 194.95 billion
- Market Future Opportunities: USD 124.73 billion
- CAGR from 2025 to 2030 : 9.7%
Market Summary
- The eyewear market has evolved far beyond its traditional role in vision correction, transforming into a dynamic ecosystem where healthcare, fashion, and technology converge. The fundamental need for prescription spectacles and corrective lenses remains a primary driver, fueled by the global rise in ophthalmic disorders and digital eye strain.
- However, the industry's trajectory is increasingly shaped by technological advancements, such as the integration of augmented reality displays and ocular health tracking sensors into frames. For instance, manufacturers are now leveraging additive manufacturing for eyewear to implement hyper-personalization at scale.
- This allows for the creation of 3D-printed frames tailored to an individual's unique facial geometry, a process that has been shown to improve wearer comfort and reduce material waste by over 30% compared to traditional subtractive methods. This shift toward on-demand production also aligns with the growing consumer demand for sustainable manufacturing and bio-circular materials.
- As the market continues to mature, the distinction between a medical device and a connected personal accessory blurs, forcing companies to innovate across both product engineering and digital service delivery through direct-to-consumer models.
What will be the Size of the Eyewear Market during the forecast period?
Get Key Insights on Market Forecast (PDF) Get Free Sample
How is the Eyewear Market Segmented?
The eyewear industry research report provides comprehensive data (region-wise segment analysis), with forecasts and estimates in "USD million" for the period 2026-2030, as well as historical data from 2020-2024 for the following segments.
- Product
- Eyeglass or spectacles
- Sunglass
- Contact lenses
- Distribution channel
- Offline
- Online
- End-user
- Unisex
- Men
- Women
- Geography
- Europe
- Germany
- Italy
- France
- North America
- US
- Canada
- Mexico
- APAC
- China
- Japan
- India
- South America
- Brazil
- Argentina
- Middle East and Africa
- Saudi Arabia
- UAE
- South Africa
- Rest of World (ROW)
- Europe
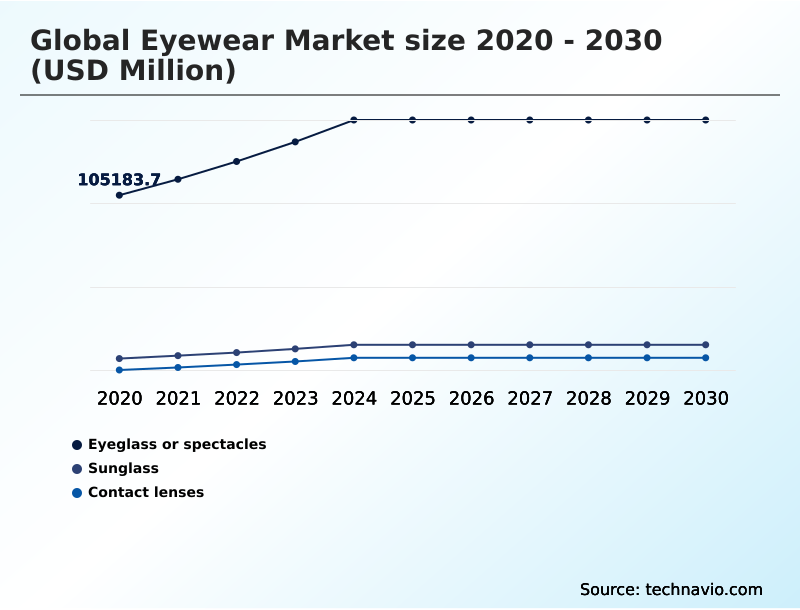
By Product Insights
The eyeglass or spectacles segment is estimated to witness significant growth during the forecast period.
The global eyewear market is segmented by product, distribution channel, end-user, and geography. The eyeglasses or spectacles segment represents the largest share, transitioning from a clinical necessity to a major fashion category.
This evolution is driven by the integration of advanced materials like lightweight titanium frames and sustainable bio-acetate frames, alongside innovations in lens geometry for digital eye strain mitigation.
Demand for hyper-personalization is met through virtual try-on technology and on-demand manufacturing, which enhances wearer comfort. Firms leveraging these bespoke solutions report a 25% reduction in product return rates.
The expansion of omnichannel shopping experiences further makes prescription spectacles accessible, solidifying this segment's role as the primary driver of revenue and innovation through both professional solutions and direct-to-consumer models.
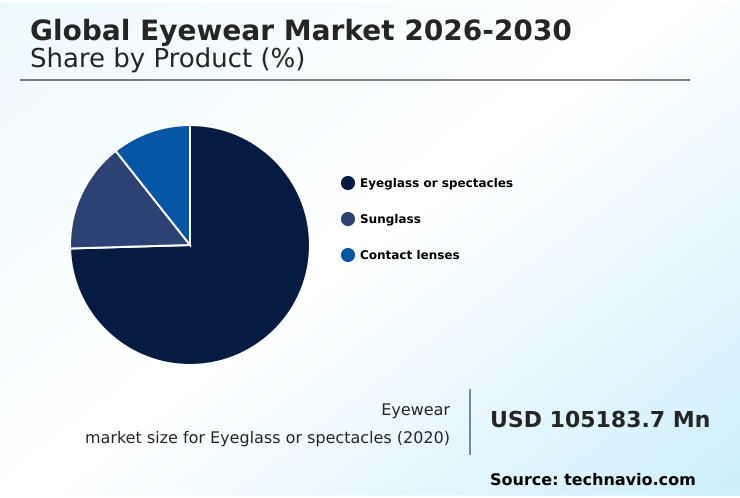
The Eyeglass or spectacles segment was valued at USD 143.98 billion in 2024 and showed a gradual increase during the forecast period.
Regional Analysis
Europe is estimated to contribute 32.9% to the growth of the global market during the forecast period.Technavio’s analysts have elaborately explained the regional trends and drivers that shape the market during the forecast period.
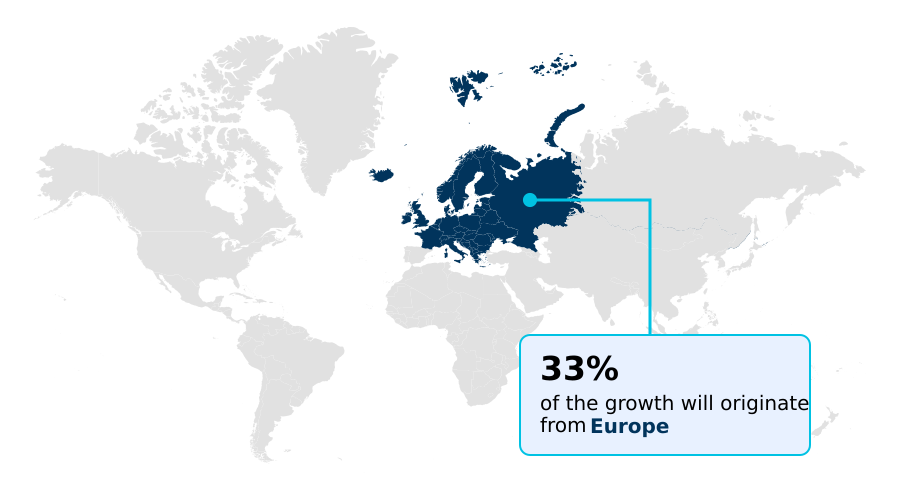
See How Eyewear Market Demand is Rising in Europe Get Free Sample
The geographic landscape of the global eyewear market reflects a clear division between mature, value-driven regions and high-growth, volume-driven territories.
In North America and Europe, the market is characterized by a strong emphasis on clinical vision management, the premiumization trend, and sustainable manufacturing, supported by robust healthcare infrastructure.
Conversely, the APAC region is the primary engine of growth, projected to account for over 28% of the market's incremental expansion due to a rising middle class and high prevalence of myopia.
The adoption of regionalized supply models in Europe to counter geopolitical requirements has increased logistics costs by 12% but improved delivery resilience.
This global fragmentation necessitates tailored strategies, balancing the demand for advanced vision correction solutions and eco-conscious manufacturing in established markets with the need for accessible and fashionable eyewear in emerging economies.
Market Dynamics
Our researchers analyzed the data with 2025 as the base year, along with the key drivers, trends, and challenges. A holistic analysis of drivers will help companies refine their marketing strategies to gain a competitive advantage.
- The global eyewear market's future is being shaped by deep technological and material science advancements. Innovations in lens technology, particularly advancements in photochromic lens technology and blue-light filtering for digital eye strain, are becoming standard consumer expectations.
- The debate over bio-acetate vs traditional acetate frames highlights the industry-wide shift toward sustainability, with firms increasingly adopting carbon-neutral manufacturing in the optical industry. This is further supported by the use of sustainable materials in luxury eyewear and advancements like enzyme-based processing.
- On the business model front, the impact of virtual try-on on eyewear sales is undeniable, fueling the growth of direct-to-consumer eyewear business models and the need for efficient supply chain logistics for bespoke eyewear.
- Hyper-personalization is being realized through 3d printing for custom-fit eyewear frames, while healthcare delivery is evolving with tele-optometry for remote vision screening and myopia management with specialized contact lenses. The rise of smart glasses brings challenges in smart glasses battery life but opens opportunities for augmented reality applications in smart glasses and integrating biometric sensors in eyewear.
- To ensure product authenticity and manage complex global supply chains, leading firms are adopting blockchain for eyewear supply chain transparency, which has proven to reduce counterfeit incidents at a rate five times greater than traditional tracking methods.
- The market is also seeing innovations in core components, such as the benefits of silicone hydrogel for contact lens wearers, high-index polymer properties for thin lenses, the anti-reflective coating application process, and polarized lens technology for glare reduction.
What are the key market drivers leading to the rise in the adoption of Eyewear Industry?
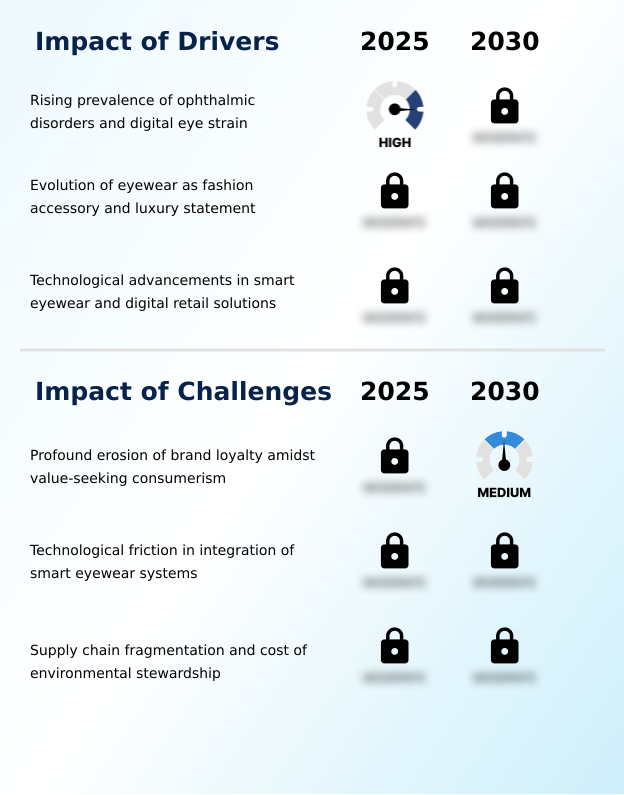
- The rising prevalence of ophthalmic disorders and increased digital eye strain are key drivers propelling market growth.
- Market growth is fundamentally driven by the non-discretionary need for vision correction solutions and the industry's evolution into a key fashion accessory segment.
- The increasing prevalence of ophthalmic disorders has intensified demand for advanced corrective lenses, including progressive lenses and multifocal lenses, for an aging population.
- Concurrently, heightened screen time has propelled the adoption of lenses with blue-light filtering, with demand for this feature growing by over 60% in the last year.
- Innovations in lens geometry and anti-reflective coatings, which can enhance visual clarity by up to 8%, further stimulate upgrades.
- This health-centric demand is complemented by the luxury eyewear market, where the premiumization trend is fueled by brand-conscious consumers viewing titanium frames and artisanal craftsmanship as statements of personal style, leading to more frequent purchasing cycles.
What are the market trends shaping the Eyewear Industry?
- The integration of multimodal AI and augmented reality into wearable devices is emerging as a significant market trend. This convergence is poised to redefine user interaction and product functionality.
- Key market trends are centered on the convergence of technology and sustainability, fundamentally altering product design and consumer engagement. The rise of multimodal AI wearables is transforming prescription spectacles into connected devices, integrating features like bone-conduction transducers and heads-up displays for a seamless digital experience.
- This shift toward wearable technology is complemented by a strong push for hyper-personalization, where on-demand manufacturing and custom-fit eyewear are becoming mainstream. The adoption of virtual try-on technology has been a critical enabler, boosting online conversion rates by as much as 40%.
- Simultaneously, the industry is embracing a paradigm shift toward eco-conscious manufacturing, with bio-circular materials and carbon-neutral manufacturing processes gaining prominence. Firms that have adopted these sustainable practices report a 15% improvement in brand perception, particularly among environmentally-aware consumers.
What challenges does the Eyewear Industry face during its growth?
- The profound erosion of brand loyalty, driven by a surge in value-seeking consumerism, presents a significant challenge to industry growth.
- The market faces significant structural challenges from brand loyalty erosion and complex supply chain fragmentation. The rise of value-seeking consumerism, amplified by transparent online pricing, has diminished the power of heritage brands, particularly in the mass market.
- Simultaneously, geopolitical requirements are forcing a shift toward regionalized supply models and near-shoring production, which has increased manufacturing overhead by an average of 18% for many firms. This supply chain fragmentation also contributes to a 5% increase in lead times for critical components like high-index polymers.
- Furthermore, the mandate for environmental stewardship and the transition to a circularity in supply chain adds operational complexity and cost, making it difficult to balance sustainability goals with competitive pricing in an increasingly discerning market.
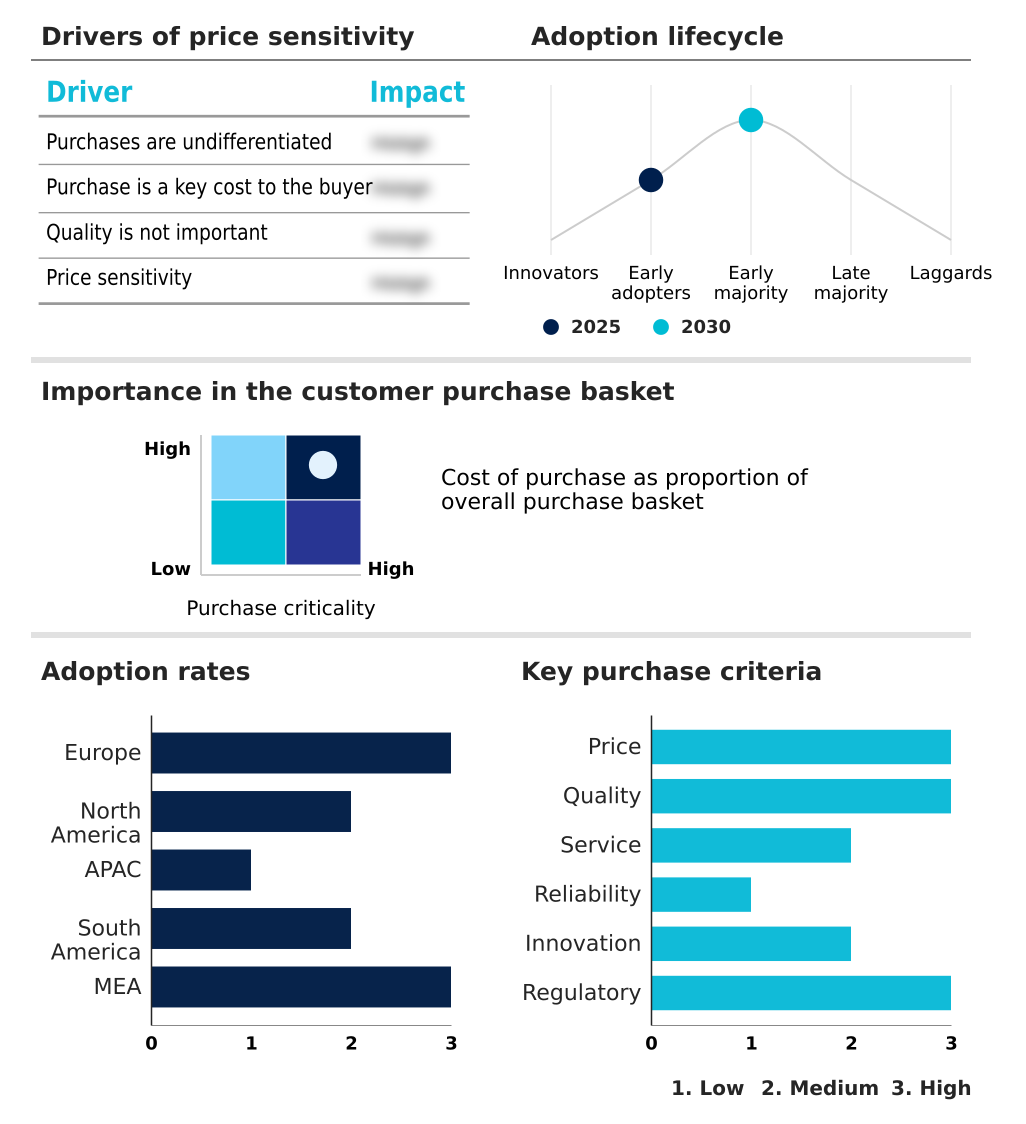
Exclusive Technavio Analysis on Customer Landscape
The eyewear market forecasting report includes the adoption lifecycle of the market, covering from the innovator’s stage to the laggard’s stage. It focuses on adoption rates in different regions based on penetration. Furthermore, the eyewear market report also includes key purchase criteria and drivers of price sensitivity to help companies evaluate and develop their market growth analysis strategies.
Customer Landscape of Eyewear Industry
Competitive Landscape
Companies are implementing various strategies, such as strategic alliances, eyewear market forecast, partnerships, mergers and acquisitions, geographical expansion, and product/service launches, to enhance their presence in the industry.
Alcon Inc. - Offerings center on a curated portfolio of designer and lifestyle eyewear brands, targeting diverse consumer segments through distinct value propositions.
The industry research and growth report includes detailed analyses of the competitive landscape of the market and information about key companies, including:
- Alcon Inc.
- Bausch Lomb Corp.
- Carl Zeiss AG
- Charmant Inc.
- De Rigo Vision SpA
- EssilorLuxottica
- Hoya Corp.
- JINS Holdings Inc.
- Johnson and Johnson Services
- Kering Eyewear
- Marchon Eyewear Inc.
- Marcolin SpA
- Menicon Co. Ltd.
- Rodenstock GmBH
- Safilo Group SpA
- TEK Optical Inc.
- The Cooper Companies Inc.
- Titan Co. Ltd.
- Topology Eyewear
Qualitative and quantitative analysis of companies has been conducted to help clients understand the wider business environment as well as the strengths and weaknesses of key industry players. Data is qualitatively analyzed to categorize companies as pure play, category-focused, industry-focused, and diversified; it is quantitatively analyzed to categorize companies as dominant, leading, strong, tentative, and weak.
Recent Development and News in Eyewear market
- In March, 2025, Alcon Inc. finalized its acquisition of Lensar for approximately USD 430 million to enhance its surgical and diagnostic capabilities.
- In March, 2025, the United States White House issued an Executive Order focused on modernizing defense acquisitions, setting a precedent that influenced commercial procurement standards, including those affecting domestic manufacturing resilience.
- In April, 2025, the MIDO Eyewear Show in Milan highlighted a return to expressive designs and the integration of bio-based materials, reflecting a regional trend toward balancing aesthetic innovation with environmental responsibility.
- In May, 2025, Synsam Group opened its NK Eyewear and Optics luxury retail destination, which integrates clinical services with high-end fashion to create an experiential retail environment.
Dive into Technavio’s robust research methodology, blending expert interviews, extensive data synthesis, and validated models for unparalleled Eyewear Market insights. See full methodology.
| Market Scope | |
|---|---|
| Page number | 293 |
| Base year | 2025 |
| Historic period | 2020-2024 |
| Forecast period | 2026-2030 |
| Growth momentum & CAGR | Accelerate at a CAGR of 9.7% |
| Market growth 2026-2030 | USD 124732.2 million |
| Market structure | Fragmented |
| YoY growth 2025-2026(%) | 9.4% |
| Key countries | Germany, Italy, France, UK, Spain, The Netherlands, US, Canada, Mexico, China, Japan, India, South Korea, Australia, Indonesia, Brazil, Argentina, Chile, Saudi Arabia, UAE, South Africa, Turkey and Egypt |
| Competitive landscape | Leading Companies, Market Positioning of Companies, Competitive Strategies, and Industry Risks |
Research Analyst Overview
- The global eyewear market is undergoing a significant transformation, moving beyond simple vision correction to become an integrated domain of health technology and personal expression. This evolution is driven by material innovations like high-index polymers, bio-acetate frames, and advanced photochromic technology, which are now standard.
- Core technologies such as digital surfacing for corrective lenses and blue-light filtering are addressing modern lifestyle needs. The industry's competitive frontier is defined by the adoption of virtual try-on technology, 3d face-mapping, and additive manufacturing for eyewear, which together enable unprecedented product customization.
- Boardroom decisions are increasingly focused on investing in these capabilities, as the integration of 3d-printed frames and bespoke solutions has been shown to reduce prototyping cycles by over 50%.
- The market's future hinges on merging functionality—from progressive lenses and toric contact lenses for complex corrections to myopia management and digital eye strain mitigation—with advanced concepts like augmented reality displays and ocular health tracking, creating a new class of multifunctional, high-value products.
What are the Key Data Covered in this Eyewear Market Research and Growth Report?
-
What is the expected growth of the Eyewear Market between 2026 and 2030?
-
USD 124.73 billion, at a CAGR of 9.7%
-
-
What segmentation does the market report cover?
-
The report is segmented by Product (Eyeglass or spectacles, Sunglass, and Contact lenses), Distribution Channel (Offline, and Online), End-user (Unisex, Men, and Women) and Geography (Europe, North America, APAC, South America, Middle East and Africa)
-
-
Which regions are analyzed in the report?
-
Europe, North America, APAC, South America and Middle East and Africa
-
-
What are the key growth drivers and market challenges?
-
Rising prevalence of ophthalmic disorders and digital eye strain, Profound erosion of brand loyalty amidst value-seeking consumerism
-
-
Who are the major players in the Eyewear Market?
-
Alcon Inc., Bausch Lomb Corp., Carl Zeiss AG, Charmant Inc., De Rigo Vision SpA, EssilorLuxottica, Hoya Corp., JINS Holdings Inc., Johnson and Johnson Services, Kering Eyewear, Marchon Eyewear Inc., Marcolin SpA, Menicon Co. Ltd., Rodenstock GmBH, Safilo Group SpA, TEK Optical Inc., The Cooper Companies Inc., Titan Co. Ltd. and Topology Eyewear
-
Market Research Insights
- Market dynamics are defined by a sophisticated interplay between technological innovation and evolving consumer behaviors. The rise of direct-to-consumer models, leveraging e-commerce platforms and virtual try-on technology, is fundamentally reshaping the retail landscape, with some digital-native brands achieving customer acquisition costs up to 25% lower than traditional brick-and-mortar competitors.
- This shift coincides with a premiumization trend, where artisanal craftsmanship and advanced materials drive value in the luxury eyewear market. Concurrently, a move toward sustainable manufacturing is compelling firms to adopt bio-circular materials, a strategy that has been shown to improve brand perception scores by over 15% among younger demographics.
- This focus on environmental stewardship and transparent supply chains is becoming a critical differentiator in an increasingly competitive field.
We can help! Our analysts can customize this eyewear market research report to meet your requirements.
 RIA -
RIA - 
