Fall Protection Equipment Market Size 2025-2029
The fall protection equipment market size is forecast to increase by USD 1.49 billion at a CAGR of 8.8% between 2024 and 2029.
- The market is witnessing significant growth due to the increasing demand from various industries, particularly construction and public safety. With the construction sector experiencing a boom, the need for strong fall protection solutions is on the rise. Moreover, the growing popularity of recreational activities that involve heights, such as rock climbing and zip lining, is driving the demand for fall protection equipment. However, the market faces challenges such as poor enforcement of workplace safety regulations in developing countries, which may hinder market growth. Additionally, the increasing adoption of workwear integrated with fall protection features in industries like public transportation and telecom projects is a notable trend.
- Furthermore, e-commerce businesses are increasingly selling fall protection equipment online, making it more accessible to end-users. The wire harnesses segment is also expected to witness considerable growth due to the rising demand for fall protection solutions In the telecom sector. Overall, the market is expected to continue its growth trajectory, driven by these trends and challenges.
What will be the Size of the Fall Protection Equipment Market During the Forecast Period?

- The market encompasses a range of accessories and systems designed to safeguard workers from falls at heights or in hazardous environments. Key industries driving market growth include construction, confined spaces such as tanks and vessels, and public transportation infrastructure. Fall protection solutions include full body harnesses, chest harnesses, safety nets, body belts, and suspension belts. These products mitigate risks associated with repetitive stress injuries and muscle overuse. Fall protection systems are also crucial for rescue operations and adhere to workplace safety regulations in various sectors, prioritizing employee wellbeing. Additionally, initiatives in religious establishments and public safety infrastructures contribute to market expansion.
- The market's size is substantial, with continuous growth attributed to increasing construction spending and the importance of ensuring public safety. Guardrails and safety net systems are complementary offerings withIn the market.
How is this Fall Protection Equipment Industry segmented and which is the largest segment?
The industry research report provides comprehensive data (region-wise segment analysis), with forecasts and estimates in "USD million" for the period 2025-2029, as well as historical data from 2019-2023 for the following segments.
- Product
- Anchors and connectors
- Bodywear
- Devices
- Others
- End-user
- Construction
- Energy and utilities
- Oil and gas
- Others
- Geography
- North America
- Canada
- US
- Europe
- Germany
- UK
- France
- Italy
- Spain
- APAC
- China
- India
- Japan
- South America
- Middle East and Africa
- North America
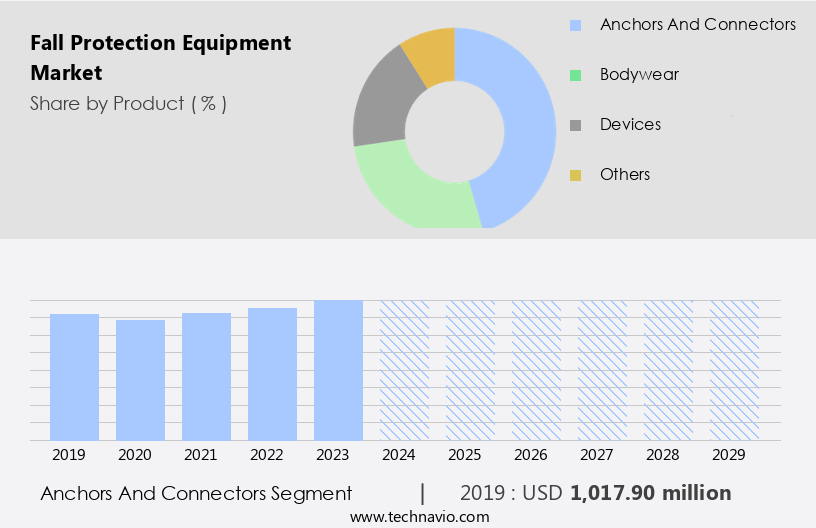
By Product Insights
- The anchors and connectors segment is estimated to witness significant growth during the forecast period.
The market plays a crucial role in safeguarding workers from falls in various industries, including construction and maintenance. These safety devices consist of bodywear, such as full body harnesses, chest harnesses, body belts, and suspension belts, to which anchors and connectors are attached. Anchors, including those for concrete, steel structures, and roofs, provide secure attachment points. Connectors, such as lanyards and lifelines, link the harness to the anchor, preventing falls and ensuring worker safety. Fall protection equipment, including safety nets, rescue kits, and guardrails, is essential for industries with a high risk of falls, repetitive stress injuries, and muscle overuse.
Compliance with safety regulations is paramount in ensuring employee wellbeing and workplace safety. Key industries include construction, transportation, mining, energy and utility, telecom, and manufacturing sites. Fall protection systems are available as on-body and off-body products, with e-commerce networks facilitating easy access. Organic and inorganic growth strategies are employed by market players to expand their offerings and cater to diverse customer needs.
Get a glance at the market report of share of various segments Request Free Sample
The Anchors and connectors segment was valued at USD 1.02 billion in 2019 and showed a gradual increase during the forecast period.
Regional Analysis
- APAC is estimated to contribute 34% to the growth of the global market during the forecast period.
Technavio's analysts have elaborately explained the regional trends and drivers that shape the market during the forecast period.

For more insights on the market size of various regions, Request Free Sample
The market in the US and Canada is driven by stringent workplace safety regulations and the prevalence of worker safety laws. The US, with its large-scale construction projects, extensive oil and gas, mining, and manufacturing industries, contributes significantly to the regional market. The construction industry's growth in the US, fueled by increasing demand for residential properties and industrial investment, further boosts market expansion. Fall protection equipment, including full body harnesses, chest harnesses, safety nets, body belts, suspension belts, and rescue kits, is essential for industries with workers operating at heights or in confined spaces, such as tanks, vessels, sewers, and telecom projects.
Fall protection systems, guardrails, and skylight guards are also crucial for workplace safety. Key industries like transportation, mining, energy and utility, and telecom adopt various fall protection equipment for employee wellbeing and regulatory compliance. The market encompasses both on-body and off-body products, with e-commerce networks facilitating their distribution.
Market Dynamics
Our researchers analyzed the data with 2024 as the base year, along with the key drivers, trends, and challenges. A holistic analysis of drivers will help companies refine their marketing strategies to gain a competitive advantage.
What are the key market drivers leading to the rise in the adoption of Fall Protection Equipment Industry?
Increasing demand for fall protection equipment from the construction industry is the key driver of the market.
- The market encompasses equipment designed to prevent workers from falling at heights or into confined spaces, such as Access systems, including fall arrest systems, safety nets, body belts, chest harnesses, and suspension belts. This market caters to various industries, including construction, transportation, mining, energy and utility, telecom, and manufacturing sites. Workers in these sectors are exposed to occupational hazards, including repetitive stress injuries and muscle overuse, which necessitate the use of fall protection equipment. Construction sites, in particular, require extensive use of fall protection equipment due to the nature of the work. Workers often operate at heights on platforms, near excavated areas, and on steep roofs.
- With the increasing number of construction projects worldwide, there is a significant demand for fall protection equipment. Smart city projects, which involve the creation of modern infrastructure, offer lucrative opportunities for construction companies and, consequently, a rise in demand for fall protection equipment. Fall protection equipment is categorized into on-body products, such as full body harnesses and chest harnesses, and off-body products, including safety nets, guard rails, and soft goods like skylight guards. Additionally, rescue operations necessitate the use of rescue kits, which are essential for industries with high-risk environments. The market is driven by safety regulations and the importance of worker safety.
What are the market trends shaping the Fall Protection Equipment Industry?
Increasing demand for fall protection equipment for recreational activities is the upcoming market trend.
- The market encompasses applications in the construction, industrial, and utility sectors, driven by the necessity to ensure worker safety at heights. Simultaneously, a niche market exists for recreational activities such as rock climbing, zip-lining, ice climbing, and mountaineering. This market segment caters to the safety and protection of both amateurs and professionals, fueled by the rising popularity of these activities, particularly in developed countries. The demand for personal protective equipment, including fall protection equipment, is on the rise as a result. The construction, transportation, mining, energy and utility, telecom, and manufacturing industries are significant contributors to the market's growth.
- Additionally, fall protection systems are essential in confined spaces like tanks, vessels, sewers, and public safety infrastructures. The market offers a range of products, including full body harnesses, chest harnesses, safety nets, body belts, suspension belts, rescue operations equipment, and off-body products. Employee wellbeing, workplace safety regulations, and public transportation initiatives further boost market growth. Despite the importance of quality fall protection equipment, there remains a demand for low cost alternatives, necessitating a balance between affordability and safety. Organic growth strategies, such as product innovation and expansion into new markets, as well as inorganic growth strategies, like mergers and acquisitions, are key market trends.
What challenges does the Fall Protection Equipment Industry face during its growth?
Poor enforcement of workplace safety regulations in developing countries is a key challenge affecting the industry growth.
- The market encompasses Access systems, Confined spaces, Tanks, Vessels, Sewers, and various industries such as Construction, Transportation, Mining, Energy and utility, Telecom, and more. Workers in these sectors are at risk of fall injuries and muscle overuse, making protective equipment essential. Fall protection equipment includes Full body harnesses, Chest harnesses, Safety nets, Body belts, Suspension belts, Rescue operations equipment, and more. Developed countries, including the US, UK, Germany, France, and Canada, dominate the market due to stringent safety regulations and a focus on worker safety. In contrast, developing countries, despite the expansion of residential and commercial construction, utility development, and infrastructure projects, contribute minimally to market growth.
- The absence of well-defined fall safety regulations in these countries hinders the demand for fall protection equipment. For instance, in Kenya, three regulatory bodies - the Occupational Safety and Health Act (OSHA), the Petroleum (Exploration and Production) Act, and the Environmental Management and Coordination Act (EMCA) - govern health and safety issues in its oil sector. Ensuring compliance with these regulations and providing adequate fall protection systems is crucial for businesses to prioritize employee wellbeing and adhere to workplace safety regulations. The market offers a range of products, including on-body products, off-body products, Skylight guards, Guard rails, Soft Goods, and Hard Goods.
Exclusive Customer Landscape
The market forecasting report includes the adoption lifecycle of the market, covering from the innovator's stage to the laggard's stage. It focuses on adoption rates in different regions based on penetration. Furthermore, the market report also includes key purchase criteria and drivers of price sensitivity to help companies evaluate and develop their market growth analysis strategies.

Customer Landscape
Key Companies & Market Insights
Companies are implementing various strategies, such as strategic alliances, market forecast, partnerships, mergers and acquisitions, geographical expansion, and product/service launches, to enhance their presence in the industry.
ABS Safety GmbH: The company offers fall protection equipment such as ABS Lock III BE Pro, ABS Lock X T 21, and ABS Lock OnTop Weight.
The industry research and growth report includes detailed analyses of the competitive landscape of the market and information about key companies, including:
- 3M Co.
- ABS Safety GmbH
- Adolf Wurth GmbH and Co. KG
- Bergman and Beving AB
- Buckingham Manufacturing Co Inc
- County Safety Services Ltd.
- FallTech
- French Creek Production Inc.
- Frontline
- Honeywell International Inc.
- KARAM Group
- KwikSafety
- PETZL Distribution
- Pure Safety Group Inc.
- Safe Approach Inc.
- Super Anchor Safety
- Tritech Fall Protection Systems Inc.
- Uviraj Group
- Webb Rite Safety
- Werner Co.
Qualitative and quantitative analysis of companies has been conducted to help clients understand the wider business environment as well as the strengths and weaknesses of key industry players. Data is qualitatively analyzed to categorize companies as pure play, category-focused, industry-focused, and diversified; it is quantitatively analyzed to categorize companies as dominant, leading, strong, tentative, and weak.
Research Analyst Overview
The market encompasses a range of access systems designed to ensure worker safety at heights and in confined spaces. These systems cater to various industries such as construction, transportation, mining, energy and utility, telecom, and manufacturing sites, among others. The need is driven by the inherent hazards associated with working at heights and the risk of repetitive stress injuries and muscle overuse. Access systems encompass a diverse array of products, including full body harnesses, chest harnesses, safety nets, body belts, suspension belts, and rescue operations equipment. Full body harnesses provide comprehensive protection, while chest harnesses offer more limited coverage.
Moreover, safety nets and body belts are designed for specific applications, while suspension belts are used for vertical rope access. The equipment is essential in industries where workers are regularly exposed to heights, such as construction and telecom projects. In addition, confined spaces in tanks, vessels, sewers, and other structures require specialized fall protection systems. The market also caters to on-body and off-body products, including skylight guards, guard rails, soft goods, and hard goods, as well as rescue kits and safety net systems. The market is influenced by various factors, including safety regulations, the quality and cost of products, and the increasing focus on employee wellbeing.
Furthermore, the market is characterized by both organic and inorganic growth strategies, with companies investing in research and development and mergers and acquisitions to expand their product offerings and reach new markets. The demand is driven by the rising population and the increasing number of construction projects and industrial activities. The market is also influenced by public transportation initiatives, workplace safety regulations, and the need to ensure safety in religious establishments and public safety infrastructures. The market is diverse and dynamic, with new technologies and product innovations continually emerging. The market is expected to grow significantly in the coming years, driven by the increasing awareness of workplace safety and the need to protect workers from the hazards associated with working at heights and in confined spaces.
|
Market Scope |
|
|
Report Coverage |
Details |
|
Page number |
210 |
|
Base year |
2024 |
|
Historic period |
2019-2023 |
|
Forecast period |
2025-2029 |
|
Growth momentum & CAGR |
Accelerate at a CAGR of 8.8% |
|
Market growth 2025-2029 |
USD 1.49 billion |
|
Market structure |
Fragmented |
|
YoY growth 2024-2025(%) |
7.9 |
|
Key countries |
US, China, Germany, Canada, UK, Japan, France, India, Italy, and Spain |
|
Competitive landscape |
Leading Companies, Market Positioning of Companies, Competitive Strategies, and Industry Risks |
What are the Key Data Covered in this Market Research and Growth Report?
- CAGR of the industry during the forecast period
- Detailed information on factors that will drive the market growth and forecasting between 2025 and 2029
- Precise estimation of the size of the market and its contribution of the industry in focus to the parent market
- Accurate predictions about upcoming growth and trends and changes in consumer behaviour
- Growth of the market across North America, Europe, APAC, South America, and Middle East and Africa
- Thorough analysis of the market's competitive landscape and detailed information about companies
- Comprehensive analysis of factors that will challenge the market growth of industry companies
We can help! Our analysts can customize this market research report to meet your requirements.
 RIA -
RIA - 
