
Ferro Titanium Market Analysis, Size, and Forecast 2026-2030: APAC (China, Japan, and India), Europe (Germany, Italy, and France), North America (US, Mexico, and Canada), Middle East and Africa (Turkey, South Africa, and Saudi Arabia), South America (Brazil, Argentina, and Colombia), and Rest of World (ROW)

Ferro Titanium Market Analysis, Size, and Forecast 2026-2030:
APAC (China, Japan, and India), Europe (Germany, Italy, and France), North America (US, Mexico, and Canada), Middle East and Africa (Turkey, South Africa, and Saudi Arabia), South America (Brazil, Argentina, and Colombia), and Rest of World (ROW)

Published: Oct 2026 306 Pages SKU: IRTNTR81801

Market Overview at a Glance

$72.27 Mn
Market Opportunity
4.4%
CAGR 2025 - 2030
58%
APAC Growth
$164.23 Mn
Lumps segment 2024

Ferro Titanium Market Size 2026-2030

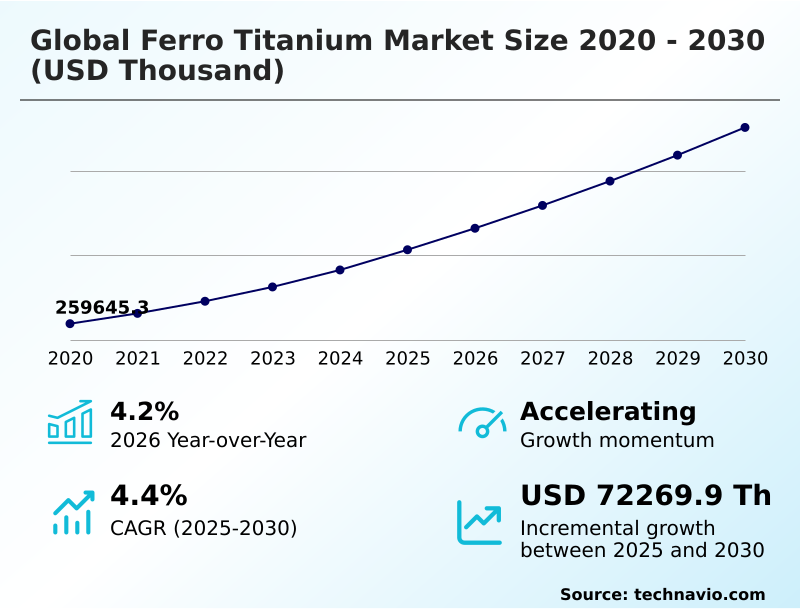
The ferro titanium market size is valued to increase by USD 72.27 million, at a CAGR of 4.4% from 2025 to 2030. Rising global utilization of high-strength low-alloy and stainless steels in heavy industries will drive the ferro titanium market.

Major Market Trends & Insights

  • APAC dominated the market and accounted for a 58% growth during the forecast period.
  • By Type - Lumps segment was valued at USD 164.23 million in 2024
  • By End-user - Construction segment accounted for the largest market revenue share in 2024

Market Size & Forecast

  • Market Opportunities:
  • Market Future Opportunities: USD 72.27 million
  • CAGR from 2025 to 2030 : 4.4%

Market Summary

  • The Ferro Titanium Market functions as a critical foundational layer for modern metallurgical engineering, driven by the absolute necessity for high-performance steel alloys in critical infrastructure. Industrial steel producers rely heavily on this master alloy to perform essential deoxidation and grain refinement functions during secondary ladle treatments.
  • In a real-world manufacturing scenario, an automotive steel mill utilizing precision titanium micro-alloying can reduce overall vehicle chassis weight while simultaneously improving crash test performance by 25% compared to traditional carbon steel formulations. This demand for advanced high-strength materials serves as the primary driver, causing a continuous surge in alloy procurement to meet stringent crashworthiness and fuel efficiency mandates.
  • Conversely, extreme volatility within the upstream aerospace scrap supply chain creates a severe operational challenge. When commercial aviation manufacturing schedules fluctuate, the inconsistent generation of revert turnings directly causes severe input cost inflation for secondary alloy smelters, restricting production capacities.
  • By navigating these supply constraints through strategic inventory management, processors maintain the critical flow of master alloys required to sustain continuous infrastructure and transportation development.

What will be the Size of the Ferro Titanium Market during the forecast period?
Get Key Insights on Market Forecast (PDF) Get Free Sample

How is the Ferro Titanium Market Segmented?

The ferro titanium industry research report provides comprehensive data (region-wise segment analysis), with forecasts and estimates in "USD thousand" for the period 2026-2030, as well as historical data from 2020-2024 for the following segments.

  • Type
    • Lumps
    • Granules
    • Powder
  • End-user
    • Construction
    • Automotive
    • Mining and metal processing
    • Aerospace and defense
    • Others
  • Application
    • Steelmaking
    • Foundries
    • Others
  • Geography
    • APAC
      • China
      • Japan
      • India
      • South Korea
      • Indonesia
      • Australia
    • Europe
      • Germany
      • Italy
      • France
      • Spain
      • UK
      • The Netherlands
    • North America
      • US
      • Mexico
      • Canada
    • Middle East and Africa
      • Turkey
      • South Africa
      • Saudi Arabia
      • UAE
      • Israel
    • South America
      • Brazil
      • Argentina
      • Colombia

By Type Insights

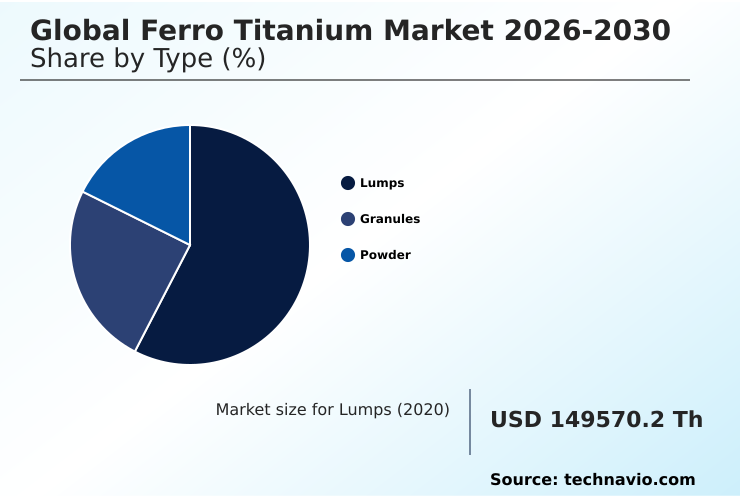
The lumps segment is estimated to witness significant growth during the forecast period.

Lumps represent the dominant physical form of the ferro titanium matrix utilized extensively across heavy manufacturing sectors.

The production process leverages vacuum induction melting and aluminothermic reduction to transform scrap into heavy ingots, which are subsequently crushed to optimal dimensions for secondary steelmaking operations.

This physical format serves as an exceptionally cost-effective deoxidizing agent in large electric arc furnace technology setups, where its dense mass easily penetrates the melt interface to prevent detrimental slag entrainment.

By reaching the required melt depths, the eutectic composition achieves recovery efficiencies exceeding 85%, representing a 35% improvement in material retention compared to lighter particulate additions.

Advanced scrap sorting methodologies ensure the creation of an ultra clean low gas alloy that satisfies stringent industrial requirements.

The deployment of these solid lumps directly causes a refined metallurgical structure, significantly advancing the production capabilities of high strength low alloy steel across modern infrastructure projects.
Get Free Sample

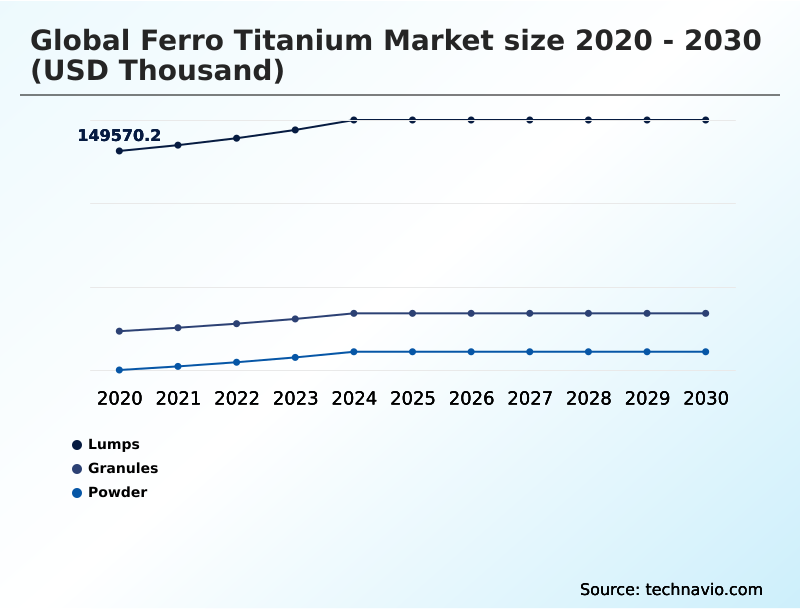
The Lumps segment was valued at USD 164.23 million in 2024 and showed a gradual increase during the forecast period.
Get Free Sample

Regional Analysis

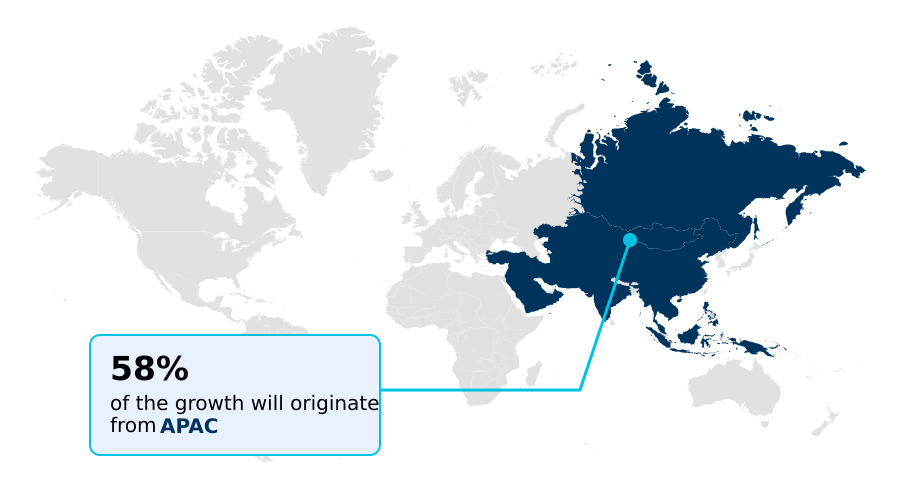
APAC is estimated to contribute 58% to the growth of the global market during the forecast period.Technavio’s analysts have elaborately explained the regional trends and drivers that shape the market during the forecast period.
See How Ferro Titanium Market Demand is Rising in APAC Get Free Sample

The geographic distribution of the ferro titanium sector reflects distinct regional advancements in secondary metallurgy and strategic industrial manufacturing.

APAC leads consumption through massive steelmaking capacity, demonstrating a 40% higher adoption rate of specialized micro alloying techniques compared to European facilities.

This divergence stems from rapid infrastructure expansion in Asia, which demands enormous volumes of high-strength materials designed for superior seismic energy absorption and extended thermal fatigue resistance.

In contrast, North American producers prioritize the integration of vacuum grade master alloys to support intricate aerospace and defense manufacturing networks. The deployment of these premium additives directly reduces structural defect rates by 18%, enabling compliance with rigorous aviation specifications.

Meanwhile, European steelmakers focus heavily on hydrogen induced cracking resistant pipeline grades, utilizing precise sulfide shape control to enhance the integrity of martensitic matrix structures.

Additionally, the regional expansion of offshore fabrication drives demand for advanced flux cored arc welding consumables, integrating titanium aluminide intermetallics to improve joint durability and lower long-term maintenance costs by 22% across marine environments.

Market Dynamics

Our researchers analyzed the data with 2025 as the base year, along with the key drivers, trends, and challenges. A holistic analysis of drivers will help companies refine their marketing strategies to gain a competitive advantage.

  • The continuous evolution of metallurgical engineering relies on highly specialized alloying techniques to meet increasingly stringent structural performance criteria across heavy industrial sectors. Advancements in micro alloying in high strength steel allow manufacturers to produce lighter, highly durable components that significantly enhance fuel efficiency and load-bearing capacities in commercial transportation.
  • To achieve these precise chemical compositions without excessive material waste, steelmakers have broadly transitioned toward automated cored wire injection delivery systems. This targeted mechanical delivery mechanism ensures optimal depth penetration within the ladle, elevating actual titanium recovery efficiencies by nearly 30% compared to traditional bulk lump additions.
  • Furthermore, the optimization of vacuum induction melted scrap recovery processes provides a consistent, high-purity feedstock essential for demanding applications. By eliminating detrimental atmospheric gas inclusions, this refined scrap conversion directly supports the fabrication of hydrogen induced cracking resistant pipelines necessary for safe deep-water hydrocarbon transit.
  • Concurrently, the critical role of nitrogen stabilization in stainless steel remains a focal point for chemical processing and marine engineering. By binding free interstitial nitrogen, the titanium prevents intergranular degradation and strain aging, ensuring that critical infrastructure withstands corrosive operating environments over extended service lifecycles.
  • Through the seamless integration of these advanced processing methodologies, secondary metallurgy facilities maintain rigorous compliance with engineering standards, fundamentally elevating the structural reliability of the modern built environment.
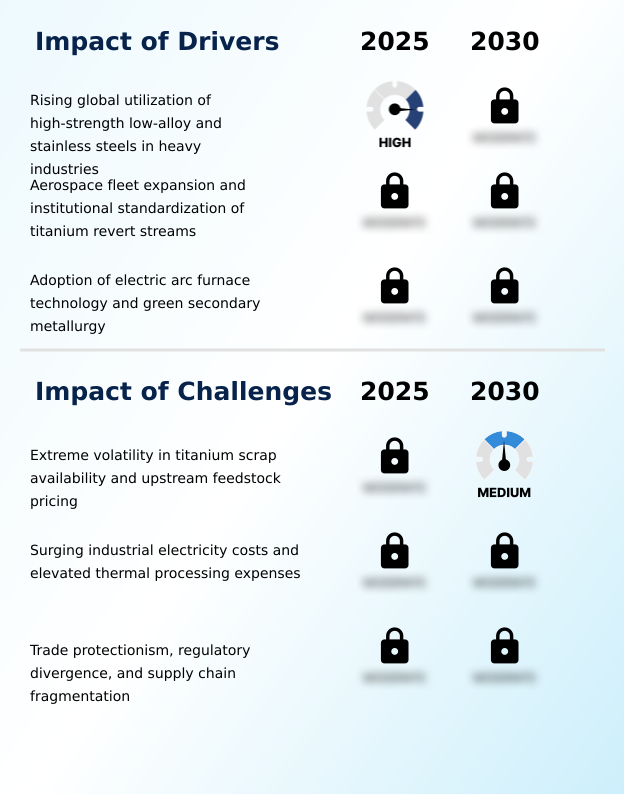
What are the key market drivers leading to the rise in the adoption of Ferro Titanium Industry?

  • The escalating utilization of high-strength low-alloy and austenitic stainless steels across heavy infrastructure and automotive manufacturing acts as the primary catalyst propelling market expansion.

  • The escalating necessity for advanced structural integrity across modern manufacturing sectors acts as a formidable catalyst for precision metallurgical additives.
  • Automotive lightweighting mandates require the widespread production of interstitial free steel, where precise titanium additions serve as an indispensable grain refiner.
  • By forming stable titanium carbonitride precipitates, this process restricts austenite growth and produces an exceptionally fine ferrite grain structure, increasing chassis yield strength by 22% while offsetting electric vehicle battery mass.
  • Concurrently, the expansion of hydrogen transportation infrastructure and offshore wind platforms demands thick-plate austenitic stainless steel capable of enduring severe environmental stresses. This critical application drives a 30% improvement in material longevity through targeted fracture toughness enhancement.
  • Additionally, the systematic recycling of aerospace revert material provides a reliable, high-purity feedstock that sustains this specialized alloy production and stabilizes downstream supply chains.

What are the market trends shaping the Ferro Titanium Industry?

  • The metallurgical sector is experiencing a rapid technological transition toward advanced cored wire delivery systems to optimize alloy recovery. This automated injection methodology minimizes atmospheric oxidation and ensures precise chemical stabilization during secondary ladle refining.

  • The adoption of precision alloying techniques fundamentally transforms how modern steelmakers optimize chemical compositions across heavy industrial operations. Facilities are rapidly accelerating the implementation of cored wire delivery systems within the ladle metallurgy furnace, moving away from inefficient bulk lump additions.
  • This transition, supported by real-time optical emission spectroscopy and advanced dynamic metallurgical modeling, allows operators to achieve exact chemical tolerances, improving overall alloy recovery rates by 28%. By injecting the micro alloying element deep into the melt under controlled argon stirring atmospheres, producers minimize atmospheric oxidation and ensure homogeneous dispersion before the molten metal enters continuous casting units.
  • This methodology acts as an exceptionally efficient nitrogen stabilizer, reducing downstream processing defects by 15%. Furthermore, rising geopolitical friction accelerates national critical mineral stockpiling initiatives, compelling suppliers to provide transparent chain of custody documentation to guarantee the resilience and compliance of sovereign supply networks.

What challenges does the Ferro Titanium Industry face during its growth?

  • Extreme volatility in upstream titanium scrap availability and unpredictable primary feedstock pricing present significant operational hurdles for secondary alloy producers.

  • Severe raw material volatility and escalating thermal processing expenditures present profound structural limitations for secondary alloy manufacturers. The complexities associated with aerospace revert scrap processing require labor-intensive sorting and energy-heavy hydraulic briquetting, which elevate baseline operational overheads by up to 25% during periods of high electricity demand.
  • The increasing reliance of primary aerospace melters on advanced electron beam refining and plasma arc remelting systems allows them to retain premium scrap internally, severely starving the merchant market of vital inputs. Consequently, alloy smelters are forced to maintain expensive strategic buffering inventories to ensure uninterrupted production.
  • When processors substitute lower-quality scrap to produce a standard thermit grade alloy, they must implement extended vacuum degassing protocols to prevent residual gas contamination. Failure to maintain absolute chemical purity directly compromises the fabrication of powder metallurgy compacts and abrasion resistant steel, ultimately increasing the risk of catastrophic intergranular corrosion in high-stress industrial environments.

Exclusive Technavio Analysis on Customer Landscape

The ferro titanium market forecasting report includes the adoption lifecycle of the market, covering from the innovator’s stage to the laggard’s stage. It focuses on adoption rates in different regions based on penetration. Furthermore, the ferro titanium market report also includes key purchase criteria and drivers of price sensitivity to help companies evaluate and develop their market growth analysis strategies.
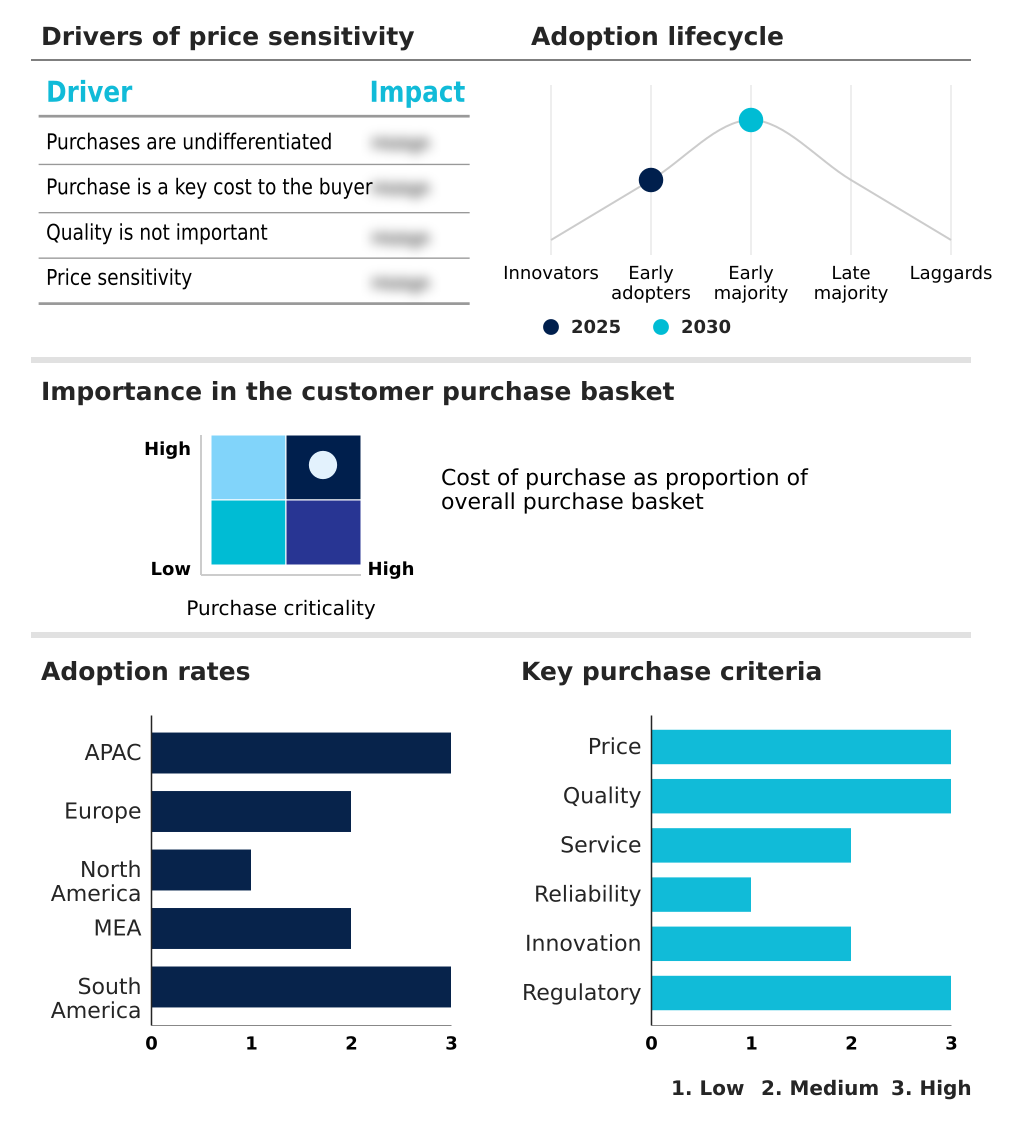
Customer Landscape of Ferro Titanium Industry

Competitive Landscape

Companies are implementing various strategies, such as strategic alliances, ferro titanium market forecast, partnerships, mergers and acquisitions, geographical expansion, and product/service launches, to enhance their presence in the industry.

Advanced Powders and Titanium - The vendor supplies specialized titanium powders engineered for advanced metallurgical applications, delivering precise alloy formulations that optimize structural integrity and enhance refining efficiency across heavy industrial manufacturing operations.

The industry research and growth report includes detailed analyses of the competitive landscape of the market and information about key companies, including:

  • Advanced Powders and Titanium
  • AIM Alloys LLP
  • Bansal Brothers
  • CRONIMET Holding GmbH
  • Essel Mining and Industries Ltd.
  • F.E. Mottram Ltd
  • Galt Alloys Inc.
  • GfE Gesellschaft fur
  • Jayesh Group
  • Kushal Ferro Alloys Ltd
  • Kymera International
  • Luoyang Sunrui Wanji Titanium
  • Metalliage Inc.
  • OSAKA Titanium Technologies
  • SMS Metals Pvt Ltd
  • Toho Titanium Co. Ltd.
  • Vestek Ltd.
  • VSMPO AVISMA Corp.
  • Westbrook Resources Ltd.
  • Zaporizhzhia Titanium

Qualitative and quantitative analysis of companies has been conducted to help clients understand the wider business environment as well as the strengths and weaknesses of key industry players. Data is qualitatively analyzed to categorize companies as pure play, category-focused, industry-focused, and diversified; it is quantitatively analyzed to categorize companies as dominant, leading, strong, tentative, and weak.

Recent Development and News in Ferro titanium market

  • In the Steel industry, the structural transition from blast furnaces to scrap-intensive electric arc furnace infrastructure increases baseline dissolved oxygen levels, directly accelerating Ferro Titanium consumption for rigorous deoxidation protocols.
  • The standardization of aerospace revert material recycling protocols eliminates processing ambiguities and contamination liabilities, ensuring a steady and high-purity scrap feedstock stream for secondary alloy converters.
  • The implementation of stringent automotive lightweighting mandates compels manufacturers to adopt advanced high-strength steels, structurally driving demand for titanium-based grain refiners that maintain critical yield strength.
  • Expanding investments in offshore wind platforms necessitate the production of thick-plate steels exhibiting high fracture toughness, amplifying the utilization of specialized titanium master alloys for superior sulfide shape control.

Dive into Technavio’s robust research methodology, blending expert interviews, extensive data synthesis, and validated models for unparalleled Ferro Titanium Market insights. See full methodology.

Market Scope
Page number 306
Base year 2025
Historic period 2020-2024
Forecast period 2026-2030
Growth momentum & CAGR Accelerate at a CAGR of 4.4%
Market growth 2026-2030 USD 72269.9 thousand
Market structure Fragmented
YoY growth 2025-2026(%) 4.2%
Key countries China, Japan, India, South Korea, Indonesia, Australia, Germany, Italy, France, Spain, UK, The Netherlands, US, Mexico, Canada, Turkey, South Africa, Saudi Arabia, UAE, Israel, Brazil, Argentina and Colombia
Competitive landscape Leading Companies, Market Positioning of Companies, Competitive Strategies, and Industry Risks

Request Free Sample

Research Analyst Overview

  • The continuous evolution of metallurgical additives fundamentally reshapes how heavy industrial manufacturers approach material strength and regulatory compliance. As engineering specifications for deep-water energy platforms and zero-emission transportation networks become more rigorous, boardrooms are strategically reallocating procurement budgets toward ultra-high-purity master alloys.
  • This shift directly influences product strategy, compelling foundries to transition away from standard commodity inputs in favor of traceable, vacuum-processed materials that guarantee structural integrity under extreme stress. By implementing advanced wire injection technologies to deliver these refined alloys, secondary steelmakers have achieved a 25% reduction in costly material oxidation losses compared to legacy bulk feeding methods.
  • This operational optimization ensures precise chemical stabilization, eliminating the risk of catastrophic intergranular failure in critical stainless infrastructure. The systemic transition toward precision micro-alloying enables manufacturers to meet stringent sustainability mandates by producing lighter, high-durability components that lower the total carbon footprint of the transportation sector.
  • Consequently, the strategic integration of these advanced metallurgical solutions serves as an indispensable mechanism for maintaining operational competitiveness and achieving long-term asset reliability across harsh industrial environments.

What are the Key Data Covered in this Ferro Titanium Market Research and Growth Report?

  • What is the expected growth of the Ferro Titanium Market between 2026 and 2030?

    • USD 72.27 million, at a CAGR of 4.4%

  • What segmentation does the market report cover?

    • The report is segmented by Type (Lumps, Granules, and Powder), End-user (Construction, Automotive, Mining and metal processing, Aerospace and defense, and Others), Application (Steelmaking, Foundries, and Others) and Geography (APAC, Europe, North America, Middle East and Africa, South America)

  • Which regions are analyzed in the report?

    • APAC, Europe, North America, Middle East and Africa and South America

  • What are the key growth drivers and market challenges?

    • Rising global utilization of high-strength low-alloy and stainless steels in heavy industries , Extreme volatility in titanium scrap availability and upstream feedstock pricing

  • Who are the major players in the Ferro Titanium Market?

    • Advanced Powders and Titanium, AIM Alloys LLP, Bansal Brothers, CRONIMET Holding GmbH, Essel Mining and Industries Ltd., F.E. Mottram Ltd, Galt Alloys Inc., GfE Gesellschaft fur, Jayesh Group, Kushal Ferro Alloys Ltd, Kymera International, Luoyang Sunrui Wanji Titanium, Metalliage Inc., OSAKA Titanium Technologies, SMS Metals Pvt Ltd, Toho Titanium Co. Ltd., Vestek Ltd., VSMPO AVISMA Corp., Westbrook Resources Ltd. and Zaporizhzhia Titanium

Market Research Insights

  • The Ferro Titanium Market is undergoing a rapid operational transformation driven by precision metallurgical demands and shifting industrial supply chains. Secondary alloy processors increasingly rely on strategic buffering inventories to navigate feedstock volatility, achieving a 20% improvement in supply continuity compared to legacy just-in-time procurement models.
  • The integration of dynamic metallurgical modeling allows automated ladle stations to optimize alloy injection, boosting total material recovery rates by 15% during heavy industrial melting cycles. Furthermore, the rising necessity for national critical mineral stockpiling has prompted sovereign entities to secure domestic material reserves, reducing external supply dependency by up to 30%.
  • These systemic shifts ensure that steelmakers maintain access to the essential ultra clean low gas alloy inputs required for advanced infrastructure development.

We can help! Our analysts can customize this ferro titanium market research report to meet your requirements.

Get in touch

1. Executive Summary

1.1 Market overview

Executive Summary - Chart on Market Overview
Executive Summary - Data Table on Market Overview
Executive Summary - Chart on Global Market Characteristics
Executive Summary - Chart on Market by Geography
Executive Summary - Chart on Market Segmentation by Type
Executive Summary - Chart on Market Segmentation by End-user
Executive Summary - Chart on Market Segmentation by Application
Executive Summary - Chart on Incremental Growth
Executive Summary - Data Table on Incremental Growth
Executive Summary - Chart on Company Market Positioning

2. Technavio Analysis

2.1 Analysis of price sensitivity, lifecycle, customer purchase basket, adoption rates, and purchase criteria

2.2 Criticality of inputs and Factors of differentiation

Chart on Overview on criticality of inputs and factors of differentiation

2.3 Factors of disruption

Chart on Overview on factors of disruption

2.4 Impact of drivers and challenges

Chart on Impact of drivers and challenges in 2025 and 2030

3. Market Landscape

3.1 Market ecosystem

Chart on Parent Market
Data Table on - Parent Market

3.2 Market characteristics

Chart on Market characteristics analysis

3.3 Value chain analysis

Chart on Value chain analysis

4. Market Sizing

4.1 Market definition

Data Table on Offerings of companies included in the market definition

4.2 Market segment analysis

Market segments

4.3 Market size 2025

4.4 Market outlook: Forecast for 2025-2030

Chart on Global - Market size and forecast 2025-2030 ($ thousand)
Data Table on Global - Market size and forecast 2025-2030 ($ thousand)
Chart on Global Market: Year-over-year growth 2025-2030 (%)
Data Table on Global Market: Year-over-year growth 2025-2030 (%)

5. Historic Market Size

5.1 Global Ferro Titanium Market 2020 - 2024

Historic Market Size - Data Table on Global Ferro Titanium Market 2020 - 2024 ($ thousand)

5.2 Type segment analysis 2020 - 2024

Historic Market Size - Type Segment 2020 - 2024 ($ thousand)

5.3 End-user segment analysis 2020 - 2024

Historic Market Size - End-user Segment 2020 - 2024 ($ thousand)

5.4 Application segment analysis 2020 - 2024

Historic Market Size - Application Segment 2020 - 2024 ($ thousand)

5.5 Geography segment analysis 2020 - 2024

Historic Market Size - Geography Segment 2020 - 2024 ($ thousand)

5.6 Country segment analysis 2020 - 2024

Historic Market Size - Country Segment 2020 - 2024 ($ thousand)

6. Qualitative Analysis

6.1 Impact of AI on Global Ferro Titanium Market

6.2 Impact of Geopolitical Conflicts on Global Ferro Titanium Market

7. Five Forces Analysis

7.1 Five forces summary

Five forces analysis - Comparison between 2025 and 2030

7.2 Bargaining power of buyers

Bargaining power of buyers - Impact of key factors 2025 and 2030

7.3 Bargaining power of suppliers

Bargaining power of suppliers - Impact of key factors in 2025 and 2030

7.4 Threat of new entrants

Threat of new entrants - Impact of key factors in 2025 and 2030

7.5 Threat of substitutes

Threat of substitutes - Impact of key factors in 2025 and 2030

7.6 Threat of rivalry

Threat of rivalry - Impact of key factors in 2025 and 2030

7.7 Market condition

Chart on Market condition - Five forces 2025 and 2030

8. Market Segmentation by Type

8.1 Market segments

Chart on Type - Market share 2025-2030 (%)
Data Table on Type - Market share 2025-2030 (%)

8.2 Comparison by Type

Chart on Comparison by Type
Data Table on Comparison by Type

8.3 Lumps - Market size and forecast 2025-2030

Chart on Lumps - Market size and forecast 2025-2030 ($ thousand)
Data Table on Lumps - Market size and forecast 2025-2030 ($ thousand)
Chart on Lumps - Year-over-year growth 2025-2030 (%)
Data Table on Lumps - Year-over-year growth 2025-2030 (%)

8.4 Granules - Market size and forecast 2025-2030

Chart on Granules - Market size and forecast 2025-2030 ($ thousand)
Data Table on Granules - Market size and forecast 2025-2030 ($ thousand)
Chart on Granules - Year-over-year growth 2025-2030 (%)
Data Table on Granules - Year-over-year growth 2025-2030 (%)

8.5 Powder - Market size and forecast 2025-2030

Chart on Powder - Market size and forecast 2025-2030 ($ thousand)
Data Table on Powder - Market size and forecast 2025-2030 ($ thousand)
Chart on Powder - Year-over-year growth 2025-2030 (%)
Data Table on Powder - Year-over-year growth 2025-2030 (%)

8.6 Market opportunity by Type

Market opportunity by Type ($ thousand)
Data Table on Market opportunity by Type ($ thousand)

9. Market Segmentation by End-user

9.1 Market segments

Chart on End-user - Market share 2025-2030 (%)
Data Table on End-user - Market share 2025-2030 (%)

9.2 Comparison by End-user

Chart on Comparison by End-user
Data Table on Comparison by End-user

9.3 Construction - Market size and forecast 2025-2030

Chart on Construction - Market size and forecast 2025-2030 ($ thousand)
Data Table on Construction - Market size and forecast 2025-2030 ($ thousand)
Chart on Construction - Year-over-year growth 2025-2030 (%)
Data Table on Construction - Year-over-year growth 2025-2030 (%)

9.4 Automotive - Market size and forecast 2025-2030

Chart on Automotive - Market size and forecast 2025-2030 ($ thousand)
Data Table on Automotive - Market size and forecast 2025-2030 ($ thousand)
Chart on Automotive - Year-over-year growth 2025-2030 (%)
Data Table on Automotive - Year-over-year growth 2025-2030 (%)

9.5 Mining and metal processing - Market size and forecast 2025-2030

Chart on Mining and metal processing - Market size and forecast 2025-2030 ($ thousand)
Data Table on Mining and metal processing - Market size and forecast 2025-2030 ($ thousand)
Chart on Mining and metal processing - Year-over-year growth 2025-2030 (%)
Data Table on Mining and metal processing - Year-over-year growth 2025-2030 (%)

9.6 Aerospace and defense - Market size and forecast 2025-2030

Chart on Aerospace and defense - Market size and forecast 2025-2030 ($ thousand)
Data Table on Aerospace and defense - Market size and forecast 2025-2030 ($ thousand)
Chart on Aerospace and defense - Year-over-year growth 2025-2030 (%)
Data Table on Aerospace and defense - Year-over-year growth 2025-2030 (%)

9.7 Others - Market size and forecast 2025-2030

Chart on Others - Market size and forecast 2025-2030 ($ thousand)
Data Table on Others - Market size and forecast 2025-2030 ($ thousand)
Chart on Others - Year-over-year growth 2025-2030 (%)
Data Table on Others - Year-over-year growth 2025-2030 (%)

9.8 Market opportunity by End-user

Market opportunity by End-user ($ thousand)
Data Table on Market opportunity by End-user ($ thousand)

10. Market Segmentation by Application

10.1 Market segments

Chart on Application - Market share 2025-2030 (%)
Data Table on Application - Market share 2025-2030 (%)

10.2 Comparison by Application

Chart on Comparison by Application
Data Table on Comparison by Application

10.3 Steelmaking - Market size and forecast 2025-2030

Chart on Steelmaking - Market size and forecast 2025-2030 ($ thousand)
Data Table on Steelmaking - Market size and forecast 2025-2030 ($ thousand)
Chart on Steelmaking - Year-over-year growth 2025-2030 (%)
Data Table on Steelmaking - Year-over-year growth 2025-2030 (%)

10.4 Foundries - Market size and forecast 2025-2030

Chart on Foundries - Market size and forecast 2025-2030 ($ thousand)
Data Table on Foundries - Market size and forecast 2025-2030 ($ thousand)
Chart on Foundries - Year-over-year growth 2025-2030 (%)
Data Table on Foundries - Year-over-year growth 2025-2030 (%)

10.5 Others - Market size and forecast 2025-2030

Chart on Others - Market size and forecast 2025-2030 ($ thousand)
Data Table on Others - Market size and forecast 2025-2030 ($ thousand)
Chart on Others - Year-over-year growth 2025-2030 (%)
Data Table on Others - Year-over-year growth 2025-2030 (%)

10.6 Market opportunity by Application

Market opportunity by Application ($ thousand)
Data Table on Market opportunity by Application ($ thousand)

11. Customer Landscape

11.1 Customer landscape overview

Analysis of price sensitivity, lifecycle, customer purchase basket, adoption rates, and purchase criteria

12. Geographic Landscape

12.1 Geographic segmentation

Chart on Market share by geography 2025-2030 (%)
Data Table on Market share by geography 2025-2030 (%)

12.2 Geographic comparison

Chart on Geographic comparison
Data Table on Geographic comparison

12.3 APAC - Market size and forecast 2025-2030

Chart on APAC - Market size and forecast 2025-2030 ($ thousand)
Data Table on APAC - Market size and forecast 2025-2030 ($ thousand)
Chart on APAC - Year-over-year growth 2025-2030 (%)
Data Table on APAC - Year-over-year growth 2025-2030 (%)
Chart on Regional Comparison - APAC
Data Table on Regional Comparison - APAC

12.3.1 China - Market size and forecast 2025-2030

Chart on China - Market size and forecast 2025-2030 ($ thousand)
Data Table on China - Market size and forecast 2025-2030 ($ thousand)
Chart on China - Year-over-year growth 2025-2030 (%)
Data Table on China - Year-over-year growth 2025-2030 (%)

12.3.2 Japan - Market size and forecast 2025-2030

Chart on Japan - Market size and forecast 2025-2030 ($ thousand)
Data Table on Japan - Market size and forecast 2025-2030 ($ thousand)
Chart on Japan - Year-over-year growth 2025-2030 (%)
Data Table on Japan - Year-over-year growth 2025-2030 (%)

12.3.3 India - Market size and forecast 2025-2030

Chart on India - Market size and forecast 2025-2030 ($ thousand)
Data Table on India - Market size and forecast 2025-2030 ($ thousand)
Chart on India - Year-over-year growth 2025-2030 (%)
Data Table on India - Year-over-year growth 2025-2030 (%)

12.3.4 South Korea - Market size and forecast 2025-2030

Chart on South Korea - Market size and forecast 2025-2030 ($ thousand)
Data Table on South Korea - Market size and forecast 2025-2030 ($ thousand)
Chart on South Korea - Year-over-year growth 2025-2030 (%)
Data Table on South Korea - Year-over-year growth 2025-2030 (%)

12.3.5 Indonesia - Market size and forecast 2025-2030

Chart on Indonesia - Market size and forecast 2025-2030 ($ thousand)
Data Table on Indonesia - Market size and forecast 2025-2030 ($ thousand)
Chart on Indonesia - Year-over-year growth 2025-2030 (%)
Data Table on Indonesia - Year-over-year growth 2025-2030 (%)

12.3.6 Australia - Market size and forecast 2025-2030

Chart on Australia - Market size and forecast 2025-2030 ($ thousand)
Data Table on Australia - Market size and forecast 2025-2030 ($ thousand)
Chart on Australia - Year-over-year growth 2025-2030 (%)
Data Table on Australia - Year-over-year growth 2025-2030 (%)

12.4 Europe - Market size and forecast 2025-2030

Chart on Europe - Market size and forecast 2025-2030 ($ thousand)
Data Table on Europe - Market size and forecast 2025-2030 ($ thousand)
Chart on Europe - Year-over-year growth 2025-2030 (%)
Data Table on Europe - Year-over-year growth 2025-2030 (%)
Chart on Regional Comparison - Europe
Data Table on Regional Comparison - Europe

12.4.1 Germany - Market size and forecast 2025-2030

Chart on Germany - Market size and forecast 2025-2030 ($ thousand)
Data Table on Germany - Market size and forecast 2025-2030 ($ thousand)
Chart on Germany - Year-over-year growth 2025-2030 (%)
Data Table on Germany - Year-over-year growth 2025-2030 (%)

12.4.2 Italy - Market size and forecast 2025-2030

Chart on Italy - Market size and forecast 2025-2030 ($ thousand)
Data Table on Italy - Market size and forecast 2025-2030 ($ thousand)
Chart on Italy - Year-over-year growth 2025-2030 (%)
Data Table on Italy - Year-over-year growth 2025-2030 (%)

12.4.3 France - Market size and forecast 2025-2030

Chart on France - Market size and forecast 2025-2030 ($ thousand)
Data Table on France - Market size and forecast 2025-2030 ($ thousand)
Chart on France - Year-over-year growth 2025-2030 (%)
Data Table on France - Year-over-year growth 2025-2030 (%)

12.4.4 Spain - Market size and forecast 2025-2030

Chart on Spain - Market size and forecast 2025-2030 ($ thousand)
Data Table on Spain - Market size and forecast 2025-2030 ($ thousand)
Chart on Spain - Year-over-year growth 2025-2030 (%)
Data Table on Spain - Year-over-year growth 2025-2030 (%)

12.4.5 UK - Market size and forecast 2025-2030

Chart on UK - Market size and forecast 2025-2030 ($ thousand)
Data Table on UK - Market size and forecast 2025-2030 ($ thousand)
Chart on UK - Year-over-year growth 2025-2030 (%)
Data Table on UK - Year-over-year growth 2025-2030 (%)

12.4.6 The Netherlands - Market size and forecast 2025-2030

Chart on The Netherlands - Market size and forecast 2025-2030 ($ thousand)
Data Table on The Netherlands - Market size and forecast 2025-2030 ($ thousand)
Chart on The Netherlands - Year-over-year growth 2025-2030 (%)
Data Table on The Netherlands - Year-over-year growth 2025-2030 (%)

12.5 North America - Market size and forecast 2025-2030

Chart on North America - Market size and forecast 2025-2030 ($ thousand)
Data Table on North America - Market size and forecast 2025-2030 ($ thousand)
Chart on North America - Year-over-year growth 2025-2030 (%)
Data Table on North America - Year-over-year growth 2025-2030 (%)
Chart on Regional Comparison - North America
Data Table on Regional Comparison - North America

12.5.1 US - Market size and forecast 2025-2030

Chart on US - Market size and forecast 2025-2030 ($ thousand)
Data Table on US - Market size and forecast 2025-2030 ($ thousand)
Chart on US - Year-over-year growth 2025-2030 (%)
Data Table on US - Year-over-year growth 2025-2030 (%)

12.5.2 Mexico - Market size and forecast 2025-2030

Chart on Mexico - Market size and forecast 2025-2030 ($ thousand)
Data Table on Mexico - Market size and forecast 2025-2030 ($ thousand)
Chart on Mexico - Year-over-year growth 2025-2030 (%)
Data Table on Mexico - Year-over-year growth 2025-2030 (%)

12.5.3 Canada - Market size and forecast 2025-2030

Chart on Canada - Market size and forecast 2025-2030 ($ thousand)
Data Table on Canada - Market size and forecast 2025-2030 ($ thousand)
Chart on Canada - Year-over-year growth 2025-2030 (%)
Data Table on Canada - Year-over-year growth 2025-2030 (%)

12.6 Middle East and Africa - Market size and forecast 2025-2030

Chart on Middle East and Africa - Market size and forecast 2025-2030 ($ thousand)
Data Table on Middle East and Africa - Market size and forecast 2025-2030 ($ thousand)
Chart on Middle East and Africa - Year-over-year growth 2025-2030 (%)
Data Table on Middle East and Africa - Year-over-year growth 2025-2030 (%)
Chart on Regional Comparison - Middle East and Africa
Data Table on Regional Comparison - Middle East and Africa

12.6.1 Turkey - Market size and forecast 2025-2030

Chart on Turkey - Market size and forecast 2025-2030 ($ thousand)
Data Table on Turkey - Market size and forecast 2025-2030 ($ thousand)
Chart on Turkey - Year-over-year growth 2025-2030 (%)
Data Table on Turkey - Year-over-year growth 2025-2030 (%)

12.6.2 South Africa - Market size and forecast 2025-2030

Chart on South Africa - Market size and forecast 2025-2030 ($ thousand)
Data Table on South Africa - Market size and forecast 2025-2030 ($ thousand)
Chart on South Africa - Year-over-year growth 2025-2030 (%)
Data Table on South Africa - Year-over-year growth 2025-2030 (%)

12.6.3 Saudi Arabia - Market size and forecast 2025-2030

Chart on Saudi Arabia - Market size and forecast 2025-2030 ($ thousand)
Data Table on Saudi Arabia - Market size and forecast 2025-2030 ($ thousand)
Chart on Saudi Arabia - Year-over-year growth 2025-2030 (%)
Data Table on Saudi Arabia - Year-over-year growth 2025-2030 (%)

12.6.4 UAE - Market size and forecast 2025-2030

Chart on UAE - Market size and forecast 2025-2030 ($ thousand)
Data Table on UAE - Market size and forecast 2025-2030 ($ thousand)
Chart on UAE - Year-over-year growth 2025-2030 (%)
Data Table on UAE - Year-over-year growth 2025-2030 (%)

12.6.5 Israel - Market size and forecast 2025-2030

Chart on Israel - Market size and forecast 2025-2030 ($ thousand)
Data Table on Israel - Market size and forecast 2025-2030 ($ thousand)
Chart on Israel - Year-over-year growth 2025-2030 (%)
Data Table on Israel - Year-over-year growth 2025-2030 (%)

12.7 South America - Market size and forecast 2025-2030

Chart on South America - Market size and forecast 2025-2030 ($ thousand)
Data Table on South America - Market size and forecast 2025-2030 ($ thousand)
Chart on South America - Year-over-year growth 2025-2030 (%)
Data Table on South America - Year-over-year growth 2025-2030 (%)
Chart on Regional Comparison - South America
Data Table on Regional Comparison - South America

12.7.1 Brazil - Market size and forecast 2025-2030

Chart on Brazil - Market size and forecast 2025-2030 ($ thousand)
Data Table on Brazil - Market size and forecast 2025-2030 ($ thousand)
Chart on Brazil - Year-over-year growth 2025-2030 (%)
Data Table on Brazil - Year-over-year growth 2025-2030 (%)

12.7.2 Argentina - Market size and forecast 2025-2030

Chart on Argentina - Market size and forecast 2025-2030 ($ thousand)
Data Table on Argentina - Market size and forecast 2025-2030 ($ thousand)
Chart on Argentina - Year-over-year growth 2025-2030 (%)
Data Table on Argentina - Year-over-year growth 2025-2030 (%)

12.7.3 Colombia - Market size and forecast 2025-2030

Chart on Colombia - Market size and forecast 2025-2030 ($ thousand)
Data Table on Colombia - Market size and forecast 2025-2030 ($ thousand)
Chart on Colombia - Year-over-year growth 2025-2030 (%)
Data Table on Colombia - Year-over-year growth 2025-2030 (%)

12.8 Market opportunity by geography

Market opportunity by geography ($ thousand)
Data Tables on Market opportunity by geography ($ thousand)

13. Drivers, Challenges, and Opportunity

13.1 Market drivers

Rising global utilization of high-strength low-alloy and stainless steels in heavy industries
Aerospace fleet expansion and institutional standardization of titanium revert streams
Adoption of electric arc furnace technology and green secondary metallurgy

13.2 Market challenges

Extreme volatility in titanium scrap availability and upstream feedstock pricing
Surging industrial electricity costs and elevated thermal processing expenses
Trade protectionism, regulatory divergence, and supply chain fragmentation

13.3 Impact of drivers and challenges

Impact of drivers and challenges in 2025 and 2030

13.4 Market opportunities

Technological transition toward cored wire delivery systems
Strategic supply security initiatives and national critical mineral stockpiling
Rising specifications for ultra-clean low-gas ferro titanium

14. Competitive Landscape

14.1 Overview

14.2

Overview on criticality of inputs and factors of differentiation

14.3 Landscape disruption

Overview on factors of disruption

14.4 Industry risks

Impact of key risks on business

15. Competitive Analysis

15.1 Companies profiled

Companies covered

15.2 Company ranking index

15.3 Market positioning of companies

Matrix on companies position and classification

15.4 Advanced Powders and Titanium

Advanced Powders and Titanium - Overview
Advanced Powders and Titanium - Product / Service
Advanced Powders and Titanium - Key offerings
SWOT

15.5 AIM Alloys LLP

AIM Alloys LLP - Overview
AIM Alloys LLP - Product / Service
AIM Alloys LLP - Key offerings
SWOT

15.6 Bansal Brothers

Bansal Brothers - Overview
Bansal Brothers - Product / Service
Bansal Brothers - Key offerings
SWOT

15.7 CRONIMET Holding GmbH

CRONIMET Holding GmbH - Overview
CRONIMET Holding GmbH - Product / Service
CRONIMET Holding GmbH - Key offerings
SWOT

15.8 F.E. Mottram Ltd

F.E. Mottram Ltd - Overview
F.E. Mottram Ltd - Product / Service
F.E. Mottram Ltd - Key offerings
SWOT

15.9 Galt Alloys Inc.

Galt Alloys Inc. - Overview
Galt Alloys Inc. - Product / Service
Galt Alloys Inc. - Key offerings
SWOT

15.10 GfE Gesellschaft fur

GfE Gesellschaft fur - Overview
GfE Gesellschaft fur - Product / Service
GfE Gesellschaft fur - Key offerings
SWOT

15.11 Jayesh Group

Jayesh Group - Overview
Jayesh Group - Product / Service
Jayesh Group - Key offerings
SWOT

15.12 Kushal Ferro Alloys Ltd

Kushal Ferro Alloys Ltd - Overview
Kushal Ferro Alloys Ltd - Product / Service
Kushal Ferro Alloys Ltd - Key offerings
SWOT

15.13 Kymera International

Kymera International - Overview
Kymera International - Product / Service
Kymera International - Key offerings
SWOT

15.14 Metalliage Inc.

Metalliage Inc. - Overview
Metalliage Inc. - Product / Service
Metalliage Inc. - Key offerings
SWOT

15.15 SMS Metals Pvt Ltd

SMS Metals Pvt Ltd - Overview
SMS Metals Pvt Ltd - Product / Service
SMS Metals Pvt Ltd - Key offerings
SWOT

15.16 Toho Titanium Co. Ltd.

Toho Titanium Co. Ltd. - Overview
Toho Titanium Co. Ltd. - Product / Service
Toho Titanium Co. Ltd. - Key offerings
SWOT

15.17 VSMPO AVISMA Corp.

VSMPO AVISMA Corp. - Overview
VSMPO AVISMA Corp. - Product / Service
VSMPO AVISMA Corp. - Key offerings
SWOT

15.18 Westbrook Resources Ltd.

Westbrook Resources Ltd. - Overview
Westbrook Resources Ltd. - Product / Service
Westbrook Resources Ltd. - Key offerings
SWOT

16. Appendix

16.1 Scope of the report

Market definition
Objectives
Notes and caveats

16.2 Inclusions and exclusions checklist

Inclusions checklist
Exclusions checklist

16.3 Currency conversion rates for US$

16.4 Research methodology

16.5 Data procurement

Information sources

16.6 Data validation

16.7 Validation techniques employed for market sizing

16.8 Data synthesis

16.9 360 degree market analysis

16.10 List of abbreviations

Research Methodology

Technavio presents a detailed picture of the market by way of study, synthesis, and summation of data from multiple sources. The analysts have presented the various facets of the market with a particular focus on identifying the key industry influencers. The data thus presented is comprehensive, reliable, and the result of extensive research, both primary and secondary.

INFORMATION SOURCES

Primary sources

  • Manufacturers and suppliers
  • Channel partners
  • Industry experts
  • Strategic decision makers

Secondary sources

  • Industry journals and periodicals
  • Government data
  • Financial reports of key industry players
  • Historical data
  • Press releases

DATA ANALYSIS

Data Synthesis

  • Collation of data
  • Estimation of key figures
  • Analysis of derived insights

Data Validation

  • Triangulation with data models
  • Reference against proprietary databases
  • Corroboration with industry experts

REPORT WRITING

Qualitative

  • Market drivers
  • Market challenges
  • Market trends
  • Five forces analysis

Quantitative

  • Market size and forecast
  • Market segmentation
  • Geographical insights
  • Competitive landscape

Interested in this report?

Get your sample now to see our research methodology and insights!

Download Now

Frequently Asked Questions

Ferro Titanium market growth will increase by USD 72269.9 thousand thousand during 2026-2030.

The Ferro Titanium market is expected to grow at a CAGR of 4.4% during 2026-2030.

Ferro Titanium market is segmented by Type (Lumps, Granules, Powder) End-user (Construction, Automotive, Mining and metal processing, Aerospace and defense, Others) Application (Steelmaking, Foundries, Others)

Advanced Powders and Titanium, AIM Alloys LLP, Bansal Brothers, CRONIMET Holding GmbH, Essel Mining and Industries Ltd., F.E. Mottram Ltd, Galt Alloys Inc., GfE Gesellschaft fur, Jayesh Group, Kushal Ferro Alloys Ltd, Kymera International, Luoyang Sunrui Wanji Titanium, Metalliage Inc., OSAKA Titanium Technologies, SMS Metals Pvt Ltd, Toho Titanium Co. Ltd., Vestek Ltd., VSMPO AVISMA Corp., Westbrook Resources Ltd., Zaporizhzhia Titanium are a few of the key vendors in the Ferro Titanium market.

APAC will register the highest growth rate of 58% among the other regions. Therefore, the Ferro Titanium market in APAC is expected to garner significant business opportunities for the vendors during the forecast period.

China, Japan, India, South Korea, Indonesia, Australia, Germany, Italy, France, Spain, UK, The Netherlands, US, Mexico, Canada, Turkey, South Africa, Saudi Arabia, UAE, Israel, Brazil, Argentina, Colombia

  • Rising global utilization of high-strength low-alloy and stainless steels in heavy industries is the driving factor this market.

The Ferro Titanium market vendors should focus on grabbing business opportunities from the Type segment as it accounted for the largest market share in the base year.
RIA - Research AI Assistant
Ask RIA
