
Fintech And Embedded Banking In E-Commerce Market Size and Growth Forecast 2026-2030
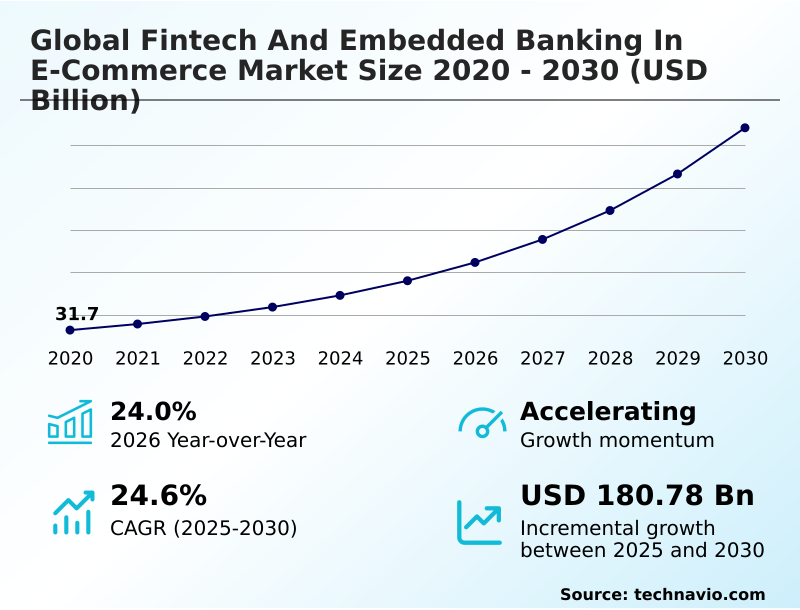
The Fintech And Embedded Banking In E-Commerce Market size was valued at USD 90.02 billion in 2025 growing at a CAGR of 24.6% during the forecast period 2026-2030.
APAC accounts for 38.7% of incremental growth during the forecast period. The Payments and processing segment by Service Type was valued at USD 38.44 billion in 2024, while the B2C platforms segment holds the largest revenue share by Platform.
The market is projected to grow by USD 239.09 billion from 2020 to 2030, with USD 180.78 billion of the growth expected during the forecast period of 2025 to 2030.
Get Key Insights on Market Forecast (PDF) Request Free Sample
Fintech And Embedded Banking In E-Commerce Market Overview
The fintech and embedded banking in e-commerce market is defined by a fundamental shift where financial services are integrated directly into retail platforms, with the market showing a 24.0% year-over-year growth. This expansion is driven by consumer demand for a seamless financial journey and the technical maturity of API-driven banking infrastructure. Utilizing open banking protocols and modular API integration, platforms can offer a frictionless checkout experience, reducing cart abandonment. A core trend is the use of generative AI financial products for hyper-personalized financial offers. For instance, a B2B marketplace platform offering supply chain finance tools can leverage a banking-as-a-service (BaaS) platform to provide instant working capital, improving merchant liquidity by over 30%. However, navigating multi-jurisdictional tax compliance and KYC protocols remains a significant hurdle. This dynamic is most evident in the APAC region, which accounts for nearly 39% of the market's incremental growth, underscoring the importance of digital identity verification and secure financial data sharing in high-growth territories.
Drivers, Trends, and Challenges in the Fintech And Embedded Banking In E-Commerce Market
The trajectory of the global fintech and embedded banking in e-commerce market 2026-2030 is increasingly defined by specialization. The market for B2B platforms is distinct from consumer-facing applications, focusing on robust supply chain financing.
The impact of open banking on the global fintech and embedded banking in e-commerce market 2026-2030, particularly under frameworks like the EU's PSD2, has been profound, creating fertile ground for generative AI applications in the global fintech and embedded banking in e-commerce market 2026-2030 to deliver hyper-personalized credit.
The role of BaaS in the global fintech and embedded banking in e-commerce market 2026-2030 is foundational, providing the API-driven infrastructure in the global fintech and embedded banking in e-commerce market 2026-2030 that enables these integrations.
For example, in the global fintech and embedded banking in e-commerce market 2026-2030 for travel and hospitality, embedded insurance growth in the global fintech and embedded banking in e-commerce market 2026-2030 has led to parametric policies that pay out automatically, a significant improvement over traditional claims.
This contrasts with the global fintech and embedded banking in e-commerce market 2026-2030 in the electronics consumer goods sector, where BNPL trends within the global fintech and embedded banking in e-commerce market 2026-2030 are dominant.
Embedded lending solutions for the global fintech and embedded banking in e-commerce market 2026-2030 are also evolving, with merchant financing options in the global fintech and embedded banking in e-commerce market 2026-2030 now using real-time sales data for underwriting. Marketplace platform strategies for the global fintech and embedded banking in e-commerce market 2026-2030 involve managing complex payouts and dispute resolution.
The future of account-to-account payments in the global fintech and embedded banking in e-commerce market 2026-2030 points toward bypassing card rails, reducing merchant fees by over 50% in some corridors.
This is supported by the evolution of digital wallets in the global fintech and embedded banking in e-commerce market 2026-2030 and cross-border transaction solutions in the global fintech and embedded banking in e-commerce market 2026-2030.
However, regulatory challenges in the global fintech and embedded banking in e-commerce market 2026-2030, including compliance and fragmentation in the global fintech and embedded banking in e-commerce market 2026-2030 and cybersecurity risks for the global fintech and embedded banking in e-commerce market 2026-2030, remain critical concerns for operators in sectors from the global fintech and embedded banking in e-commerce market 2026-2030 in retail and fashion to the global fintech and embedded banking in e-commerce market 2026-2030 in the food and grocery industry.
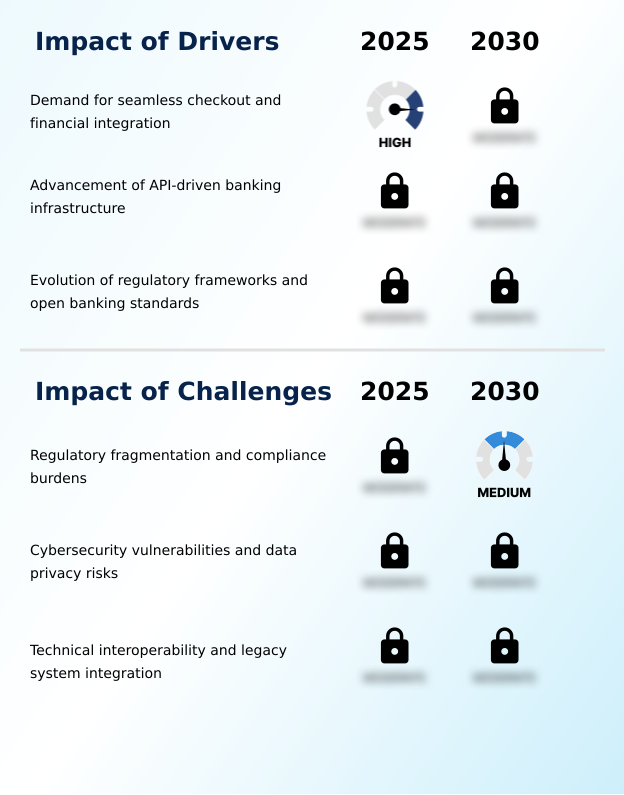
Primary Growth Driver: The demand for seamless checkout experiences and integrated financial services is a primary driver of market growth.
Market expansion, proceeding at a 24.6% compound annual growth rate, is primarily driven by escalating consumer demand for a frictionless checkout experience.
This is enabled by the maturation of API-driven banking infrastructure and BaaS platforms, which democratize access to financial tools. These technologies allow non-financial companies to offer sophisticated products like interest-bearing commercial accounts and automated tax withholding via modular API integration.
The ongoing evolution of open banking regulations, such as the EU's PSD2, provides the legal clarity for secure financial data sharing, allowing for more accurate credit scoring and personalized product recommendations.
This regulatory support is crucial for the expansion of embedded lending and cross-border payment settlement, ensuring consumer rights are protected while fostering innovation in the digital-first economy.
Emerging Market Trend: The advancement of generative AI for providing hyper-personalized financial products is a defining market trend. This is reshaping how financial services are integrated and delivered within digital retail environments.
Key market trends center on creating more intelligent and unified financial experiences. The advancement of generative AI financial products is enabling hyper-personalized repayment schedules and dynamic credit limit adjustments, moving beyond static offers. Concurrently, the shift to unified commerce platforms is accelerating the adoption of account-to-account payment rails, which bypass traditional card networks to lower transaction fees for merchants.
This is complemented by the rapid expansion of embedded insurance solutions, particularly for high-value goods and travel. The buy now pay later segment, for example, is experiencing growth of nearly 30% year-over-year, driven by real-time credit assessment technologies.
These innovations, supported by open banking protocols, are transforming e-commerce sites into comprehensive financial service hubs, with a focus on delivering value-added financial components directly at the point of need.
Key Industry Challenge: Regulatory fragmentation and the associated compliance burdens present a key challenge affecting industry growth.
A primary market challenge is the significant regulatory fragmentation across jurisdictions, which complicates multi-jurisdictional tax compliance and adherence to varied KYC protocols. This lack of harmonization increases operational costs and slows innovation. A second critical issue is cybersecurity, where reliance on APIs creates vulnerabilities that demand a zero-trust security architecture to prevent data breaches.
Finally, technical interoperability remains a hurdle, as integrating modern fintech applications with legacy banking systems often leads to latency issues and technical debt. These challenges are particularly acute in regions like South America, which exhibits a slightly slower growth rate of 23.6% compared to other regions.
Overcoming these barriers requires investment in flexible compliance engines and modular and agnostic systems that can navigate a complex technical and legal landscape.
Explore Full Market Dynamics Analysis Request Free Sample
Fintech And Embedded Banking In E-Commerce Market Segmentation
The fintech and embedded banking in e-commerce industry research report provides comprehensive data including region-wise segment analysis, with forecasts and analysis for the period 2026-2030, as well as historical data from 2020-2024 for the following segments.
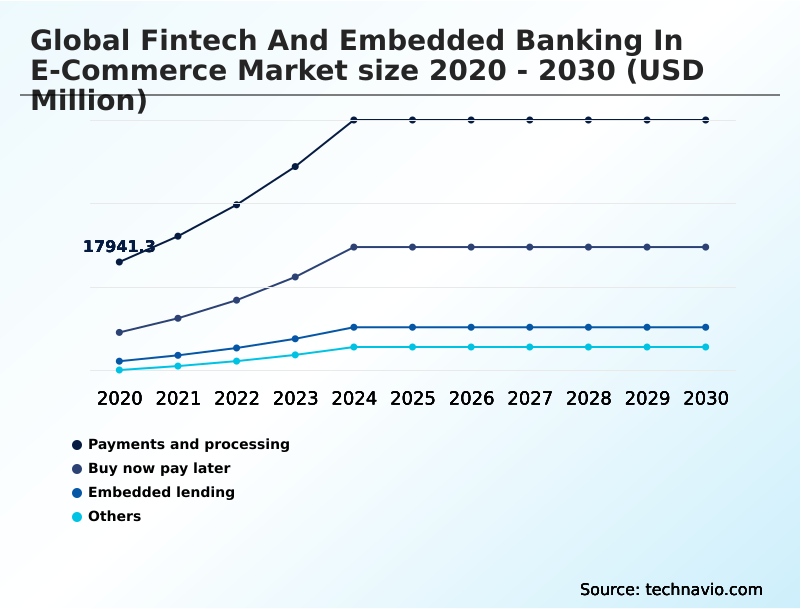
Service Type Segment Analysis
The payments and processing segment is estimated to witness significant growth during the forecast period.
The payments and processing segment constitutes the core infrastructure, representing over 51% of the market. This domain enables the secure and efficient transfer of funds using advanced encryption and payment tokenization services to protect financial data integrity.
The shift toward headless commerce financial integration necessitates modular payment gateways that align with diverse front-end systems. Evolution is driven by cloud-native financial infrastructure, which supports rapid scaling and deployment of new features like real-time fraud detection without disrupting operations.
Key developments include programmable settlement engines and adherence to ISO 20022 messaging standards for granular, actionable data. Strategic focus is on API-driven banking infrastructure and multi-jurisdictional tax compliance, ensuring a unified back-end management system across varied regulatory environments.
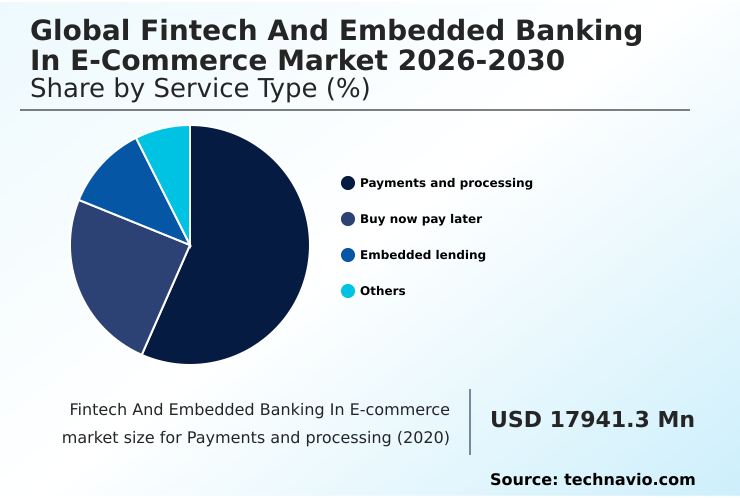
The Payments and processing segment was valued at USD 38.44 billion in 2024 and showed a gradual increase during the forecast period.
Fintech And Embedded Banking In E-Commerce Market by Region: APAC Leads with 38.7% Growth Share
APAC is estimated to contribute 38.7% to the growth of the global market during the forecast period.
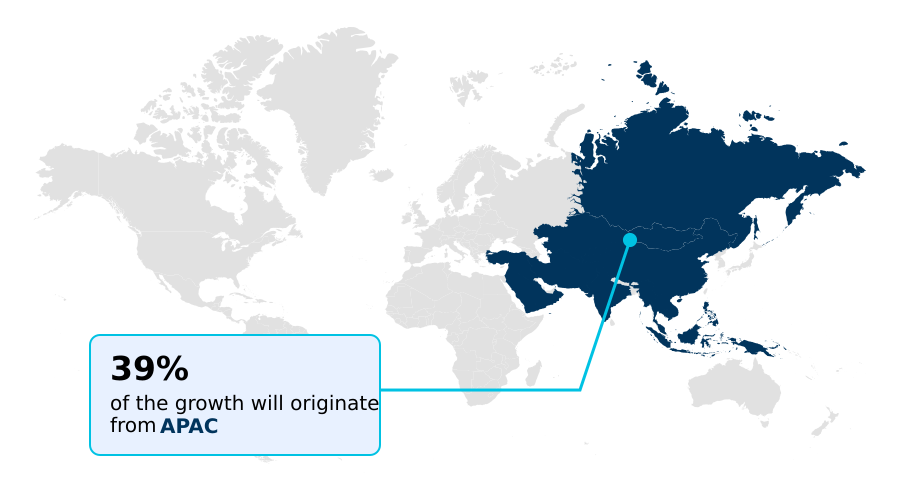
The geographic landscape is led by APAC, contributing nearly 39% of incremental growth and expanding at a CAGR of 25.1%, driven by the adoption of multi-currency digital wallets and unified commerce platforms.
Countries like China and India are at the forefront, leveraging open banking protocols for real-time transactions.
North America, with a 24.8% CAGR, remains a critical market, where the focus is on sophisticated BaaS platforms and API-driven banking infrastructure to support complex B2B and marketplace operations. In this region, the US market is the largest contributor.
The evolution of regulatory frameworks, such as the Personal Financial Data Rights rule in the United States, underpins the expansion of secure financial data sharing and personalized repayment schedules, solidifying the trend toward a digital-first economy globally.
Customer Landscape Analysis for the Fintech And Embedded Banking In E-Commerce Market
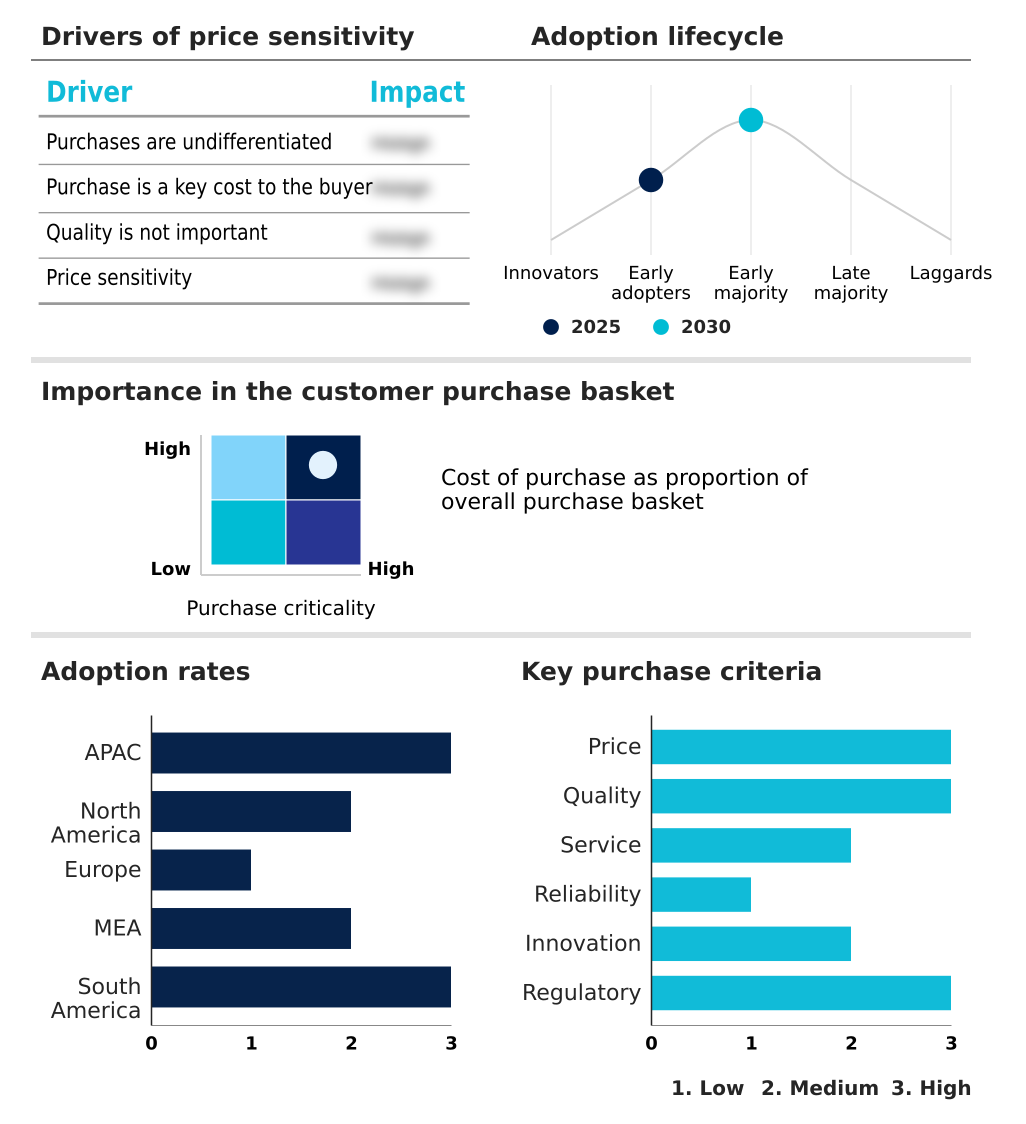
The fintech and embedded banking in e-commerce market forecasting report includes the adoption lifecycle of the market, covering from the innovator’s stage to the laggard’s stage. It focuses on adoption rates in different regions based on penetration. Furthermore, the fintech and embedded banking in e-commerce market report also includes key purchase criteria and drivers of price sensitivity to help companies evaluate and develop their market growth analysis strategies.
Competitive Landscape of the Fintech And Embedded Banking In E-Commerce Market
Companies are implementing various strategies, such as strategic alliances, partnerships, mergers and acquisitions, geographical expansion, and product/service launches, to enhance their presence in the fintech and embedded banking in e-commerce market industry.
Adyen NV - This entity provides a unified global payment platform integrating gateway, risk management, and acquiring services, delivering embedded financial solutions for merchants to streamline e-commerce operations.
The industry research and growth report includes detailed analyses of the competitive landscape of the market and information about key companies, including:
- Adyen NV
- Affirm Holdings Inc.
- Afterpay US Services LLC.
- Alviere
- Checkout Ltd.
- Cross River Bank
- Dwolla Inc.
- Embedded Finance Ltd.
- Finix Payments Inc.
- Galileo Financial Technologies
- Green Dot Corp.
- Klarna Bank AB
- Marqeta Inc.
- Nium Pte. Ltd.
- PayPal Holdings Inc.
- Plaid Inc.
- Stripe Inc.
- Synctera
- Treasury Prime Inc.
- Unit Finance Inc.
Qualitative and quantitative analysis of companies has been conducted to help clients understand the wider business environment as well as the strengths and weaknesses of key industry players. Data is qualitatively analyzed to categorize companies as pure play, category-focused, industry-focused, and diversified; it is quantitatively analyzed to categorize companies as dominant, leading, strong, tentative, and weak.
Recent Developments in the Fintech And Embedded Banking In E-Commerce Market
- In May 2025, the United Kingdom Financial Conduct Authority implemented a new enforcement framework holding e-commerce platforms liable for the transparency of embedded credit offers presented at the point of sale.
- In April 2025, Klarna introduced a generative AI assistant that uses real-time liquidity analysis to offer dynamic credit limits and personalized repayment schedules across its merchant network.
- In February 2025, Target Corporation expanded its Circle 360 program by integrating a savings-to-spend module, allowing users to earn interest on funds within the retailer's digital wallet.
- In May 2025, the European Commission finalized the Payment Services Regulation framework, standardizing technical requirements for dedicated interfaces used by embedded finance providers across Europe.
Research Analyst Overview: Fintech And Embedded Banking In E-Commerce Market
The fintech and embedded banking in e-commerce market is maturing from a value-added feature to a core operational necessity. The payments and processing segment alone commands over half the market, indicating that foundational payment gateway integration is now table stakes.
Boardroom decisions are increasingly focused on the total cost of ownership for compliance, weighing investments in robust anti-money laundering compliance and KYC protocols against the speed of international expansion. This is critical as frameworks like GDPR dictate stringent rules for secure financial data sharing.
The adoption of API-driven banking infrastructure and BaaS platforms allows for modular API integration, but also introduces complexities in managing technical debt. For instance, deploying a private blockchain trade settlement system can secure B2B transactions but requires significant upfront capital and specialized talent.
The strategic imperative is shifting toward building a resilient, zero-trust security architecture that can support a frictionless checkout experience without exposing the enterprise to escalating cyber threats.
Dive into Technavio’s robust research methodology, blending expert interviews, extensive data synthesis, and validated models for unparalleled Fintech And Embedded Banking In E-Commerce Market insights. See full methodology.
| Market Scope | |
|---|---|
| Page number | 309 |
| Base year | 2025 |
| Historic period | 2020-2024 |
| Forecast period | 2026-2030 |
| Growth momentum & CAGR | Accelerate at a CAGR of 24.6% |
| Market growth 2026-2030 | USD 180776.0 million |
| Market structure | Fragmented |
| YoY growth 2025-2026(%) | 24.0% |
| Key countries | China, India, South Korea, Japan, Australia, Indonesia, US, Canada, Mexico, UK, Germany, France, Italy, The Netherlands, Spain, UAE, Saudi Arabia, South Africa, Israel, Turkey, Brazil, Argentina and Chile |
| Competitive landscape | Leading Companies, Market Positioning of Companies, Competitive Strategies, and Industry Risks |
Fintech And Embedded Banking In E-Commerce Market: Key Questions Answered in This Report
-
What is the expected growth of the Fintech And Embedded Banking In E-Commerce Market between 2026 and 2030?
-
The Fintech And Embedded Banking In E-Commerce Market is expected to grow by USD 180.78 billion during 2026-2030, registering a CAGR of 24.6%. Year-over-year growth in 2026 is estimated at 24.0%%. This acceleration is shaped by demand for seamless checkout and financial integration, which is intensifying demand across multiple end-use verticals covered in the report.
-
-
What segmentation does the market report cover?
-
The report is segmented by Service Type (Payments and processing, Buy now pay later, Embedded lending, and Others), Platform (B2C platforms, B2B platforms, and Marketplace platforms), End-user (Retail and fashion, Electronics consumer goods, Travel and hospitality, Food and grocery, and Others) and Geography (APAC, North America, Europe, Middle East and Africa, South America). Among these, the Payments and processing segment is estimated to witness significant growth during the forecast period, driven by rising adoption across key application areas. Each segment includes detailed qualitative and quantitative analysis, along with historical data from 2020-2024 and forecasts through 2030 with year-over-year growth rates.
-
-
Which regions are analyzed in the report?
-
The report covers APAC, North America, Europe, Middle East and Africa and South America. APAC is estimated to contribute 38.7% to market growth during the forecast period. Country-level analysis includes China, India, South Korea, Japan, Australia, Indonesia, US, Canada, Mexico, UK, Germany, France, Italy, The Netherlands, Spain, UAE, Saudi Arabia, South Africa, Israel, Turkey, Brazil, Argentina and Chile, with dedicated market size tables and year-over-year growth for each.
-
-
What are the key growth drivers and market challenges?
-
The primary driver is demand for seamless checkout and financial integration, which is accelerating investment and industry demand. The main challenge is regulatory fragmentation and compliance burdens, creating operational barriers for key market participants. The report quantifies the impact of each driver and challenge across 2026 and 2030 with comparative analysis.
-
-
Who are the major players in the Fintech And Embedded Banking In E-Commerce Market?
-
Key vendors include Adyen NV, Affirm Holdings Inc., Afterpay US Services LLC., Alviere, Checkout Ltd., Cross River Bank, Dwolla Inc., Embedded Finance Ltd., Finix Payments Inc., Galileo Financial Technologies, Green Dot Corp., Klarna Bank AB, Marqeta Inc., Nium Pte. Ltd., PayPal Holdings Inc., Plaid Inc., Stripe Inc., Synctera, Treasury Prime Inc. and Unit Finance Inc.. The report provides qualitative and quantitative analysis categorizing companies as dominant, leading, strong, tentative, and weak based on their market positioning. Company profiles include business segment analysis, SWOT assessment, key offerings, and recent strategic developments.
-
Fintech And Embedded Banking In E-Commerce Market Research Insights
Market dynamics are shaped by the strategic imperative for a seamless financial journey, with B2C platforms contributing more than double the revenue of B2B platforms. This integration relies on consumer data portability, governed by frameworks like the Personal Financial Data Rights rule, to enable hyper-personalized financial offers.
The objective is cart abandonment reduction through frictionless, in-platform services such as instant financing and embedded insurance. For example, a travel-focused e-commerce site can offer parametric insurance for travel at checkout, a high-margin revenue stream that improves customer lifetime value.
This evolution toward a digital-first economy is propelled by the maturation of financial data security and ethical AI frameworks, making financial services a value-added component rather than a separate process.
We can help! Our analysts can customize this fintech and embedded banking in e-commerce market research report to meet your requirements.
 RIA -
RIA - 
