Fired Heaters Market Analysis, Size, and Forecast 2026-2030: APAC (China, India, and Japan), North America (US, Canada, and Mexico), Europe (Germany, UK, and France), Middle East and Africa (Saudi Arabia, UAE, and Turkey), South America (Brazil and Argentina), and Rest of World (ROW)

Fired Heaters Market Analysis, Size, and Forecast 2026-2030:
APAC (China, India, and Japan), North America (US, Canada, and Mexico), Europe (Germany, UK, and France), Middle East and Africa (Saudi Arabia, UAE, and Turkey), South America (Brazil and Argentina), and Rest of World (ROW)

Published: Mar 2026 290 Pages SKU: IRTNTR43986

Market Overview at a Glance

$175.69 Mn
Market Opportunity
3.4%
CAGR 2025 - 2030
32.5%
APAC Growth
$362.47 Mn
Oil and gas segment 2024

Fired Heaters Market Size 2026-2030

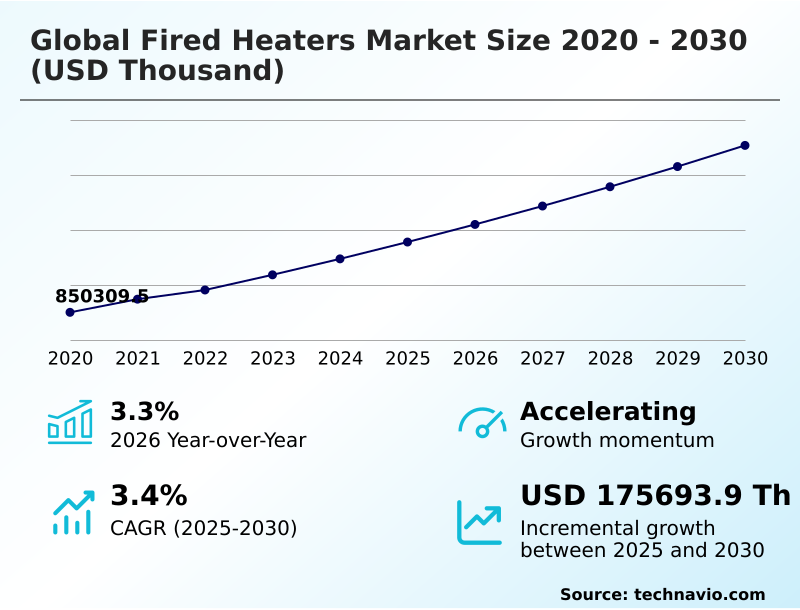
The fired heaters market size is valued to increase by USD 175.69 million, at a CAGR of 3.4% from 2025 to 2030. Modernization and capacity expansion of refining and petrochemical infrastructure will drive the fired heaters market.

Major Market Trends & Insights

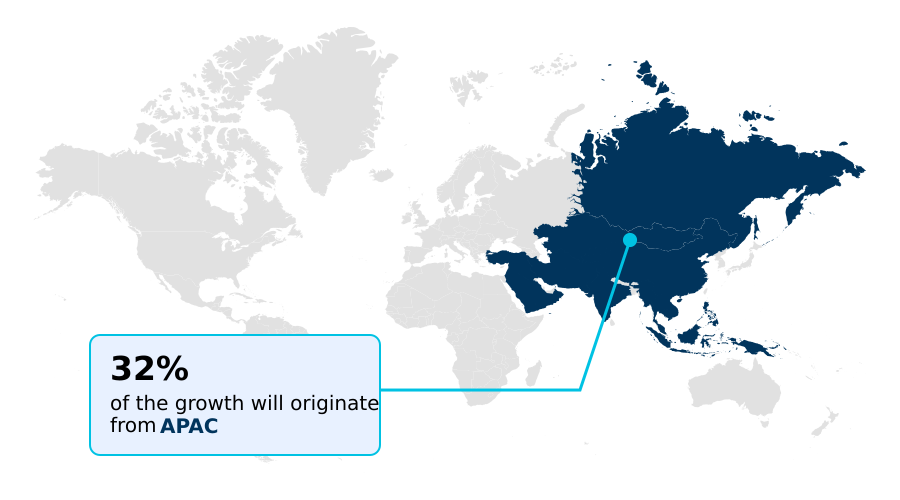
  • APAC dominated the market and accounted for a 32.5% growth during the forecast period.
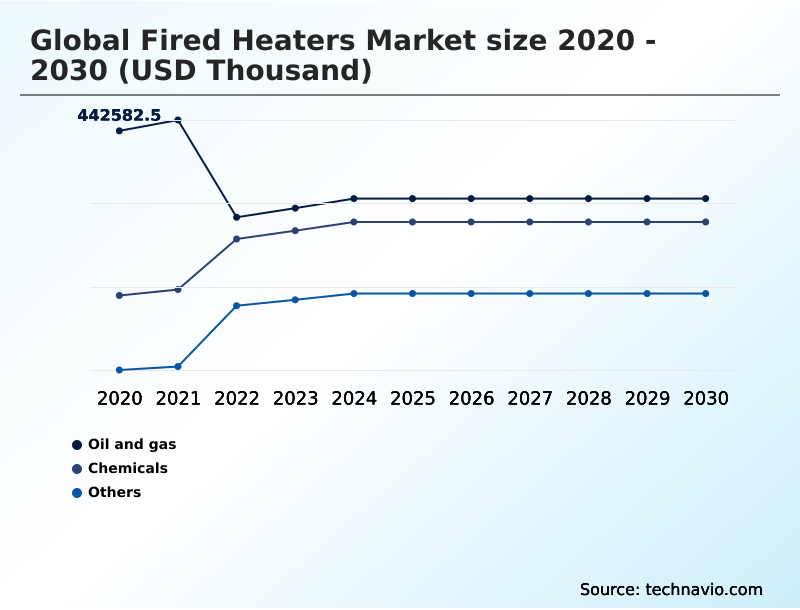
  • By Product - Oil and gas segment was valued at USD 362.47 million in 2024
  • By Type - Direct fired heater segment accounted for the largest market revenue share in 2024

Market Size & Forecast

  • Market Opportunities:
  • Market Future Opportunities: USD 175.69 million
  • CAGR from 2025 to 2030 : 3.4%

Market Summary

  • The fired heaters market is defined by a critical need for thermal efficiency optimization and adherence to stringent environmental mandates. At its core, the industry provides essential equipment for hydrocarbon processing, including crude oil distillation units and systems for thermal cracking processes.
  • A key driver is the continuous expansion of downstream petrochemical capacity, balanced by the necessity to modernize aging assets with advanced emission control technology and heat recovery steam generators. For instance, a refinery operator must balance the capital expenditure of a greenfield refinery construction against the operational expenditure reduction offered by a brownfield project revamp incorporating predictive maintenance algorithms.
  • This digital transformation, featuring digital twin simulation and advanced process control, is pivotal for enhancing asset integrity management and ensuring process safety management. As the sector navigates the energy transition strategy, the focus remains on developing intelligent, integrated heating systems that support both performance and sustainability goals.

What will be the Size of the Fired Heaters Market during the forecast period?

Get Key Insights on Market Forecast (PDF) Request Free Sample

How is the Fired Heaters Market Segmented?

The fired heaters industry research report provides comprehensive data (region-wise segment analysis), with forecasts and estimates in "USD thousand" for the period 2026-2030, as well as historical data from 2020-2024 for the following segments.

  • Product
    • Oil and gas
    • Chemicals
    • Others
  • Type
    • Direct fired heater
    • Indirect fired heater
  • Product type
    • Vertical cylindrical
    • Horizontal cylindrical
    • Cabin type
  • Geography
    • APAC
      • China
      • India
      • Japan
    • North America
      • US
      • Canada
      • Mexico
    • Europe
      • Germany
      • UK
      • France
    • Middle East and Africa
      • Saudi Arabia
      • UAE
      • Turkey
    • South America
      • Brazil
      • Argentina
    • Rest of World (ROW)

By Product Insights

The oil and gas segment is estimated to witness significant growth during the forecast period.

The oil and gas segment is integral to the fired heaters market, driven by the need for thermal processing in hydrocarbon refinement. Operations rely on these systems for crude distillation units and catalytic reformers to achieve precise process stream temperatures.

A significant focus is on retrofitting existing infrastructure with high-efficiency burner systems to enhance thermal performance analytics and reduce fuel consumption. The adoption of advanced process control and digital twin simulation is improving asset integrity management and operational reliability.

In fact, facilities implementing these digital strategies have reported a 25% reduction in unplanned maintenance events. This ongoing modernization, coupled with selective catalytic reduction for emissions, ensures sustained demand for advanced process heater efficiency.

Request Free Sample

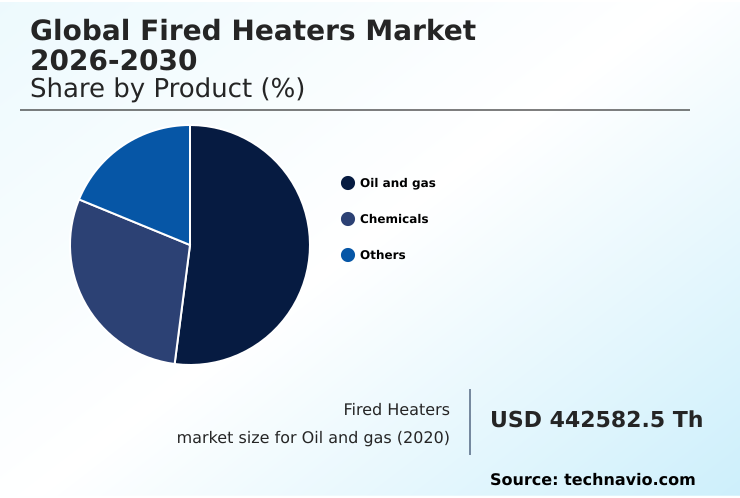
The Oil and gas segment was valued at USD 362.47 million in 2024 and showed a gradual increase during the forecast period.

Request Free Sample

Regional Analysis

APAC is estimated to contribute 32.5% to the growth of the global market during the forecast period.Technavio’s analysts have elaborately explained the regional trends and drivers that shape the market during the forecast period.

See How Fired Heaters Market Demand is Rising in APAC Request Free Sample

The geographic landscape of the global fired heaters market 2026-2030 is defined by a dual-speed dynamic.

In APAC and the Middle East, massive greenfield refinery construction projects are driving demand for high-capacity systems with advanced furnace draft control, where new installations often target thermal efficiencies exceeding 92%.

In contrast, North America and Europe are focused on brownfield project revamp initiatives, prioritizing decarbonization through carbon capture integration and hybrid heating solutions.

These retrofits, often involving sophisticated heat flux distribution analysis, are helping operators reduce NOx emissions by up to 60%.

This regional divergence influences everything from modular construction benefits to EPC project specification, creating a complex but opportunity-rich environment for suppliers who can cater to both new builds and sustainability-focused upgrades.

Market Dynamics

Our researchers analyzed the data with 2025 as the base year, along with the key drivers, trends, and challenges. A holistic analysis of drivers will help companies refine their marketing strategies to gain a competitive advantage.

  • Improving thermal efficiency of fired heaters remains a central objective for operators, influencing decisions from initial design to long-term maintenance. A key pathway involves fired heater design for hydrogen fuel, a critical step toward industrial decarbonization. Concurrently, efforts in reducing nox emissions from industrial heaters often necessitate integrating scr with process heaters or adopting advanced burner technologies.
  • The use of a digital twin for fired heater optimization is becoming standard for enhancing performance, complemented by predictive maintenance in refinery heaters to prevent failures. These digital strategies depend on robust fired heater control system upgrades.
  • On the physical side, proper material selection for high-temperature coils is crucial for longevity, especially in demanding applications like a fired heater for ethylene cracking furnace or a fired heater for delayed coker unit. Design choice, such as a cabin type heater for crude distillation versus addressing vertical cylindrical heater space requirements, also plays a role.
  • Operators must actively manage challenges like managing fouling in convection sections and understanding the lifecycle assessment of fired heaters. While challenges in electric fired heater adoption persist, compliance with api 560 compliance for new heaters and effective waste heat recovery from flue gas are non-negotiable.
  • Strategic planning incorporating these elements typically yields a total cost of ownership that is 10-15% lower than approaches focused solely on initial capex.

What are the key market drivers leading to the rise in the adoption of Fired Heaters Industry?

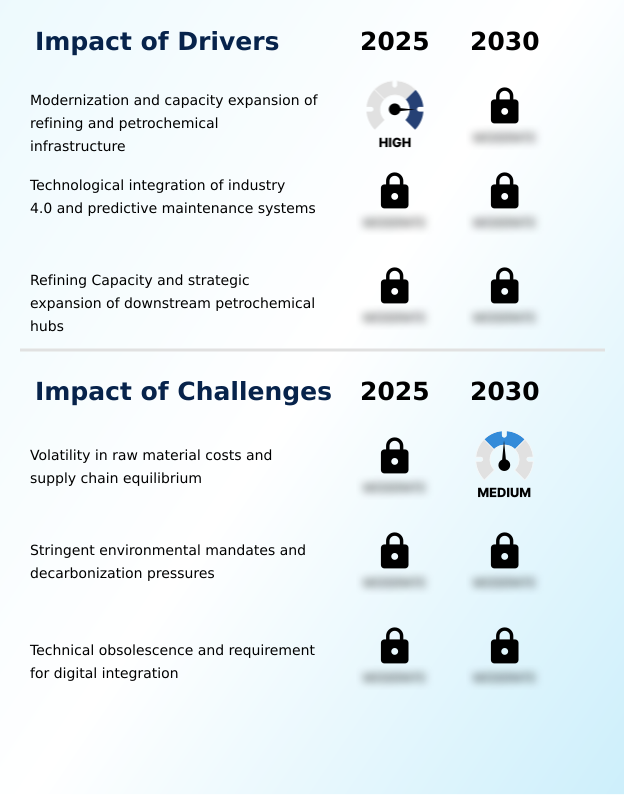
  • The modernization and capacity expansion of global refining and petrochemical infrastructure is a key driver fueling demand in the market.

  • Infrastructure modernization and strategic capacity expansion are primary market drivers. The development of modular heater design and skid-mounted heater units has significantly accelerated project timelines, reducing on-site construction by as much as 30% in some remote locations.
  • This approach is critical for both greenfield refinery construction and complex retrofits.
  • In parallel, the integration of Industrial Internet of Things (IIoT) technologies for tube skin temperature monitoring and the deployment of predictive maintenance algorithms are extending equipment service life by an average of 15%.
  • This convergence of advanced manufacturing and digital oversight, focused on enhancing process heater efficiency and enabling remote monitoring capability, underpins the market's forward momentum as operators seek greater returns on capital-intensive assets.

What are the market trends shaping the Fired Heaters Industry?

  • The integration of low-carbon hydrogen and advanced decarbonization technologies is emerging as a primary trend. This shift is reshaping equipment design and operational strategies across the industry.

  • The market is increasingly shaped by sustainability and digitalization trends, with a strong emphasis on industrial decarbonization. The adoption of hydrogen-ready burner systems and the push for carbon capture integration are becoming defining features in new projects and retrofits, with some systems demonstrating the potential to lower carbon intensity by over 20%.
  • Concurrently, the use of digital twin simulation for thermal stress analysis is reducing inspection costs by up to 40% while improving asset reliability. This shift toward green hydrogen fuel and advanced thermal performance analytics is compelling manufacturers to innovate beyond traditional combustion, creating a market where process safety management and environmental stewardship are intertwined.
  • The focus on dual-fuel flexibility and energy transition strategy is now a primary consideration in procurement.

What challenges does the Fired Heaters Industry face during its growth?

  • Volatility in raw material costs and disruptions to supply chain equilibrium present a key challenge affecting industry growth.

  • Market stability is challenged by raw material volatility and stringent environmental regulations. Unpredictable price spikes in specialized alloys for radiant coil metallurgy have resulted in project budget overruns approaching 25%, complicating lifecycle cost analysis for new installations.
  • Furthermore, the mandatory adoption of advanced emission control technology, including sophisticated flue gas recirculation and low-NOx burners, can increase initial capital expenditure by 10-20%. This financial pressure is compounded by the technical complexity of integrating these systems into existing plants, requiring significant engineering resources.
  • These factors create a difficult balancing act for operators striving to meet new environmental mandates without compromising financial viability or operational reliability.

Exclusive Technavio Analysis on Customer Landscape

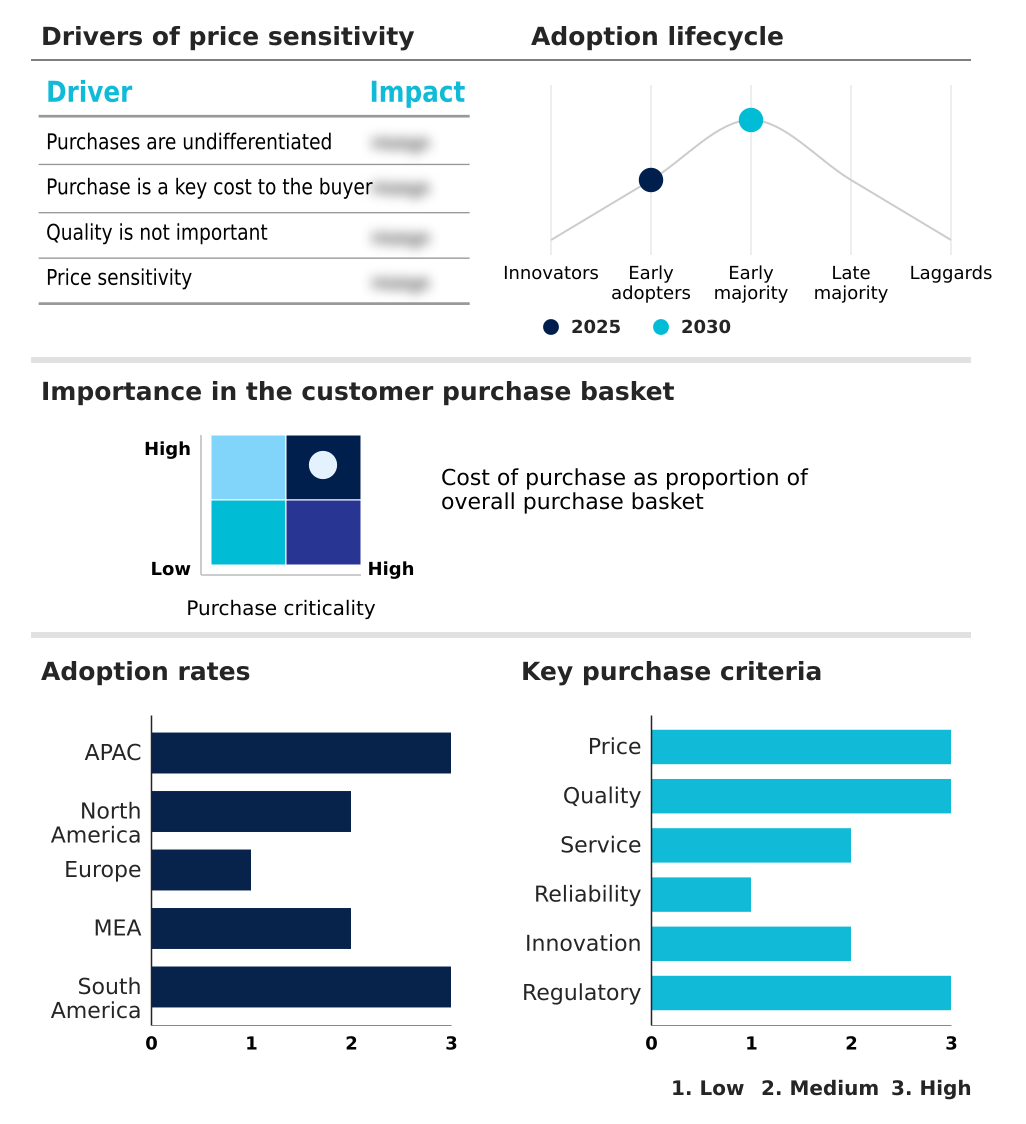
The fired heaters market forecasting report includes the adoption lifecycle of the market, covering from the innovator’s stage to the laggard’s stage. It focuses on adoption rates in different regions based on penetration. Furthermore, the fired heaters market report also includes key purchase criteria and drivers of price sensitivity to help companies evaluate and develop their market growth analysis strategies.

Customer Landscape of Fired Heaters Industry

Competitive Landscape

Companies are implementing various strategies, such as strategic alliances, fired heaters market forecast, partnerships, mergers and acquisitions, geographical expansion, and product/service launches, to enhance their presence in the industry.

Air Industrie Thermique - Engineered process furnaces and thermal systems are provided for the refining, petrochemical, and energy industries, emphasizing high-efficiency hydrocarbon processing and operational reliability.

The industry research and growth report includes detailed analyses of the competitive landscape of the market and information about key companies, including:

  • Air Industrie Thermique
  • Axens Group
  • Boustead Singapore Ltd.
  • ComEnCo Inc.
  • Exotherm Corp.
  • G.C. Broach Co.
  • Honeywell International Inc.
  • John Wood Group PLC
  • Linde Plc
  • Optimized Process Furnaces
  • Pirobloc S.A
  • Scandiuzzi Steel Constructions
  • Sigma Thermal Inc.
  • Stelter and Brinck Ltd.
  • TechEngineering S.r.l.
  • Thermax Ltd.
  • Tulsa Heaters Midstream
  • UnitBirwelco Ltd.
  • Wabtec Corp.
  • Zeeco Inc.

Qualitative and quantitative analysis of companies has been conducted to help clients understand the wider business environment as well as the strengths and weaknesses of key industry players. Data is qualitatively analyzed to categorize companies as pure play, category-focused, industry-focused, and diversified; it is quantitatively analyzed to categorize companies as dominant, leading, strong, tentative, and weak.

Recent Development and News in Fired heaters market

  • In January 2025, Honeywell launched its Hybrid Heating Solution, an automated platform allowing industrial facilities to switch between natural gas and electricity to optimize energy costs and reduce carbon footprints.
  • In September 2024, GE Vernova fully commercialized its digital twin platform for large-scale energy systems, enabling predictive maintenance and performance optimization for fired heaters.
  • In November 2024, IndianOil Corp. announced its Gujarat Refinery's LuPech project entered final commissioning, a project which includes multiple high-capacity fired heaters to scale capacity to 18 MMTPA.
  • In March 2025, the Chemical Safety Board issued a report emphasizing the need for modern digital safeguards and adequate safe operating limit alarms on legacy fired heaters, influencing new safety protocol adoption across the renewable fuels sector.

Dive into Technavio’s robust research methodology, blending expert interviews, extensive data synthesis, and validated models for unparalleled Fired Heaters Market insights. See full methodology.

Market Scope
Page number 290
Base year 2025
Historic period 2020-2024
Forecast period 2026-2030
Growth momentum & CAGR Accelerate at a CAGR of 3.4%
Market growth 2026-2030 USD 175693.9 thousand
Market structure Fragmented
YoY growth 2025-2026(%) 3.3%
Key countries China, India, Japan, South Korea, Indonesia, Australia, US, Canada, Mexico, Germany, UK, France, Italy, The Netherlands, Spain, Saudi Arabia, UAE, Turkey, South Africa, Israel, Brazil, Argentina and Chile
Competitive landscape Leading Companies, Market Positioning of Companies, Competitive Strategies, and Industry Risks

Request Free Sample

Research Analyst Overview

  • The fired heaters market is navigating a significant technological shift, driven by the need for thermal efficiency optimization and compliance with emissions standards. Core technologies such as low-NOx burners, advanced air preheat systems, and high-emissivity coatings for refractory lining material are becoming standard.
  • Decisions regarding radiant coil metallurgy and overall radiant section design are now critical boardroom-level concerns, directly tied to long-term sustainability and operational budgets. The integration of a sophisticated burner management system and furnace draft control, often guided by API 560 standards, is essential for maintaining pilot flame stability and ensuring safe hydrocarbon processing.
  • Facilities that have implemented comprehensive combustion management systems alongside waste heat recovery units have demonstrated fuel cost reductions of up to 10%. As the industry evolves, the focus is on mitigating issues like convection section fouling and coke formation prevention through smarter process stream temperature control and heat flux distribution analysis, ensuring both performance and compliance.

What are the Key Data Covered in this Fired Heaters Market Research and Growth Report?

  • What is the expected growth of the Fired Heaters Market between 2026 and 2030?

    • USD 175.69 million, at a CAGR of 3.4%

  • What segmentation does the market report cover?

    • The report is segmented by Product (Oil and gas, Chemicals, and Others), Type (Direct fired heater, and Indirect fired heater), Product Type (Vertical cylindrical, Horizontal cylindrical, and Cabin type) and Geography (APAC, North America, Europe, Middle East and Africa, South America)

  • Which regions are analyzed in the report?

    • APAC, North America, Europe, Middle East and Africa and South America

  • What are the key growth drivers and market challenges?

    • Modernization and capacity expansion of refining and petrochemical infrastructure, Volatility in raw material costs and supply chain equilibrium

  • Who are the major players in the Fired Heaters Market?

    • Air Industrie Thermique, Axens Group, Boustead Singapore Ltd., ComEnCo Inc., Exotherm Corp., G.C. Broach Co., Honeywell International Inc., John Wood Group PLC, Linde Plc, Optimized Process Furnaces, Pirobloc S.A, Scandiuzzi Steel Constructions, Sigma Thermal Inc., Stelter and Brinck Ltd., TechEngineering S.r.l., Thermax Ltd., Tulsa Heaters Midstream, UnitBirwelco Ltd., Wabtec Corp. and Zeeco Inc.

Market Research Insights

  • Market dynamics are shaped by a strategic push toward greater efficiency and sustainability, where lifecycle cost analysis heavily influences procurement decisions. The adoption of advanced process control (APC) has enabled operators to achieve fuel savings of up to 10%, directly impacting operational expenditure reduction.
  • Simultaneously, facilities leveraging digital twin simulation for predictive maintenance have reported a 30% decrease in unscheduled downtime, enhancing overall asset integrity management. This pivot to data-driven operations, supported by remote monitoring capability, is crucial as the industry contends with the complexities of industrial decarbonization and feedstock processing flexibility. The ability to integrate these technologies determines competitive positioning and long-term viability.

We can help! Our analysts can customize this fired heaters market research report to meet your requirements.

Get in touch

1. Executive Summary

1.1 Market overview

Executive Summary - Chart on Market Overview
Executive Summary - Data Table on Market Overview
Executive Summary - Chart on Global Market Characteristics
Executive Summary - Chart on Market by Geography
Executive Summary - Chart on Market Segmentation by Product
Executive Summary - Chart on Market Segmentation by Type
Executive Summary - Chart on Market Segmentation by Product Type
Executive Summary - Chart on Incremental Growth
Executive Summary - Data Table on Incremental Growth
Executive Summary - Chart on Company Market Positioning

2. Technavio Analysis

2.1 Analysis of price sensitivity, lifecycle, customer purchase basket, adoption rates, and purchase criteria

2.2 Criticality of inputs and Factors of differentiation

Chart on Overview on criticality of inputs and factors of differentiation

2.3 Factors of disruption

Chart on Overview on factors of disruption

2.4 Impact of drivers and challenges

Chart on Impact of drivers and challenges in 2025 and 2030

3. Market Landscape

3.1 Market ecosystem

Chart on Parent Market
Data Table on - Parent Market

3.2 Market characteristics

Chart on Market characteristics analysis

3.3 Value chain analysis

Chart on Value chain analysis

4. Market Sizing

4.1 Market definition

Data Table on Offerings of companies included in the market definition

4.2 Market segment analysis

Market segments

4.3 Market size 2025

4.4 Market outlook: Forecast for 2025-2030

Chart on Global - Market size and forecast 2025-2030 ($ thousand)
Data Table on Global - Market size and forecast 2025-2030 ($ thousand)
Chart on Global Market: Year-over-year growth 2025-2030 (%)
Data Table on Global Market: Year-over-year growth 2025-2030 (%)

5. Historic Market Size

5.1 Global Fired Heaters Market 2020 - 2024

Historic Market Size - Data Table on Global Fired Heaters Market 2020 - 2024 ($ thousand)

5.2 Product segment analysis 2020 - 2024

Historic Market Size - Product Segment 2020 - 2024 ($ thousand)

5.3 Type segment analysis 2020 - 2024

Historic Market Size - Type Segment 2020 - 2024 ($ thousand)

5.4 Product Type segment analysis 2020 - 2024

Historic Market Size - Product Type Segment 2020 - 2024 ($ thousand)

5.5 Geography segment analysis 2020 - 2024

Historic Market Size - Geography Segment 2020 - 2024 ($ thousand)

5.6 Country segment analysis 2020 - 2024

Historic Market Size - Country Segment 2020 - 2024 ($ thousand)

6. Qualitative Analysis

6.1 Impact of AI in global fired heaters market

7. Five Forces Analysis

7.1 Five forces summary

Five forces analysis - Comparison between 2025 and 2030

7.2 Bargaining power of buyers

Bargaining power of buyers - Impact of key factors 2025 and 2030

7.3 Bargaining power of suppliers

Bargaining power of suppliers - Impact of key factors in 2025 and 2030

7.4 Threat of new entrants

Threat of new entrants - Impact of key factors in 2025 and 2030

7.5 Threat of substitutes

Threat of substitutes - Impact of key factors in 2025 and 2030

7.6 Threat of rivalry

Threat of rivalry - Impact of key factors in 2025 and 2030

7.7 Market condition

Chart on Market condition - Five forces 2025 and 2030

8. Market Segmentation by Product

8.1 Market segments

Chart on Product - Market share 2025-2030 (%)
Data Table on Product - Market share 2025-2030 (%)

8.2 Comparison by Product

Chart on Comparison by Product
Data Table on Comparison by Product

8.3 Oil and gas - Market size and forecast 2025-2030

Chart on Oil and gas - Market size and forecast 2025-2030 ($ thousand)
Data Table on Oil and gas - Market size and forecast 2025-2030 ($ thousand)
Chart on Oil and gas - Year-over-year growth 2025-2030 (%)
Data Table on Oil and gas - Year-over-year growth 2025-2030 (%)

8.4 Chemicals - Market size and forecast 2025-2030

Chart on Chemicals - Market size and forecast 2025-2030 ($ thousand)
Data Table on Chemicals - Market size and forecast 2025-2030 ($ thousand)
Chart on Chemicals - Year-over-year growth 2025-2030 (%)
Data Table on Chemicals - Year-over-year growth 2025-2030 (%)

8.5 Others - Market size and forecast 2025-2030

Chart on Others - Market size and forecast 2025-2030 ($ thousand)
Data Table on Others - Market size and forecast 2025-2030 ($ thousand)
Chart on Others - Year-over-year growth 2025-2030 (%)
Data Table on Others - Year-over-year growth 2025-2030 (%)

8.6 Market opportunity by Product

Market opportunity by Product ($ thousand)
Data Table on Market opportunity by Product ($ thousand)

9. Market Segmentation by Type

9.1 Market segments

Chart on Type - Market share 2025-2030 (%)
Data Table on Type - Market share 2025-2030 (%)

9.2 Comparison by Type

Chart on Comparison by Type
Data Table on Comparison by Type

9.3 Direct fired heater - Market size and forecast 2025-2030

Chart on Direct fired heater - Market size and forecast 2025-2030 ($ thousand)
Data Table on Direct fired heater - Market size and forecast 2025-2030 ($ thousand)
Chart on Direct fired heater - Year-over-year growth 2025-2030 (%)
Data Table on Direct fired heater - Year-over-year growth 2025-2030 (%)

9.4 Indirect fired heater - Market size and forecast 2025-2030

Chart on Indirect fired heater - Market size and forecast 2025-2030 ($ thousand)
Data Table on Indirect fired heater - Market size and forecast 2025-2030 ($ thousand)
Chart on Indirect fired heater - Year-over-year growth 2025-2030 (%)
Data Table on Indirect fired heater - Year-over-year growth 2025-2030 (%)

9.5 Market opportunity by Type

Market opportunity by Type ($ thousand)
Data Table on Market opportunity by Type ($ thousand)

10. Market Segmentation by Product Type

10.1 Market segments

Chart on Product Type - Market share 2025-2030 (%)
Data Table on Product Type - Market share 2025-2030 (%)

10.2 Comparison by Product Type

Chart on Comparison by Product Type
Data Table on Comparison by Product Type

10.3 Vertical cylindrical - Market size and forecast 2025-2030

Chart on Vertical cylindrical - Market size and forecast 2025-2030 ($ thousand)
Data Table on Vertical cylindrical - Market size and forecast 2025-2030 ($ thousand)
Chart on Vertical cylindrical - Year-over-year growth 2025-2030 (%)
Data Table on Vertical cylindrical - Year-over-year growth 2025-2030 (%)

10.4 Horizontal cylindrical - Market size and forecast 2025-2030

Chart on Horizontal cylindrical - Market size and forecast 2025-2030 ($ thousand)
Data Table on Horizontal cylindrical - Market size and forecast 2025-2030 ($ thousand)
Chart on Horizontal cylindrical - Year-over-year growth 2025-2030 (%)
Data Table on Horizontal cylindrical - Year-over-year growth 2025-2030 (%)

10.5 Cabin type - Market size and forecast 2025-2030

Chart on Cabin type - Market size and forecast 2025-2030 ($ thousand)
Data Table on Cabin type - Market size and forecast 2025-2030 ($ thousand)
Chart on Cabin type - Year-over-year growth 2025-2030 (%)
Data Table on Cabin type - Year-over-year growth 2025-2030 (%)

10.6 Market opportunity by Product Type

Market opportunity by Product Type ($ thousand)
Data Table on Market opportunity by Product Type ($ thousand)

11. Customer Landscape

11.1 Customer landscape overview

Analysis of price sensitivity, lifecycle, customer purchase basket, adoption rates, and purchase criteria

12. Geographic Landscape

12.1 Geographic segmentation

Chart on Market share by geography 2025-2030 (%)
Data Table on Market share by geography 2025-2030 (%)

12.2 Geographic comparison

Chart on Geographic comparison
Data Table on Geographic comparison

12.3 APAC - Market size and forecast 2025-2030

Chart on APAC - Market size and forecast 2025-2030 ($ thousand)
Data Table on APAC - Market size and forecast 2025-2030 ($ thousand)
Chart on APAC - Year-over-year growth 2025-2030 (%)
Data Table on APAC - Year-over-year growth 2025-2030 (%)
Chart on Regional Comparison - APAC
Data Table on Regional Comparison - APAC

12.3.1 China - Market size and forecast 2025-2030

Chart on China - Market size and forecast 2025-2030 ($ thousand)
Data Table on China - Market size and forecast 2025-2030 ($ thousand)
Chart on China - Year-over-year growth 2025-2030 (%)
Data Table on China - Year-over-year growth 2025-2030 (%)

12.3.2 India - Market size and forecast 2025-2030

Chart on India - Market size and forecast 2025-2030 ($ thousand)
Data Table on India - Market size and forecast 2025-2030 ($ thousand)
Chart on India - Year-over-year growth 2025-2030 (%)
Data Table on India - Year-over-year growth 2025-2030 (%)

12.3.3 Japan - Market size and forecast 2025-2030

Chart on Japan - Market size and forecast 2025-2030 ($ thousand)
Data Table on Japan - Market size and forecast 2025-2030 ($ thousand)
Chart on Japan - Year-over-year growth 2025-2030 (%)
Data Table on Japan - Year-over-year growth 2025-2030 (%)

12.3.4 South Korea - Market size and forecast 2025-2030

Chart on South Korea - Market size and forecast 2025-2030 ($ thousand)
Data Table on South Korea - Market size and forecast 2025-2030 ($ thousand)
Chart on South Korea - Year-over-year growth 2025-2030 (%)
Data Table on South Korea - Year-over-year growth 2025-2030 (%)

12.3.5 Indonesia - Market size and forecast 2025-2030

Chart on Indonesia - Market size and forecast 2025-2030 ($ thousand)
Data Table on Indonesia - Market size and forecast 2025-2030 ($ thousand)
Chart on Indonesia - Year-over-year growth 2025-2030 (%)
Data Table on Indonesia - Year-over-year growth 2025-2030 (%)

12.3.6 Australia - Market size and forecast 2025-2030

Chart on Australia - Market size and forecast 2025-2030 ($ thousand)
Data Table on Australia - Market size and forecast 2025-2030 ($ thousand)
Chart on Australia - Year-over-year growth 2025-2030 (%)
Data Table on Australia - Year-over-year growth 2025-2030 (%)

12.4 North America - Market size and forecast 2025-2030

Chart on North America - Market size and forecast 2025-2030 ($ thousand)
Data Table on North America - Market size and forecast 2025-2030 ($ thousand)
Chart on North America - Year-over-year growth 2025-2030 (%)
Data Table on North America - Year-over-year growth 2025-2030 (%)
Chart on Regional Comparison - North America
Data Table on Regional Comparison - North America

12.4.1 US - Market size and forecast 2025-2030

Chart on US - Market size and forecast 2025-2030 ($ thousand)
Data Table on US - Market size and forecast 2025-2030 ($ thousand)
Chart on US - Year-over-year growth 2025-2030 (%)
Data Table on US - Year-over-year growth 2025-2030 (%)

12.4.2 Canada - Market size and forecast 2025-2030

Chart on Canada - Market size and forecast 2025-2030 ($ thousand)
Data Table on Canada - Market size and forecast 2025-2030 ($ thousand)
Chart on Canada - Year-over-year growth 2025-2030 (%)
Data Table on Canada - Year-over-year growth 2025-2030 (%)

12.4.3 Mexico - Market size and forecast 2025-2030

Chart on Mexico - Market size and forecast 2025-2030 ($ thousand)
Data Table on Mexico - Market size and forecast 2025-2030 ($ thousand)
Chart on Mexico - Year-over-year growth 2025-2030 (%)
Data Table on Mexico - Year-over-year growth 2025-2030 (%)

12.5 Europe - Market size and forecast 2025-2030

Chart on Europe - Market size and forecast 2025-2030 ($ thousand)
Data Table on Europe - Market size and forecast 2025-2030 ($ thousand)
Chart on Europe - Year-over-year growth 2025-2030 (%)
Data Table on Europe - Year-over-year growth 2025-2030 (%)
Chart on Regional Comparison - Europe
Data Table on Regional Comparison - Europe

12.5.1 Germany - Market size and forecast 2025-2030

Chart on Germany - Market size and forecast 2025-2030 ($ thousand)
Data Table on Germany - Market size and forecast 2025-2030 ($ thousand)
Chart on Germany - Year-over-year growth 2025-2030 (%)
Data Table on Germany - Year-over-year growth 2025-2030 (%)

12.5.2 UK - Market size and forecast 2025-2030

Chart on UK - Market size and forecast 2025-2030 ($ thousand)
Data Table on UK - Market size and forecast 2025-2030 ($ thousand)
Chart on UK - Year-over-year growth 2025-2030 (%)
Data Table on UK - Year-over-year growth 2025-2030 (%)

12.5.3 France - Market size and forecast 2025-2030

Chart on France - Market size and forecast 2025-2030 ($ thousand)
Data Table on France - Market size and forecast 2025-2030 ($ thousand)
Chart on France - Year-over-year growth 2025-2030 (%)
Data Table on France - Year-over-year growth 2025-2030 (%)

12.5.4 Italy - Market size and forecast 2025-2030

Chart on Italy - Market size and forecast 2025-2030 ($ thousand)
Data Table on Italy - Market size and forecast 2025-2030 ($ thousand)
Chart on Italy - Year-over-year growth 2025-2030 (%)
Data Table on Italy - Year-over-year growth 2025-2030 (%)

12.5.5 The Netherlands - Market size and forecast 2025-2030

Chart on The Netherlands - Market size and forecast 2025-2030 ($ thousand)
Data Table on The Netherlands - Market size and forecast 2025-2030 ($ thousand)
Chart on The Netherlands - Year-over-year growth 2025-2030 (%)
Data Table on The Netherlands - Year-over-year growth 2025-2030 (%)

12.5.6 Spain - Market size and forecast 2025-2030

Chart on Spain - Market size and forecast 2025-2030 ($ thousand)
Data Table on Spain - Market size and forecast 2025-2030 ($ thousand)
Chart on Spain - Year-over-year growth 2025-2030 (%)
Data Table on Spain - Year-over-year growth 2025-2030 (%)

12.6 Middle East and Africa - Market size and forecast 2025-2030

Chart on Middle East and Africa - Market size and forecast 2025-2030 ($ thousand)
Data Table on Middle East and Africa - Market size and forecast 2025-2030 ($ thousand)
Chart on Middle East and Africa - Year-over-year growth 2025-2030 (%)
Data Table on Middle East and Africa - Year-over-year growth 2025-2030 (%)
Chart on Regional Comparison - Middle East and Africa
Data Table on Regional Comparison - Middle East and Africa

12.6.1 Saudi Arabia - Market size and forecast 2025-2030

Chart on Saudi Arabia - Market size and forecast 2025-2030 ($ thousand)
Data Table on Saudi Arabia - Market size and forecast 2025-2030 ($ thousand)
Chart on Saudi Arabia - Year-over-year growth 2025-2030 (%)
Data Table on Saudi Arabia - Year-over-year growth 2025-2030 (%)

12.6.2 UAE - Market size and forecast 2025-2030

Chart on UAE - Market size and forecast 2025-2030 ($ thousand)
Data Table on UAE - Market size and forecast 2025-2030 ($ thousand)
Chart on UAE - Year-over-year growth 2025-2030 (%)
Data Table on UAE - Year-over-year growth 2025-2030 (%)

12.6.3 Turkey - Market size and forecast 2025-2030

Chart on Turkey - Market size and forecast 2025-2030 ($ thousand)
Data Table on Turkey - Market size and forecast 2025-2030 ($ thousand)
Chart on Turkey - Year-over-year growth 2025-2030 (%)
Data Table on Turkey - Year-over-year growth 2025-2030 (%)

12.6.4 South Africa - Market size and forecast 2025-2030

Chart on South Africa - Market size and forecast 2025-2030 ($ thousand)
Data Table on South Africa - Market size and forecast 2025-2030 ($ thousand)
Chart on South Africa - Year-over-year growth 2025-2030 (%)
Data Table on South Africa - Year-over-year growth 2025-2030 (%)

12.6.5 Israel - Market size and forecast 2025-2030

Chart on Israel - Market size and forecast 2025-2030 ($ thousand)
Data Table on Israel - Market size and forecast 2025-2030 ($ thousand)
Chart on Israel - Year-over-year growth 2025-2030 (%)
Data Table on Israel - Year-over-year growth 2025-2030 (%)

12.7 South America - Market size and forecast 2025-2030

Chart on South America - Market size and forecast 2025-2030 ($ thousand)
Data Table on South America - Market size and forecast 2025-2030 ($ thousand)
Chart on South America - Year-over-year growth 2025-2030 (%)
Data Table on South America - Year-over-year growth 2025-2030 (%)
Chart on Regional Comparison - South America
Data Table on Regional Comparison - South America

12.7.1 Brazil - Market size and forecast 2025-2030

Chart on Brazil - Market size and forecast 2025-2030 ($ thousand)
Data Table on Brazil - Market size and forecast 2025-2030 ($ thousand)
Chart on Brazil - Year-over-year growth 2025-2030 (%)
Data Table on Brazil - Year-over-year growth 2025-2030 (%)

12.7.2 Argentina - Market size and forecast 2025-2030

Chart on Argentina - Market size and forecast 2025-2030 ($ thousand)
Data Table on Argentina - Market size and forecast 2025-2030 ($ thousand)
Chart on Argentina - Year-over-year growth 2025-2030 (%)
Data Table on Argentina - Year-over-year growth 2025-2030 (%)

12.7.3 Chile - Market size and forecast 2025-2030

Chart on Chile - Market size and forecast 2025-2030 ($ thousand)
Data Table on Chile - Market size and forecast 2025-2030 ($ thousand)
Chart on Chile - Year-over-year growth 2025-2030 (%)
Data Table on Chile - Year-over-year growth 2025-2030 (%)

12.8 Market opportunity by geography

Market opportunity by geography ($ thousand)
Data Tables on Market opportunity by geography ($ thousand)

13. Drivers, Challenges, and Opportunity

13.1 Market drivers

Modernization and capacity expansion of refining and petrochemical infrastructure
Technological integration of industry 4.0 and predictive maintenance systems
Refining Capacity and strategic expansion of downstream petrochemical hubs

13.2 Market challenges

Volatility in raw material costs and supply chain equilibrium
Stringent environmental mandates and decarbonization pressures
Technical obsolescence and requirement for digital integration

13.3 Impact of drivers and challenges

Impact of drivers and challenges in 2025 and 2030

13.4 Market opportunities

Integration of low-carbon hydrogen and decarbonization technologies
Digitalization and predictive maintenance via digital twin technology
Expansion of refinery and petrochemical capacities

14. Competitive Landscape

14.1 Overview

14.2

Overview on criticality of inputs and factors of differentiation

14.3 Landscape disruption

Overview on factors of disruption

14.4 Industry risks

Impact of key risks on business

15. Competitive Analysis

15.1 Companies profiled

Companies covered

15.2 Company ranking index

15.3 Market positioning of companies

Matrix on companies position and classification

15.4 Axens Group

Axens Group - Overview
Axens Group - Product / Service
Axens Group - Key offerings
SWOT

15.5 ComEnCo Inc.

ComEnCo Inc. - Overview
ComEnCo Inc. - Product / Service
ComEnCo Inc. - Key offerings
SWOT

15.6 Exotherm Corp.

Exotherm Corp. - Overview
Exotherm Corp. - Product / Service
Exotherm Corp. - Key offerings
SWOT

15.7 G.C. Broach Co.

G.C. Broach Co. - Overview
G.C. Broach Co. - Product / Service
G.C. Broach Co. - Key offerings
SWOT

15.8 Honeywell International Inc.

Honeywell International Inc. - Overview
Honeywell International Inc. - Business segments
Honeywell International Inc. - Key news
Honeywell International Inc. - Key offerings
Honeywell International Inc. - Segment focus
SWOT

15.9 John Wood Group PLC

John Wood Group PLC - Overview
John Wood Group PLC - Business segments
John Wood Group PLC - Key offerings
John Wood Group PLC - Segment focus
SWOT

15.10 Linde Plc

Linde Plc - Overview
Linde Plc - Business segments
Linde Plc - Key news
Linde Plc - Key offerings
Linde Plc - Segment focus
SWOT

15.11 Pirobloc S.A

Pirobloc S.A - Overview
Pirobloc S.A - Product / Service
Pirobloc S.A - Key offerings
SWOT

15.12 Sigma Thermal Inc.

Sigma Thermal Inc. - Overview
Sigma Thermal Inc. - Product / Service
Sigma Thermal Inc. - Key offerings
SWOT

15.13 Stelter and Brinck Ltd.

Stelter and Brinck Ltd. - Overview
Stelter and Brinck Ltd. - Product / Service
Stelter and Brinck Ltd. - Key offerings
SWOT

15.14 TechEngineering S.r.l.

TechEngineering S.r.l. - Overview
TechEngineering S.r.l. - Product / Service
TechEngineering S.r.l. - Key offerings
SWOT

15.15 Thermax Ltd.

Thermax Ltd. - Overview
Thermax Ltd. - Business segments
Thermax Ltd. - Key news
Thermax Ltd. - Key offerings
Thermax Ltd. - Segment focus
SWOT

15.16 UnitBirwelco Ltd.

UnitBirwelco Ltd. - Overview
UnitBirwelco Ltd. - Product / Service
UnitBirwelco Ltd. - Key offerings
SWOT

15.17 Wabtec Corp.

Wabtec Corp. - Overview
Wabtec Corp. - Business segments
Wabtec Corp. - Key offerings
Wabtec Corp. - Segment focus
SWOT

15.18 Zeeco Inc.

Zeeco Inc. - Overview
Zeeco Inc. - Product / Service
Zeeco Inc. - Key offerings
SWOT

16. Appendix

16.1 Scope of the report

Market definition
Objectives
Notes and caveats

16.2 Inclusions and exclusions checklist

Inclusions checklist
Exclusions checklist

16.3 Currency conversion rates for US$

16.4 Research methodology

16.5 Data procurement

Information sources

16.6 Data validation

16.7 Validation techniques employed for market sizing

16.8 Data synthesis

16.9 360 degree market analysis

16.10 List of abbreviations

Research Methodology

Technavio presents a detailed picture of the market by way of study, synthesis, and summation of data from multiple sources. The analysts have presented the various facets of the market with a particular focus on identifying the key industry influencers. The data thus presented is comprehensive, reliable, and the result of extensive research, both primary and secondary.

INFORMATION SOURCES

Primary sources

  • Manufacturers and suppliers
  • Channel partners
  • Industry experts
  • Strategic decision makers

Secondary sources

  • Industry journals and periodicals
  • Government data
  • Financial reports of key industry players
  • Historical data
  • Press releases

DATA ANALYSIS

Data Synthesis

  • Collation of data
  • Estimation of key figures
  • Analysis of derived insights

Data Validation

  • Triangulation with data models
  • Reference against proprietary databases
  • Corroboration with industry experts

REPORT WRITING

Qualitative

  • Market drivers
  • Market challenges
  • Market trends
  • Five forces analysis

Quantitative

  • Market size and forecast
  • Market segmentation
  • Geographical insights
  • Competitive landscape

Interested in this report?

Get your sample now to see our research methodology and insights!

Download Now

Frequently Asked Questions

Fired Heaters market growth will increase by USD 175693.9 thousand thousand during 2026-2030.

The Fired Heaters market is expected to grow at a CAGR of 3.4% during 2026-2030.

Fired Heaters market is segmented by Product (Oil and gas, Chemicals , Others) Type (Direct fired heater, Indirect fired heater) Product type (Vertical cylindrical, Horizontal cylindrical, Cabin type)

Air Industrie Thermique, Axens Group, Boustead Singapore Ltd., ComEnCo Inc., Exotherm Corp., G.C. Broach Co., Honeywell International Inc., John Wood Group PLC, Linde Plc, Optimized Process Furnaces, Pirobloc S.A, Scandiuzzi Steel Constructions, Sigma Thermal Inc., Stelter and Brinck Ltd., TechEngineering S.r.l., Thermax Ltd., Tulsa Heaters Midstream, UnitBirwelco Ltd., Wabtec Corp., Zeeco Inc. are a few of the key vendors in the Fired Heaters market.

APAC will register the highest growth rate of 32.5% among the other regions. Therefore, the Fired Heaters market in APAC is expected to garner significant business opportunities for the vendors during the forecast period.

China, India, Japan, South Korea, Indonesia, Australia, US, Canada, Mexico, Germany, UK, France, Italy, The Netherlands, Spain, Saudi Arabia, UAE, Turkey, South Africa, Israel, Brazil, Argentina, Chile

  • Modernization and capacity expansion of refining and petrochemical infrastructure is the driving factor this market.

The Fired Heaters market vendors should focus on grabbing business opportunities from the Product segment as it accounted for the largest market share in the base year.