Flavored Milk Market in India Size 2025-2029
The flavored milk market in India size is forecast to increase by USD 6.05 billion, at a CAGR of 15.4% between 2024 and 2029.
- The market is characterized by the introduction of new products catering to consumers seeking high nutritional value and extended shelf life. This trend aligns with the growing awareness of health and wellness, driving demand for convenient and nutritious beverage options. However, the market faces challenges due to the rising incidence of lactose intolerance and milk allergies, necessitating innovation in product formulation to cater to these consumer segments.
- Companies must navigate these challenges by introducing lactose-free and allergy-friendly alternatives, ensuring inclusive product offerings that cater to diverse consumer needs. The new product launches in the flavored milk market reflect this strategic response, as companies seek to capitalize on the opportunity to provide consumers with nutritious and accessible beverage choices.
What will be the Size of the Flavored Milk Market in India during the forecast period?
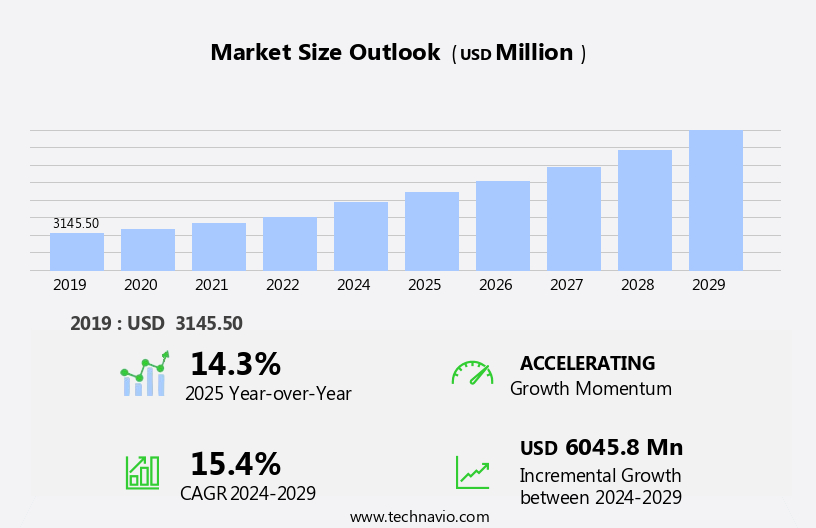
Explore in-depth regional segment analysis with market size data - historical 2019-2023 and forecasts 2025-2029 - in the full report.
Request Free Sample
The market continues to evolve, shaped by shifting consumer preferences, regulatory compliance, and new product development. Consumers seek convenience and innovation, leading to the rise of flavored milk in various sectors, from retail stores to convenience outlets. Pricing and marketing strategies adapt to price sensitivity and consumer behavior. Artificial and natural flavors infuse milk with diverse taste profiles, from vanilla and fruit purees to chocolate and strawberry. Milk fat content varies, with low-fat, fat-free, and reduced-fat options catering to health-conscious consumers. Vitamin D fortification and aseptic packaging extend shelf life, ensuring product quality and food safety. Product innovation drives the market, with companies integrating milk solids, flavor enhancers, and dairy ingredients to create unique offerings.
Regulatory compliance remains a priority, with strict adherence to food safety and environmental impact standards. Brand loyalty is a significant factor, with consumers drawn to trusted brands and high-quality products. Online retail and cold chain logistics expand distribution channels, ensuring accessibility and convenience. New product development continues, with the integration of natural sweeteners, whey protein, and fortified milk options. Milk processing technologies and packaging innovations, such as Tetra Pak and flexible packaging, streamline supply chain management and enhance consumer experience. The market's continuous dynamism underscores the importance of staying attuned to evolving trends and consumer preferences.
How is this Flavored Milk in India Industry segmented?
The flavored milk in India industry research report provides comprehensive data (region-wise segment analysis), with forecasts and estimates in "USD million" for the period 2025-2029, as well as historical data from 2019-2023 for the following segments.
- Flavor
- Chocolate
- Fruit
- Vanilla
- Others
- Distribution Channel
- Offline
- Online
- Type
- Dairy-based
- Plant-based
- Packaging
- Pouches
- Tetra packs
- Bottles
- Cans
- Geography
- APAC
- India
- APAC
By Flavor Insights
The chocolate segment is estimated to witness significant growth during the forecast period.
In India's dynamic dairy market, the flavored milk segment, particularly chocolate milk, experiences significant growth. Consumers' increasing health consciousness drives this trend, as chocolate milk offers a more appealing taste profile while delivering health benefits. Antioxidant-rich cocoa, a key ingredient in chocolate milk, reduces cell damage and prevents heart disease risks. Retail stores capitalize on this preference through various pricing and marketing strategies. Distribution channels, including cold chain logistics and tetra pak packaging, ensure product freshness and convenience. Companies like Nestle and Parag Milk cater to this segment, innovating with natural and artificial flavors, vitamin D fortification, and aseptic packaging.
Supply chain management and food safety are crucial aspects of production, with quality control and taste preferences shaping consumer loyalty. Online retail and convenience stores expand distribution channels, while regulatory compliance and environmental impact considerations influence new product development. Consumer behavior and price sensitivity shape milk processing techniques, with reduced-fat and fat-free milk options available alongside chocolate milk and strawberry milk. Packaging technologies and natural sweeteners, including milk solids, whey protein, and fortified milk, further enhance product offerings.
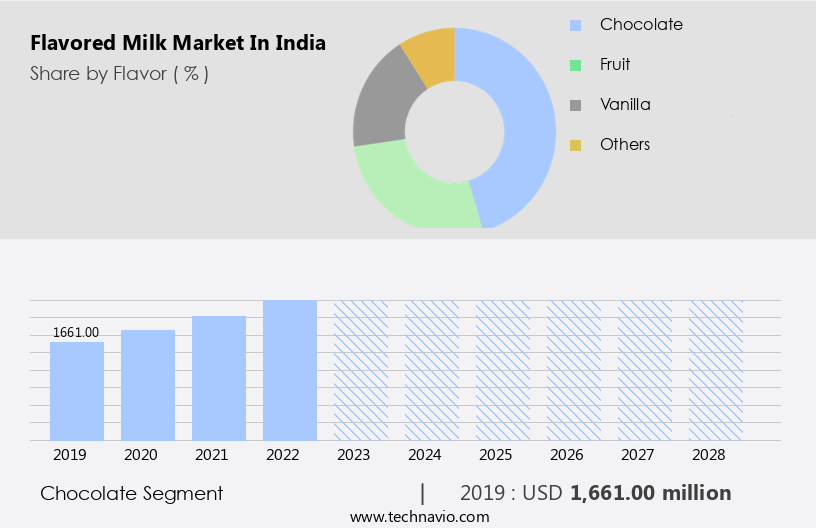
The Chocolate segment was valued at USD 1.66 billion in 2019 and showed a gradual increase during the forecast period.
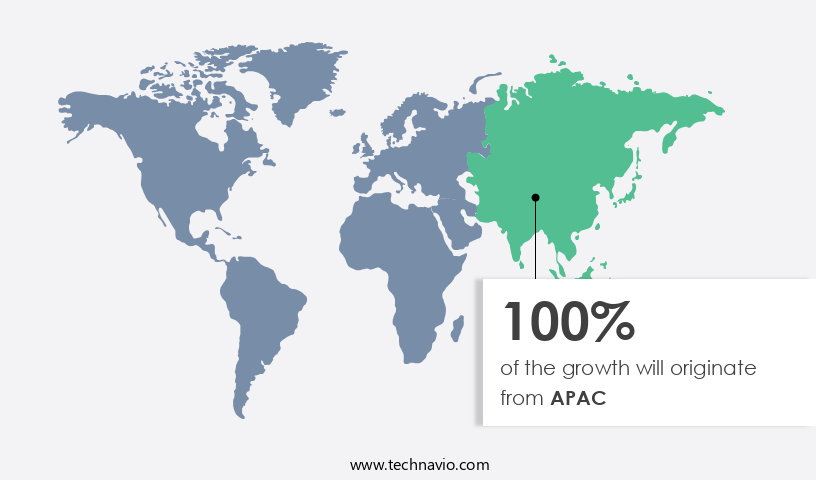
Regional Analysis
APAC is estimated to contribute 100% to the growth of the global market during the forecast period.Technavio's analysts have elaborately explained the regional trends and drivers that shape the market during the forecast period.
ai_geographic_landscape.multip
Market Dynamics
Our researchers analyzed the data with 2024 as the base year, along with the key drivers, trends, and challenges. A holistic analysis of drivers will help companies refine their marketing strategies to gain a competitive advantage.
B2B dairy beverage strategies utilize fortified milk technologies to cater to urban consumers. Flavored milk prospects 2025 include nutrient-enriched milk for schools and plant-based flavored drinks, driving demand. Flavored milk logistics analytics streamline distribution, while flavored milk benchmarks spotlight brands like Amul. Sustainable dairy sourcing supports health-focused beverage trends. Flavored milk regulations 2025-2029 guide milk demand in urban India 2025. Premium flavored milk offerings and flavored milk trend forecasts enhance growth. Flavored milk for convenience stores and unique flavor formulations target niches. Flavored milk hurdles and innovations address shelf-life challenges, with dairy supplier networks and flavored milk cost tactics boosting margins. Flavored milk market insights and functional dairy breakthroughs accelerate momentum.
What are the key market drivers leading to the rise in the adoption of Flavored Milk in India Industry?
- The high nutritional value and extended shelf life of flavored milk are primary factors driving market growth in this sector. Flavored milk is experiencing growing demand in India due to consumers' increasing focus on dietary nutrition and convenience. This trend is driven by the popularity of flavored milk's nutritional benefits, including calcium, vitamin A, and phosphorus. Additionally, high-temperature pasteurization used in aseptic packaging ensures a longer shelf life compared to plain milk. Urban Indian consumers are particularly drawn to these value-added dairy products for their convenience and health advantages. Furthermore, the availability of reduced-fat and sugar-free options caters to the health-conscious and diabetic population. Effective supply chain management and stringent quality control measures ensure food safety and maintain consumer trust, contributing to brand loyalty.
- Flavored milk's natural and artificial flavor enhancers add to its taste preferences, further increasing its appeal.
What are the market trends shaping the Flavored Milk in India Industry?
- The market is currently witnessing a notable trend with the introduction of new products. This sector is experiencing significant growth due to the launch of innovative and appealing flavored milk offerings.
- In India's dynamic dairy market, companies are focusing on new product development to cater to evolving consumer preferences. These innovations add diversity to the product portfolio and help businesses compete effectively. For instance, Mother Dairy, a leading player, introduced Haldi Milk with Butterscotch flavor in June 2020. This health-focused beverage, available since November 2024, is made from 100% milk and fortified with concentrated turmeric extract. Each bottle delivers the benefits of consuming one teaspoon of turmeric in milk, aligning with traditional Indian wellness practices.
- Consumer trends in India indicate a growing preference for healthier dairy options. As a result, companies are focusing on regulatory compliance, using natural ingredients like milk fat, artificial sweeteners, and artificial flavors, and adding value-added components such as whey protein and fortified milk. This approach enables businesses to cater to the health-conscious Indian consumer base while maintaining product quality and innovation.
What challenges does the Flavored Milk in India Industry face during its growth?
- The increasing prevalence of lactose intolerance and milk allergies poses a significant challenge to the growth of the dairy industry. Flavored milk, including chocolate and strawberry varieties, holds a significant market in India due to the country's rich dairy tradition. However, consumer behavior in this sector is influenced by factors such as lactose intolerance and milk allergies. Approximately 60% of the Indian population is lactose intolerant, limiting the potential consumer base for traditional dairy-based flavored milk. In response, milk processing companies are adopting packaging technologies like flexible packaging and natural sweeteners to cater to this demographic. Additionally, the increasing awareness of environmental impact has led to a preference for eco-friendly packaging solutions.
- As consumers become more price-sensitive and health-conscious, the demand for non-dairy alternatives like almond, soy, or oat milk is on the rise. This shift in preference may impact the market dynamics of traditional dairy-based flavored milk.
Exclusive Customer Landscape
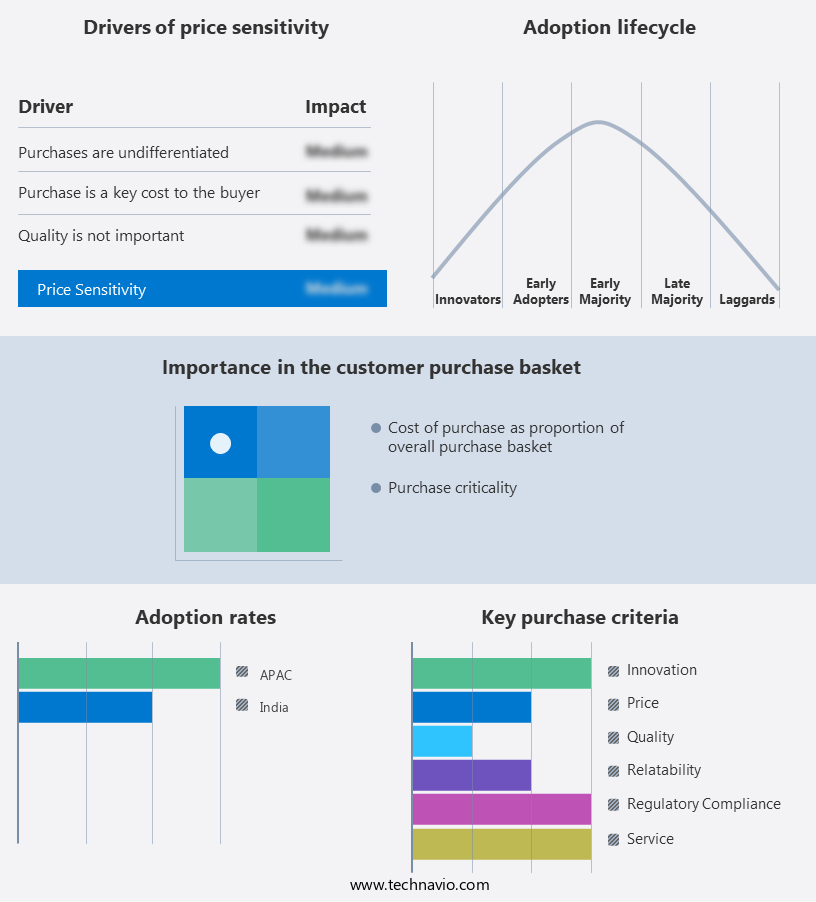
The flavored milk market in India forecasting report includes the adoption lifecycle of the market, covering from the innovator's stage to the laggard's stage. It focuses on adoption rates in different regions based on penetration. Furthermore, the flavored milk market in India report also includes key purchase criteria and drivers of price sensitivity to help companies evaluate and develop their market growth analysis strategies.
Customer Landscape
Key Companies & Market Insights
Companies are implementing various strategies, such as strategic alliances, flavored milk market in India forecast, partnerships, mergers and acquisitions, geographical expansion, and product/service launches, to enhance their presence in the industry.
Adisoy Foods and Beverages Pvt. Ltd. - This dairy alternative producer introduces a range of flavored milk options, including Milsoy Natural, Strawberry, Butterscotch, Mango, Elaichi, and Chocolate. Additionally, they provide flavored soya milk. The diverse selection caters to various taste preferences, broadening consumer choices within the plant-based milk market.
The industry research and growth report includes detailed analyses of the competitive landscape of the market and information about key companies, including:
- Adisoy Foods and Beverages Pvt. Ltd.
- Arla Foods amba
- CavinKare Pvt. Ltd.
- G.K. Dairy and Milk Products Pvt. Ltd.
- Gujarat Cooperative Milk Marketing Federation Ltd.
- Gujarat Food Web Pvt.Ltd.
- Heritage Foods Ltd.
- Inner Mongolia Yili Industrial Group Co. Ltd.
- Kwality Ltd.
- Meiji Holdings Co. Ltd.
- Mother Dairy Fruit and Vegetable Pvt. Ltd.
- Nestle SA
- Parag Milk Foods Ltd.
- The Hershey Co.
- The indian Dairy Group
Qualitative and quantitative analysis of companies has been conducted to help clients understand the wider business environment as well as the strengths and weaknesses of key industry players. Data is qualitatively analyzed to categorize companies as pure play, category-focused, industry-focused, and diversified; it is quantitatively analyzed to categorize companies as dominant, leading, strong, tentative, and weak.
Recent Development and News in Flavored Milk Market In India
- In January 2024, Amul, a leading dairy cooperative in India, introduced a new line of flavored milk beverages, named 'Amul Fruit Up,' to cater to the growing demand for healthier and more flavorful dairy products (Amul Press Release). In March 2024, Nestle India, in collaboration with ITC Limited, announced the launch of a new range of flavored milk beverages under the 'Nestle Chocolate Spreads' brand, expanding their product portfolio in the competitive Indian dairy market (Nestle India Press Release).
- In May 2024, Parag Milk Foods, the Indian dairy major, raised INR 1,200 crores (USD155 million) through a qualified institutional placement (QIP) issue to fund its expansion plans, including the establishment of new manufacturing facilities and the launch of innovative dairy products, including flavored milk beverages (Parag Milk Foods SEC Filing). In April 2025, the Food Safety and Standards Authority of India (FSSAI) approved the use of natural flavors in milk and milk products, enabling manufacturers to launch a wider range of flavored milk beverages in the Indian market, thereby increasing the market potential for this product category (FSSAI Press Release).
Research Analyst Overview
- The Indian flavored milk market is experiencing dynamic shifts, driven by consumer preferences for milk alternatives and reduced sugar content. Plastic packaging, while convenient, raises concerns regarding waste reduction and carbon footprint. Cost optimization and inventory management are key focus areas for manufacturers, leading to increased adoption of carton packaging. Nutritional value and quality assurance are paramount, with milk collection and ethical sourcing of ingredients becoming essential sustainability initiatives. Plant-based milk options, such as almond, soy, coconut, oat, and concentrated milk, are gaining popularity due to their lower calorie count and protein content. Food standards and labeling regulations are increasingly stringent, demanding transparency in calorie count, fat content, carbohydrate content, and ingredient sourcing.
- Production efficiency and energy consumption are critical factors in reducing costs and maintaining profitability. Sustainability initiatives, including water usage and carbon footprint reduction, are essential for long-term growth in this competitive market. Artificial intelligence and advanced packaging materials are being explored to enhance demand forecasting and streamline operations.
Dive into Technavio's robust research methodology, blending expert interviews, extensive data synthesis, and validated models for unparalleled Flavored Milk Market in India insights. See full methodology.
|
Market Scope |
|
|
Report Coverage |
Details |
|
Page number |
190 |
|
Base year |
2024 |
|
Historic period |
2019-2023 |
|
Forecast period |
2025-2029 |
|
Growth momentum & CAGR |
Accelerate at a CAGR of 15.4% |
|
Market growth 2025-2029 |
USD 6045.8 million |
|
Market structure |
Fragmented |
|
YoY growth 2024-2025(%) |
14.3 |
|
Key countries |
India |
|
Competitive landscape |
Leading Companies, Market Positioning of Companies, Competitive Strategies, and Industry Risks |
What are the Key Data Covered in this Flavored Milk Market in India Research and Growth Report?
- CAGR of the Flavored Milk in India industry during the forecast period
- Detailed information on factors that will drive the growth and forecasting between 2025 and 2029
- Precise estimation of the size of the market and its contribution of the industry in focus to the parent market
- Accurate predictions about upcoming growth and trends and changes in consumer behaviour
- Growth of the market across India
- Thorough analysis of the market's competitive landscape and detailed information about companies
- Comprehensive analysis of factors that will challenge the flavored milk market in India growth of industry companies
We can help! Our analysts can customize this flavored milk market in India research report to meet your requirements.
 RIA -
RIA - 
