Floating LNG Power Vessel Market Size 2024-2028
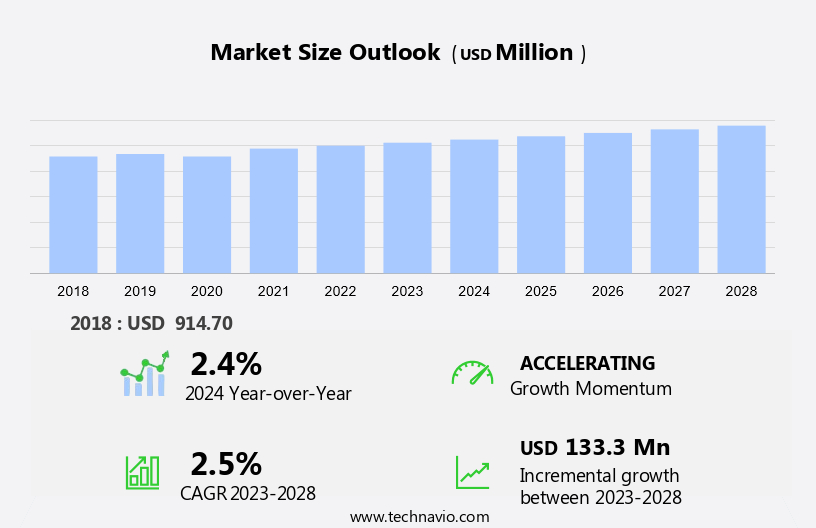
The floating LNG power vessel market size is forecast to increase by USD 133.3 million at a CAGR of 2.5% between 2023 and 2028.
- The market is experiencing significant growth due to the increasing demand for cleaner-burning fuels and energy resources. With shipbuilding expertise advancing, these power barges have become a viable solution for energy security and coastal development. In coastal communities and remote locations, these power generation systems provide a reliable source of electricity, particularly in areas prone to natural disasters. The rise in deepwater and ultra-deepwater drilling projects has also contributed to the market's growth. However, safety challenges associated with floating LNG vessels remain a concern and require continuous attention from industry players. As LNG infrastructure becomes more prevalent, the market is poised for continued expansion. This market analysis report provides an in-depth examination of market growth factors, challenges, and future opportunities.
What will be the Size of the Market During the Forecast Period?
- Liquefied Natural Gas (LNG) has emerged as a popular cleaner fuel for power generation due to its environmental benefits. Floating LNG Power Vessels (FLNG PVs) are an innovative solution for offshore power generation that utilizes LNG as a fuel source. These vessels offer several advantages, including safety features, fuel efficiency, and environmental sustainability. Design and Technology: FLNG PVs are designed to convert LNG into electricity using gas turbines or reciprocating engines. The vessels are equipped with advanced technology to ensure safe and efficient LNG handling and processing.
- Moreover, the designs of these vessels enable them to be located in deep waters, providing access to remote areas that were previously inaccessible for power generation. Safety and Efficiency: Safety is a top priority in the design and operation of FLNG PVs. These vessels are equipped with advanced safety systems to prevent accidents and ensure safe LNG handling. The use of LNG as a fuel source also results in higher fuel efficiency compared to traditional power generation methods. Environmental Sustainability: FLNG PVs offer significant environmental benefits. Natural gas is a cleaner energy source than traditional fossil fuels, resulting in lower greenhouse gas emissions and carbon emissions.
How is this market segmented and which is the largest segment?
The market research report provides comprehensive data (region-wise segment analysis), with forecasts and estimates in "USD million" for the period 2024-2028, as well as historical data from 2018-2022 for the following segments.
- Type
- Power barge
- Power ship
- Geography
- APAC
- China
- Middle East and Africa
- Europe
- North America
- South America
- APAC
By Type Insights
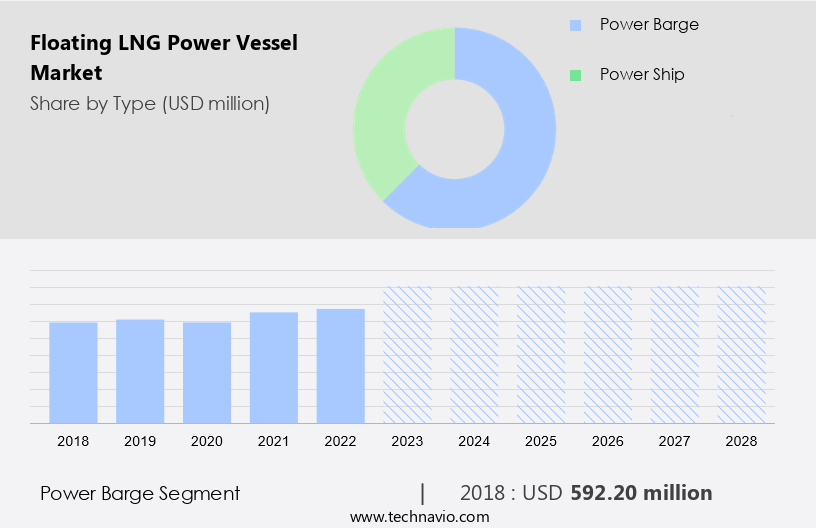
- The power barge segment is estimated to witness significant growth during the forecast period.
Floating LNG Power Vessels, also known as power barges, are self-sufficient, mobile power generation systems that operate independently of local energy resources and infrastructure. These vessels are particularly beneficial for coastal regions, harbors, and sites near rivers, as they can be quickly deployed to provide electricity to these areas. Power barges are equipped with large reciprocating engines that can run on LNG in pure gas mode or dual fuel systems with oil as a backup. This flexibility ensures high availability and efficiency, as the engines maintain optimal performance from low loads to maximum capacity. Moreover, the efficiency of reciprocating engines remains consistent even in tropical climates, where temperatures can exceed 39 degrees Celsius, making them a superior choice over other generation technologies in such environments.
In addition, the LNG infrastructure required for these power barges is minimal, making them an attractive solution for energy security and coastal development. They are also well-suited for remote locations and communities that may be vulnerable to natural disasters, as they can be easily relocated or deployed in emergency situations. With the increasing demand for cleaner-burning fuels and renewable energy resources, the use of LNG power barges is expected to grow significantly in the coming years.
Get a glance at the market report of share of various segments Request Free Sample
The power barge segment was valued at USD 592.20 million in 2018 and showed a gradual increase during the forecast period.
Regional Analysis
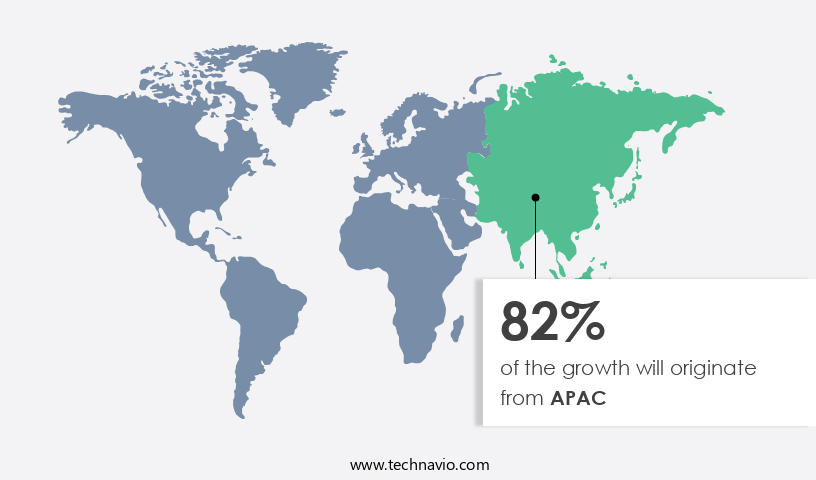
- APAC is estimated to contribute 82% to the growth of the global market during the forecast period.
Technavio's analysts have elaborately explained the regional trends and drivers that shape the market during the forecast period.
For more insights on the market share of various regions Request Free Sample
The market is experiencing significant growth, particularly in the Asia Pacific (APAC) region. The increasing urbanization and population growth in APAC, coupled with rising energy demands, are driving the expansion of this market. Additionally, the increasing vehicle demand and supportive government policies and initiatives are providing impetus to the market's growth. Major offshore exploration regions in APAC include West Australia, the South China Sea, the Yellow Sea, East India, and Malaysia. Companies are exploring new opportunities to extract natural gas from regions such as the Cash-Maple gas/condensate fields in the Timor Sea. Power generation systems and power distribution systems are integral components of floating LNG power vessels. These systems utilize various technologies such as Gas Turbines, Internal Combustion Engines (IC), and Steam Turbines to generate electricity. Transformers and switchboards are used to distribute the electricity to various end-users. The market for floating LNG power vessels is segmented into Small-Scale Vessels, Medium-Scale Vessels, and Large-Scale Vessels based on the capacity of the vessels. Gas Turbines and IC engines are commonly used for power generation in Small-Scale and Medium-Scale vessels, while Steam Turbines are used in Large-Scale vessels. The market for floating LNG power vessels is expected to grow at a steady pace due to the increasing demand for reliable and clean energy sources, especially in remote locations and offshore oil and gas platforms.
The market is also expected to benefit from the growing trend of decarbonization and the increasing focus on reducing greenhouse gas emissions. In conclusion, the market is witnessing significant growth in the Asia Pacific region due to increasing urbanization, population growth, and energy demands. The market is segmented into Small-Scale, Medium-Scale, and Large-Scale vessels, and utilizes various power generation systems such as Gas Turbines, IC Engines, and Steam Turbines. The market is expected to continue growing due to the increasing demand for reliable and clean energy sources and the growing trend of decarbonization.
Market Dynamics
Our researchers analyzed the data with 2023 as the base year, along with the key drivers, trends, and challenges. A holistic analysis of drivers will help companies refine their marketing strategies to gain a competitive advantage.
What are the key market drivers leading to the rise in adoption of Floating LNG Power Vessel Market ?
Increased adoption of LNG as energy source is the key driver of the market.
- LNG, or liquefied natural gas, is recognized as a cleaner alternative to traditional fossil fuels in addressing energy demand and reducing greenhouse gas emissions. Governments worldwide are advocating for its adoption to combat air pollution and contribute to a sustainable energy future. For instance, the European Union aims to achieve net-zero greenhouse gas emissions by 2050. In the maritime industry, LNG is increasingly used due to regulatory measures, such as the International Maritime Organization's (IMO) mandatory steps taken on January 1, 2013, to decrease greenhouse gas emissions from international shipping. Power Barges and Power Ships, which utilize LNG as fuel, are gaining popularity as they offer a cleaner solution for power generation.
- Furthermore, natural gas reserves, including offshore reserves, provide a substantial energy source for these applications. LNG's competitive pricing, in comparison to other fossil fuels, and its ability to meet global emission norms make it an attractive choice for power infrastructure.
What are the market trends shaping the Floating LNG Power Vessel Market?
Rise in number of deepwater and ultra-deepwater drilling projects is the upcoming trend in the market.
- The Floating LNG (FLNG) technology has gained significant attention in the US energy sector, particularly in the context of deepwater and ultra-deepwater projects. With the oil prices experiencing a downturn due to the COVID-19 pandemic, companies are exploring cost-effective solutions for offshore energy production. FLNG power vessels offer several advantages over traditional fixed platforms, including reduced investment costs and earlier cash flow. These vessels, which convert liquefied natural gas (LNG) into power, are essential for offshore power generation. They provide safety features, such as fire protection systems and gas detection sensors, ensuring environmental sustainability and minimizing greenhouse gas emissions.
- FSRUs (Floatng Storage and Regasification Units) are a type of FLNG vessel that store and regasify LNG, making it available for power generation. The use of FLNG technology in power generation offers fuel efficiency and contributes to the reduction of carbon emissions, making it an attractive option for offshore power solutions. Companies are increasingly investing in this technology to meet the growing demand for clean energy and reduce reliance on traditional fossil fuels. As the US energy sector continues to evolve, FLNG vessels are expected to play a crucial role in providing sustainable and cost-effective power solutions offshore.
What challenges does Floating LNG Power Vessel Market face during the growth?
Safety challenges associated with FLNG vessels is a key challenge affecting the market growth.
- Maritime fuel transitions are shaping the energy landscape with the increasing adoption of Natural Gas for electricity generation in Floating Liquefied Natural Gas (FLNG) Power Vessels. This shift is driven by the escalating electricity demand and the desire to reduce transportation costs associated with conventional fuel sources. However, the operation of FLNG power vessels presents unique challenges, particularly in ensuring safety and reliability. Equipment such as risers, pipes, separators, heat exchangers, turbines, compressors, and pumps are integral to the FLNG system and pose potential risks if not managed properly. Unintended releases from these components can lead to fires and explosions, which are major safety concerns in FLNG power vessels.
- Furthermore, the limited escape routes onboard these vessels underscore the importance of strong safety systems. The challenges of operating FLNG power vessels extend beyond safety. The LNG-to-Power projects require significant capital investment and complex engineering. Tugboat assistance and other logistical challenges further add to the operational costs. As the energy sector evolves, it is crucial for stakeholders to stay informed about the latest industry trends and best practices to optimize the performance and profitability of their FLNG power projects.
Exclusive Customer Landscape
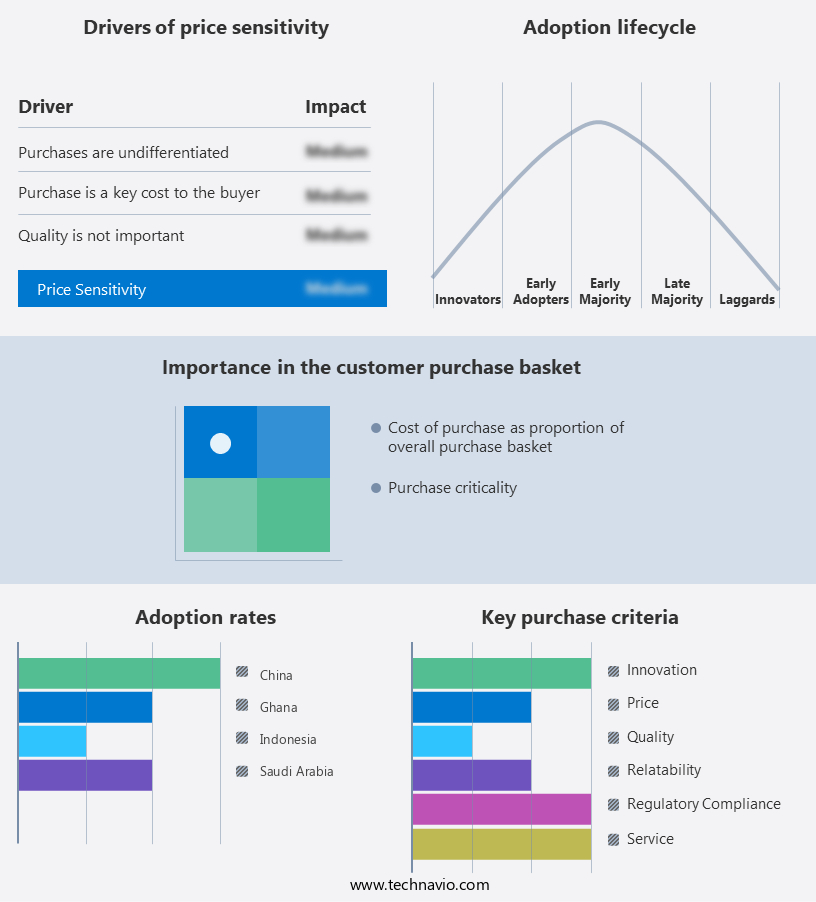
The market forecasting report includes the adoption lifecycle of the market, covering from the innovator's stage to the laggard's stage. It focuses on adoption rates in different regions based on penetration. Furthermore, the market report also includes key purchase criteria and drivers of price sensitivity to help companies evaluate and develop their market growth analysis strategies.
Customer Landscape
Key Companies & Market Insights
Companies are implementing various strategies, such as strategic alliances, market forecast , partnerships, mergers and acquisitions, geographical expansion, and product/service launches, to enhance their presence in the market.
The market research and growth report includes detailed analyses of the competitive landscape of the market and information about key companies, including:
- Becker Marine Systems GmbH
- Bluewater Energy Services BV
- Burmeister and Wain Scandinavian Contractor AS
- Chiyoda Corp.
- General Electric Co.
- Golar LNG Ltd.
- Hanwha Corp.
- IHI Corp.
- Karadeniz Holding A.S.
- Kawasaki Heavy Industries Ltd.
- MAN Energy Solutions SE
- MODEC Inc.
- Samsung Electronics Co. Ltd.
- Seatech Engineering Ltd.
- Seatrium Ltd.
- Siemens AG
- Waller Marine Inc.
- Wartsila Corp.
- Wison Group
Qualitative and quantitative analysis of companies has been conducted to help clients understand the wider business environment as well as the strengths and weaknesses of key market players. Data is qualitatively analyzed to categorize companies as pure play, category-focused, industry-focused, and diversified; it is quantitatively analyzed to categorize companies as dominant, leading, strong, tentative, and weak.
Research Analyst Overview
Floating LNG power vessels represent a revolutionary approach to power generation, combining the benefits of Liquefied Natural Gas (LNG) as a cleaner energy source and the flexibility of offshore solutions. These vessels employ advanced technologies and innovative designs to ensure safety, fuel efficiency, and environmental sustainability. The power generation system onboard these vessels can cater to various scales, from small-scale to large-scale, making them suitable for electricity supply in remote locations and coastal communities. Safety features are a top priority, with strong safety systems in place to mitigate potential risks. These vessels adhere to stringent regulations to minimize greenhouse gas emissions and contribute to climate change mitigation efforts.
Furthermore, the power generation system, which can include gas turbines, internal combustion engines (IC), or steam turbines, is integrated with transformers, switchboards, and power distribution systems to optimize energy production. Floating LNG power vessels offer energy security and contribute to coastal development by providing electricity supply in regions with high energy demand and limited power infrastructure. Their ability to operate in natural disaster-prone areas makes them an attractive solution for offshore power solutions. Despite the initial investment, the adoption of LNG as a maritime fuel and the potential for LNG-to-power projects can offset transportation costs and provide a sustainable energy future.
|
Market Scope |
|
|
Report Coverage |
Details |
|
Page number |
162 |
|
Base year |
2023 |
|
Historic period |
2018-2022 |
|
Forecast period |
2024-2028 |
|
Growth momentum & CAGR |
Accelerate at a CAGR of 2.5% |
|
Market growth 2024-2028 |
USD 133.3 million |
|
Market structure |
Fragmented |
|
YoY growth 2023-2024(%) |
2.4 |
|
Key countries |
China, Indonesia, Ghana, and Saudi Arabia |
|
Competitive landscape |
Leading Companies, Market Positioning of Companies, Competitive Strategies, and Industry Risks |
What are the Key Data Covered in this Market Research and Growth Report?
- CAGR of the market during the forecast period
- Detailed information on factors that will drive the market growth and forecasting between 2024 and 2028
- Precise estimation of the size of the market and its contribution of the market in focus to the parent market
- Accurate predictions about upcoming market growth and trends and changes in consumer behaviour
- Growth of the market across APAC, Middle East and Africa, Europe, North America, and South America
- Thorough analysis of the market's competitive landscape and detailed information about companies
- Comprehensive analysis of factors that will challenge the growth of market companies
We can help! Our analysts can customize this market research report to meet your requirements. Get in touch
 RIA -
RIA - 
