
APAC Food Service Market Size 2026-2030
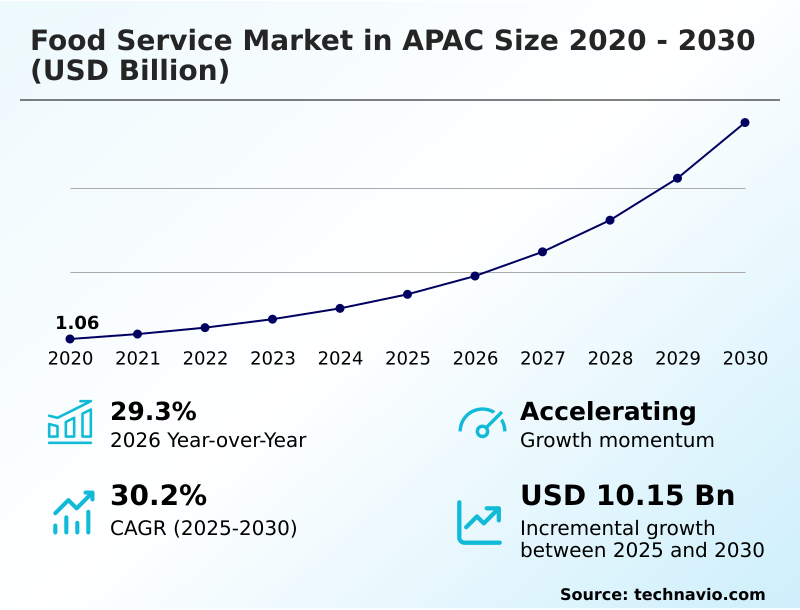
The apac food service market size is valued to increase by USD 10.15 billion, at a CAGR of 30.2% from 2025 to 2030. Increasing urban population spending power will drive the apac food service market.
Major Market Trends & Insights
- By Product - Food sales segment was valued at USD 1.86 billion in 2024
- By Type - Restaurants segment accounted for the largest market revenue share in 2024
Market Size & Forecast
- Market Opportunities: USD 12.79 billion
- Market Future Opportunities: USD 10.15 billion
- CAGR from 2025 to 2030 : 30.2%
Market Summary
- The food service market in APAC is characterized by rapid technological adoption and evolving consumer preferences. The integration of a tech driven coffee model and hyper local delivery service platforms is reshaping how businesses connect with customers. Establishments are focusing on experiential chinese hot pot dining and unique filipino style fast food to create memorable brand identities.
- Behind the scenes, centralized food processing and robust supply chain tracking systems are essential for maintaining quality and food safety standards across franchise networks. A key business scenario involves leveraging a digital loyalty program, integrated with self service kiosks and a cloud-based kitchen management system, to gather customer data.
- This data then informs dynamic menu engineering and virtual brand development, allowing companies to test new concepts with minimal risk. The push for halal malaysian fast food and other specialized offerings reflects a deep understanding of diverse regional demands, while institutional catering services adapt to corporate wellness trends.
What will be the Size of the APAC Food Service Market during the forecast period?
Get Key Insights on Market Forecast (PDF) Get Free Sample
How is the APAC Food Service Market Segmented?
The apac food service industry research report provides comprehensive data (region-wise segment analysis), with forecasts and estimates in "USD million" for the period 2026-2030, as well as historical data from 2020-2024 for the following segments.
- Product
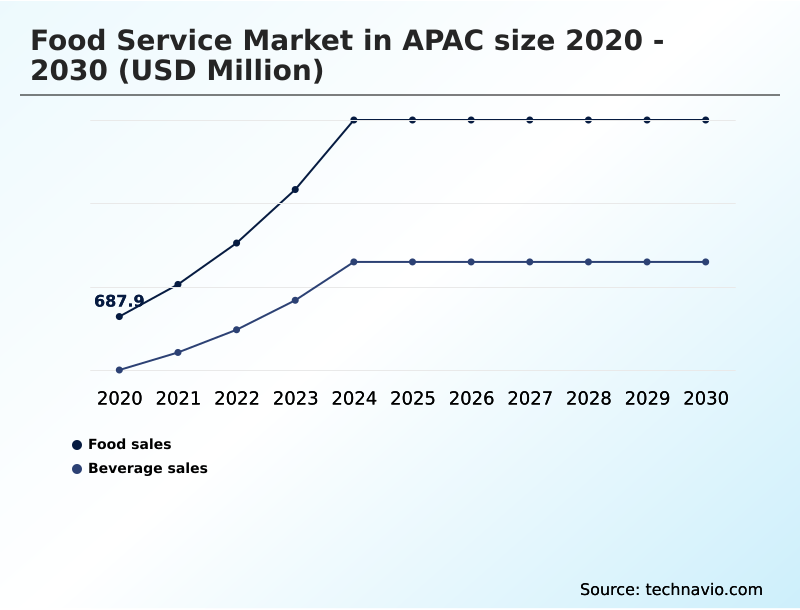
- Food sales
- Beverage sales
- Type
- Restaurants
- Delivery and takeaway
- Fast food
- Cafes and bars
- Others
- Price range
- Budget
- Mid-range
- Premium
- Geography
- APAC
- China
- Japan
- India
- APAC
By Product Insights
The food sales segment is estimated to witness significant growth during the forecast period.
The food sales segment is shaped by demand for diverse culinary options, with operators implementing a health centric menu personalization strategy to meet consumer needs.
The adoption of ghost kitchen operations and autonomous robotic service is transforming food preparation and delivery. Businesses leverage an ai driven recommendation engine, which has been shown to increase user engagement by 15%, to tailor offerings.
The successful on-demand food delivery model relies on efficient digital ordering infrastructure and seamless contactless payment systems. A casual dining experience is enhanced through food-tech innovations and smart kitchen appliances, while farm to table sourcing appeals to health-conscious consumers.
Effective contactless dining solutions are critical for maintaining customer trust and operational continuity in a competitive landscape.
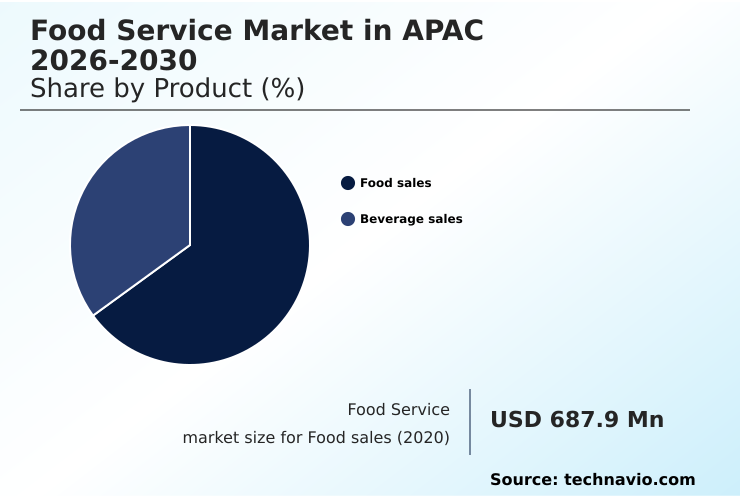
The Food sales segment was valued at USD 1.86 billion in 2024 and showed a gradual increase during the forecast period.
Market Dynamics
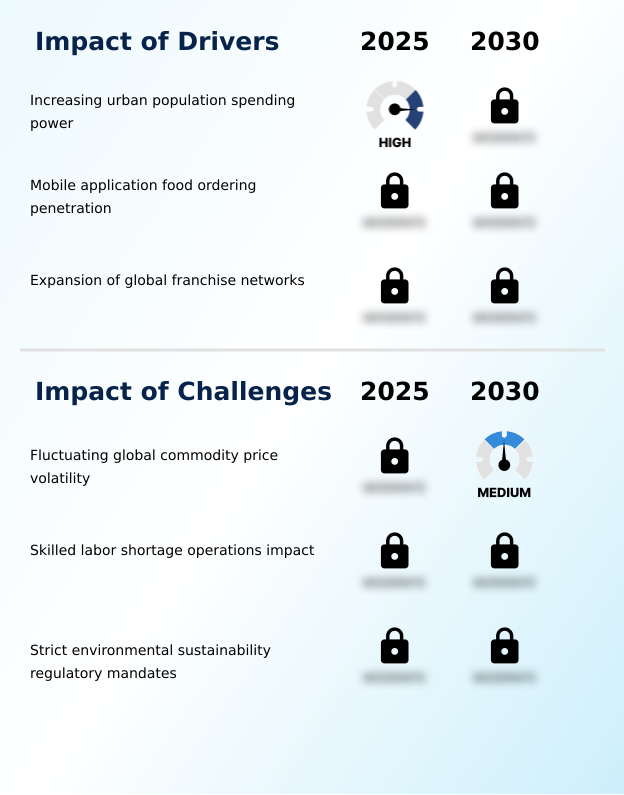
Our researchers analyzed the data with 2025 as the base year, along with the key drivers, trends, and challenges. A holistic analysis of drivers will help companies refine their marketing strategies to gain a competitive advantage.
- Strategic planning in the modern food service landscape requires a deep understanding of emerging operational models and technologies. Executive decisions now weigh the impact of AI on QSR efficiency against the high initial investment. For new ventures, evaluating the benefits of ghost kitchens for startups is a critical first step, as this model significantly lowers market entry barriers.
- A comparative analysis of robotic food prep vs manual labor often reveals long-term ROI in consistency and speed, despite upfront capital costs. Integrating loyalty programs with mobile ordering is no longer optional for brands seeking to enhance customer retention through personalization. Simultaneously, the rise of personalized nutrition in corporate catering creates new B2B opportunities.
- However, navigating the high cost of sustainable packaging for restaurants, which can increase expenses by over 35%, presents a significant challenge. Success hinges on optimizing delivery routes with AI and leveraging the role of data analytics in menu pricing. For customer-facing operations, implementing contactless payment in cafes has become a baseline expectation.
- Behind the scenes, automating inventory for food cost control and using customer data for menu personalization are key to profitability. Furthermore, reducing food waste with predictive analytics and addressing last mile delivery challenges and solutions are crucial for sustainable growth.
- Ultimately, developing health-centric menus for competitive advantage requires a cohesive strategy that includes a modern cloud kitchen technology stack integration and a clear understanding of the ROI of robotic service in restaurants. This holistic approach drives the digital transformation in casual dining, builds supply chain transparency for brand trust, and helps in managing commodity price volatility in food service.
What are the key market drivers leading to the rise in the adoption of APAC Food Service Industry?
- A key market driver is the increasing spending power of the urban population, which is reshaping regional consumption patterns and fueling demand for convenient food services.
- Market growth is propelled by powerful demographic and technological drivers. The high penetration of mobile application ordering, reaching over 70% in some urban centers, has fundamentally altered consumer behavior, making it a primary revenue channel.
- This is supported by the widespread availability of digital menu integration and qr code-based ordering systems.
- The franchise network expansion model continues to prove effective, with franchised outlets showing a 25% higher survival rate than independent stores over a five-year period.
- This success is partly due to the ability of established brands to implement a sophisticated tech driven coffee model and centralized food processing.
- Furthermore, localized menu adaptation and robust customer relationship management (crm) are critical for both global chains offering filipino style fast food and regional players providing experiential chinese hot pot dining, ensuring relevance in a diverse marketplace.
What are the market trends shaping the APAC Food Service Industry?
- A significant market trend is the rise of specialized ghost kitchen operations in Asia. These delivery-only hubs are engineered for hyper-efficiency and localized menu offerings.
- Key market trends are reshaping operational models, with a focus on efficiency and personalization. The rise of subscription based meal plans and dark kitchen logistics supports the expansion of delivery-centric businesses. Automated cooking systems are moving from niche applications to mainstream quick service restaurant (qsr) settings, enhancing consistency and speed.
- A pilot program using autonomous robotic service for last-mile meal delivery demonstrated the potential to navigate complex urban environments. These food-tech innovations are complemented by the use of cloud-based kitchen management systems and food delivery aggregators to streamline order fulfillment. Predictive demand forecasting helps manage inventory for hyper local delivery service operations, while smart kitchen appliances improve energy efficiency.
- The emphasis on a superior supply chain tracking system and food safety standards ensures quality from production to consumption, building consumer trust in an increasingly digital marketplace.
What challenges does the APAC Food Service Industry face during its growth?
- A primary challenge affecting industry growth is the volatility of fluctuating global commodity prices, which directly impacts operational profitability.
- Operators face significant challenges from operational costs and regulatory pressures. The volatility of global commodity prices, with staples like palm oil experiencing 20% price swings in a single six-month period, strains profitability. This forces difficult decisions regarding menu pricing optimization and supply chain logistics optimization.
- Compounding this is a persistent skilled labor shortage, leading to a 15% vacancy rate in the sector and driving the adoption of robotic process automation (rpa) to maintain service levels. Furthermore, stringent environmental mandates requiring a shift to sustainable packaging solutions can increase packaging costs by up to 40%.
- Businesses must also invest in food waste reduction technology and sustainable sourcing practices to meet both regulatory requirements and consumer expectations. These factors necessitate advanced automated inventory management and a focus on operational efficiency metrics to protect margins.
Exclusive Technavio Analysis on Customer Landscape
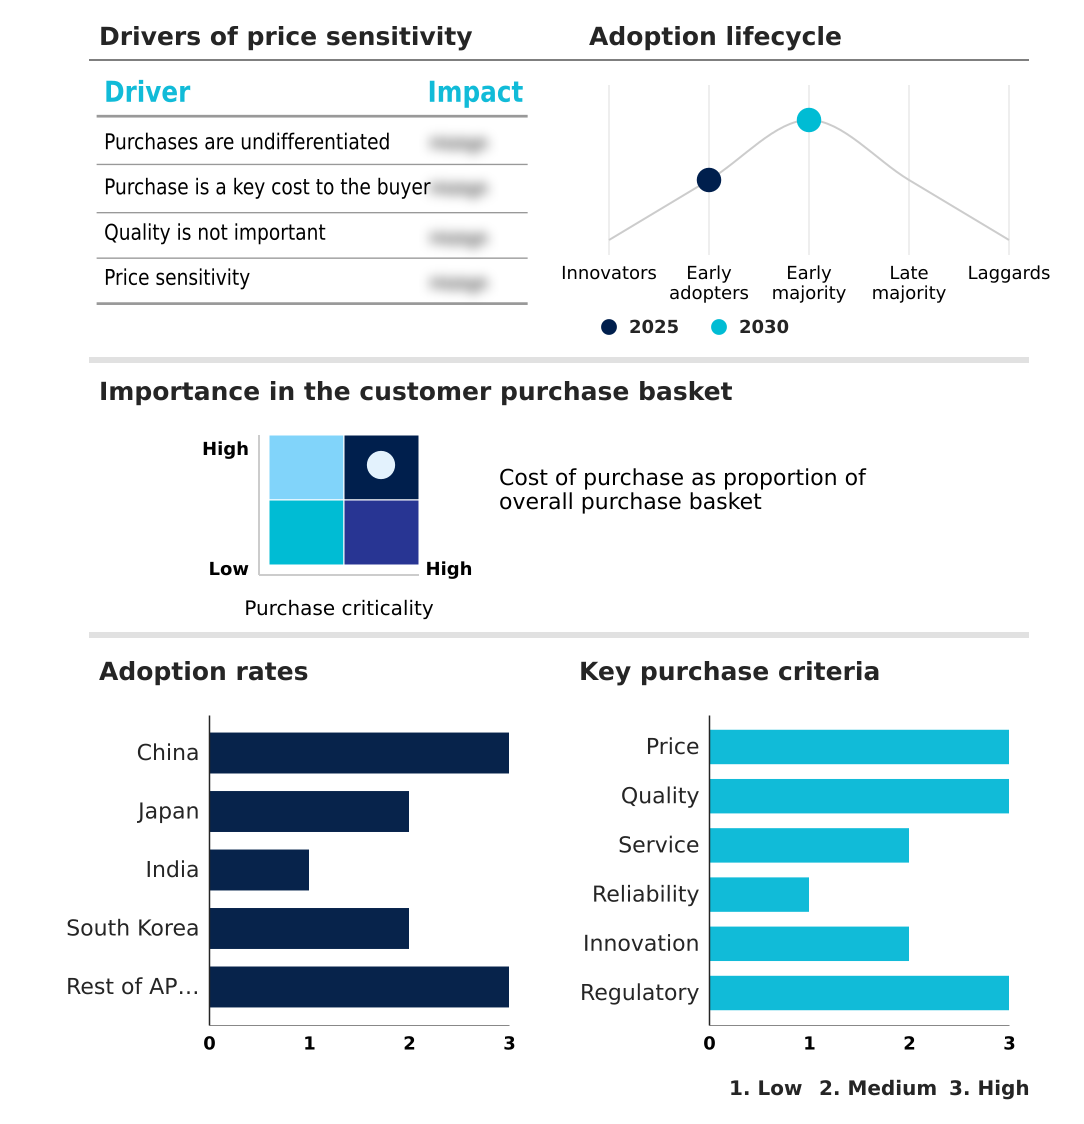
The apac food service market forecasting report includes the adoption lifecycle of the market, covering from the innovator’s stage to the laggard’s stage. It focuses on adoption rates in different regions based on penetration. Furthermore, the apac food service market report also includes key purchase criteria and drivers of price sensitivity to help companies evaluate and develop their market growth analysis strategies.
Customer Landscape of APAC Food Service Industry
Competitive Landscape
Companies are implementing various strategies, such as strategic alliances, apac food service market forecast, partnerships, mergers and acquisitions, geographical expansion, and product/service launches, to enhance their presence in the industry.
Devyani International Ltd - Operations center on a highly digital ordering ecosystem, specializing in streamlined pizza delivery and carryout services for enhanced customer convenience.
The industry research and growth report includes detailed analyses of the competitive landscape of the market and information about key companies, including:
- Devyani International Ltd
- Dominos Pizza Inc.
- Fairwood Holdings Ltd
- Haidilao International Holding
- HokBen
- Hot Palette Pte. Ltd.
- Jollibee Foods Corp
- JUBILANT FOODWORKS LTD.
- Luckin Coffee Inc.
- Marrybrown Sdn. Bhd.
- Maxim Food Co. Ltd
- McDonald Corp.
- MOS Food Services Inc.
- Restaurant Brands Inc.
- Sodexo SA
- Starbucks Corp.
- The Subway Group
- Wow Momo Foods Pvt. Ltd.
- YUM Brands Inc.
- Yum China Holdings Inc.
Qualitative and quantitative analysis of companies has been conducted to help clients understand the wider business environment as well as the strengths and weaknesses of key industry players. Data is qualitatively analyzed to categorize companies as pure play, category-focused, industry-focused, and diversified; it is quantitatively analyzed to categorize companies as dominant, leading, strong, tentative, and weak.
Recent Development and News in Apac food service market
- In October 2024, Jollibee Foods Corporation intensified its transition to sustainable packaging across its global outlets to comply with new environmental laws, necessitating an overhaul of its supply chain for containers and utensils.
- In January 2025, MOS Food Services Inc introduced a new line of healthy burger alternatives based on consumer feedback to cater to the growing trend of health-consciousness among diners.
- In March 2025, Sate Kajang Haji Samuri upgraded its supply chain tracking system to ensure the freshness and quality of its signature meat products from procurement to point of sale.
- In May 2025, The Wendys Co entered into a new franchise agreement to expand its presence in the Southeast Asian market, targeting high-growth urban areas.
Dive into Technavio’s robust research methodology, blending expert interviews, extensive data synthesis, and validated models for unparalleled APAC Food Service Market insights. See full methodology.
| Market Scope | |
|---|---|
| Page number | 215 |
| Base year | 2025 |
| Historic period | 2020-2024 |
| Forecast period | 2026-2030 |
| Growth momentum & CAGR | Accelerate at a CAGR of 30.2% |
| Market growth 2026-2030 | USD 10154.0 million |
| Market structure | Fragmented |
| YoY growth 2025-2026(%) | 29.3% |
| Key countries | China, Japan, India, South Korea and Rest of APAC |
| Competitive landscape | Leading Companies, Market Positioning of Companies, Competitive Strategies, and Industry Risks |
Research Analyst Overview
- The food service market in APAC is undergoing a significant transformation, driven by technology and shifting consumer values. A key factor is that urban consumers spend approximately 30% more on dining out than their rural counterparts, fueling demand for convenient and sophisticated options.
- This has accelerated the adoption of ghost kitchen operations, autonomous robotic service, and a tech driven coffee model. Boardroom decisions increasingly focus on implementing a digital ordering infrastructure that supports health centric menu personalization and a seamless digital loyalty program. Success depends on a robust cloud-based kitchen management system for dynamic menu engineering and virtual brand development.
- Automated cooking systems and robotic assembly lines are becoming critical for quick service restaurant (qsr) efficiency. Meanwhile, innovations like experiential chinese hot pot dining and unique filipino style fast food are balanced with the need for centralized food processing, contactless payment systems, and strict food safety standards.
- Operators are also leveraging a hyper local delivery service, self service kiosks, and a comprehensive supply chain tracking system to manage everything from halal malaysian fast food to institutional catering services and automated beverage stations.
- The integration of biometric data, alternative protein sources, and clean label ingredients through ai-powered meal suggestions is defining the next wave of competition, alongside sustainable packaging solutions and contactless interaction technology that supports customized dietary requirements and functional food integration, including more plant-based meal options.
What are the Key Data Covered in this APAC Food Service Market Research and Growth Report?
-
What is the expected growth of the APAC Food Service Market between 2026 and 2030?
-
USD 10.15 billion, at a CAGR of 30.2%
-
-
What segmentation does the market report cover?
-
The report is segmented by Product (Food sales, and Beverage sales), Type (Restaurants, Delivery and takeaway, Fast food, Cafes and bars, and Others), Price Range (Budget, Mid-range, and Premium) and Geography (APAC)
-
-
Which regions are analyzed in the report?
-
APAC
-
-
What are the key growth drivers and market challenges?
-
Increasing urban population spending power, Fluctuating global commodity price volatility
-
-
Who are the major players in the APAC Food Service Market?
-
Devyani International Ltd, Dominos Pizza Inc., Fairwood Holdings Ltd, Haidilao International Holding, HokBen, Hot Palette Pte. Ltd., Jollibee Foods Corp, JUBILANT FOODWORKS LTD., Luckin Coffee Inc., Marrybrown Sdn. Bhd., Maxim Food Co. Ltd, McDonald Corp., MOS Food Services Inc., Restaurant Brands Inc., Sodexo SA, Starbucks Corp., The Subway Group, Wow Momo Foods Pvt. Ltd., YUM Brands Inc. and Yum China Holdings Inc.
-
Market Research Insights
- The market's dynamism is fueled by a strategic focus on customer data analytics and franchise network expansion. Mobile application ordering has become a primary channel, where platforms that improve the casual dining experience see higher retention. Operators that master menu pricing optimization and implement effective customer relationship management (crm) systems can achieve a significant competitive edge.
- For instance, franchised outlets demonstrate a 25% higher survival rate over five years compared to independent startups, underscoring the value of established operational models. Furthermore, localized menu adaptation is critical for success, with AI-driven recommendation engines increasing user engagement by as much as 15%. This highlights the direct link between technological integration and measurable business outcomes in the region.
We can help! Our analysts can customize this apac food service market research report to meet your requirements.
 RIA -
RIA - 
