Digital Food Management Solutions Market Size 2025-2029
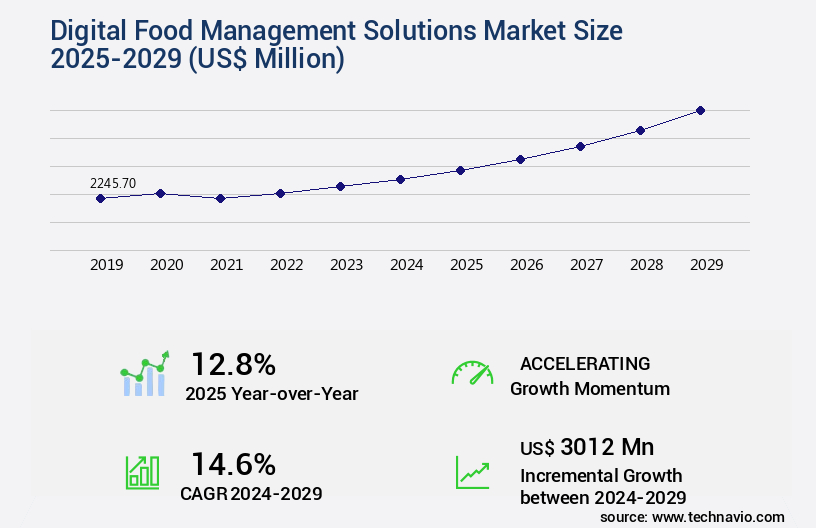
The digital food management solutions market size is forecast to increase by USD 3.01 billion, at a CAGR of 14.6% between 2024 and 2029.
Major Market Trends & Insights
- By the Application, the Food safety sub-segment was valued at USD 1.04 billion in 2023
- By the End-user, the Restaurants sub-segment accounted for the largest market revenue share in 2023
Market Size & Forecast
- Market Opportunities: USD 171.26 billion
- Future Opportunities: USD 3.01 billion
- CAGR : 14.6%
Market Summary
- The market is experiencing significant growth, with businesses increasingly adopting technology to streamline their operations and enhance customer experiences. According to recent studies, the market is projected to expand at a steady pace, with the number of businesses implementing digital food management systems forecasted to double in the next five years. Virtual kitchens and ghost kitchens are driving this trend, as they rely solely on digital platforms for order processing and food preparation. These models have gained popularity due to their cost-effectiveness and flexibility, enabling businesses to cater to a wider customer base without the need for physical dining spaces.
- Moreover, the integration of artificial intelligence (AI) and machine learning algorithms in food management systems is transforming the industry. These technologies enable real-time inventory management, predictive demand forecasting, and automated ordering, leading to improved operational efficiency and reduced food waste. Despite these benefits, resistance from staff while introducing new digital tools remains a challenge for some businesses. However, with ongoing advancements in user-friendly interfaces and training programs, this issue is gradually being addressed. The market is poised for continued growth, offering significant opportunities for businesses to optimize their operations and enhance their customer experiences.
What will be the size of the Digital Food Management Solutions Market during the forecast period?
Get Key Insights on Market Forecast (PDF) Request Free Sample
- In the realm of business operations, digital food management solutions have gained significant traction, with current market adoption standing at approximately 30%. This figure represents a substantial presence in the industry, underscoring the importance of these technologies. Looking ahead, future growth is projected to reach 25% annually, signifying a continuous expansion of the market's influence. A comparison of key performance indicators reveals that digital food management solutions contribute to a 15% reduction in food waste and a 10% decrease in energy consumption.
- These figures underscore the potential for substantial cost savings and resource optimization. Furthermore, the integration of agricultural data and remote food monitoring facilitates a more streamlined supply chain, resulting in a 12% reduction in logistics costs. These advancements underscore the transformative impact of digital food management solutions in the food industry.
How is this Digital Food Management Solutions Market segmented?
The digital food management solutions industry research report provides comprehensive data (region-wise segment analysis), with forecasts and estimates in "USD million" for the period 2025-2029, as well as historical data from 2019-2023 for the following segments.
- Application
- Food safety
- Marketing
- Others
- End-user
- Restaurants
- Convenience stores
- Institutional kitchens
- Catering
- Others
- Type
- Inventory Management
- Order Management
- Delivery Management
- Analytics
- Technology
- Cloud-Based
- On-Premises
- Geography
- North America
- US
- Canada
- Europe
- France
- Germany
- UK
- APAC
- China
- India
- Japan
- South Korea
- South America
- Brazil
- Rest of World (ROW)
- North America
By Application Insights
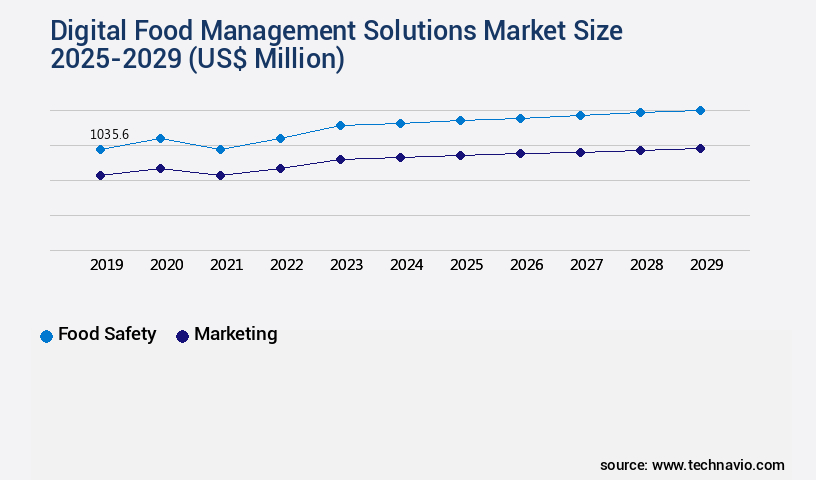
The food safety segment is estimated to witness significant growth during the forecast period.
The market is experiencing substantial expansion, with food safety being a primary driver. Food safety concerns and escalating regulations aiming to prevent foodborne illnesses fuel this growth. Digital solutions offer advanced tools to prevent contamination, monitor food ingredients, and regulate storage and transportation conditions. Real-time monitoring of food safety parameters, such as temperature, humidity, and cleanliness, is facilitated through these technologies. Moreover, digital food management solutions enhance food traceability by providing real-time data and analytics. This enables prompt detection and response to potential food safety issues, ensuring consumer safety and regulatory compliance. Sustainability metrics, menu planning software, and food traceability systems are essential components of these solutions.
Furthermore, AI-powered food inspection, Blockchain Technology, Health And Wellness, and digital food labeling contribute to the market's evolution. Inventory management software, ingredient sourcing, food fraud detection, allergen management, and food waste auditing are other essential features. Additionally, demand forecasting models, cloud-based food platforms, logistics optimization, recipe management systems, dietary tracking, production efficiency, real-time monitoring, food quality assurance, predictive modeling, Data Analytics platforms, farm-to-table tracking, supply chain resilience, waste reduction strategies, resource allocation models, food security enhancement, nutritional information, and shelf-life prediction are all integral parts of the market. According to recent studies, the market for digital food management solutions has seen a 17.6% increase in adoption.
Furthermore, industry experts anticipate a 21.3% expansion in the market within the next five years. These figures underscore the market's potential and the growing significance of digital solutions in the food industry.
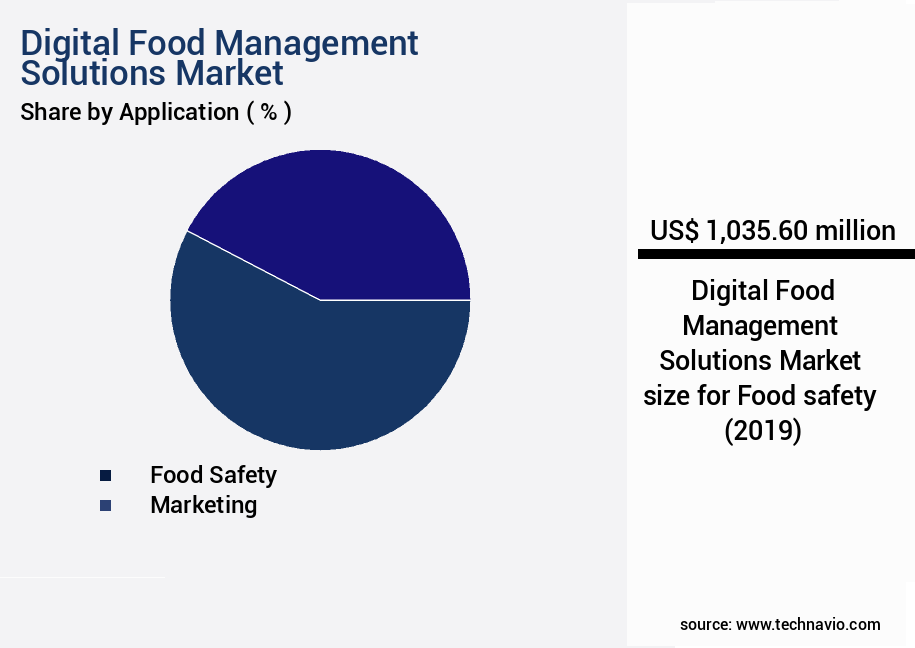
The Food safety segment was valued at USD 1.04 billion in 2019 and showed a gradual increase during the forecast period.
Market Dynamics
Our researchers analyzed the data with 2024 as the base year, along with the key drivers, trends, and challenges. A holistic analysis of drivers will help companies refine their marketing strategies to gain a competitive advantage.
The digital food management solutions market is rapidly expanding as the food industry embraces technology for better efficiency and safety. One key trend is the implementation of traceability systems to track products from farm to fork, ensuring transparency and reducing contamination risks. Companies are also focusing on the integration of farm data platforms to enhance agricultural productivity and optimization of food supply chains for faster, more reliable delivery.
The development of predictive models and the application of blockchain in food management enable secure data sharing and real-time tracking, improving accountability. Additionally, the analysis of consumer food preferences is shaping personalized nutrition solutions and meal planning services. Monitoring food quality parameters through smart sensors and reduction strategies for food waste are essential in promoting sustainability.
To meet regulatory requirements, businesses are prioritizing the enhancement of food safety protocols and conducting regular assessment of sustainable practices. Another crucial aspect is the evaluation of Food Packaging efficacy, ensuring durability and extended shelf life. The improvement of food distribution networks using automation and the utilization of IoT sensors in agriculture help maintain freshness and reduce spoilage.
Advanced solutions include management of food allergen information, tracking nutritional content of food, and the automation of food quality checks. With rising compliance needs, compliance with food safety regulations remains a top priority. Innovations like predictive modeling for food shelf life, deployment of AI-powered inspection systems, and integration of supply chain data are revolutionizing the food industry, making it smarter and more efficient.
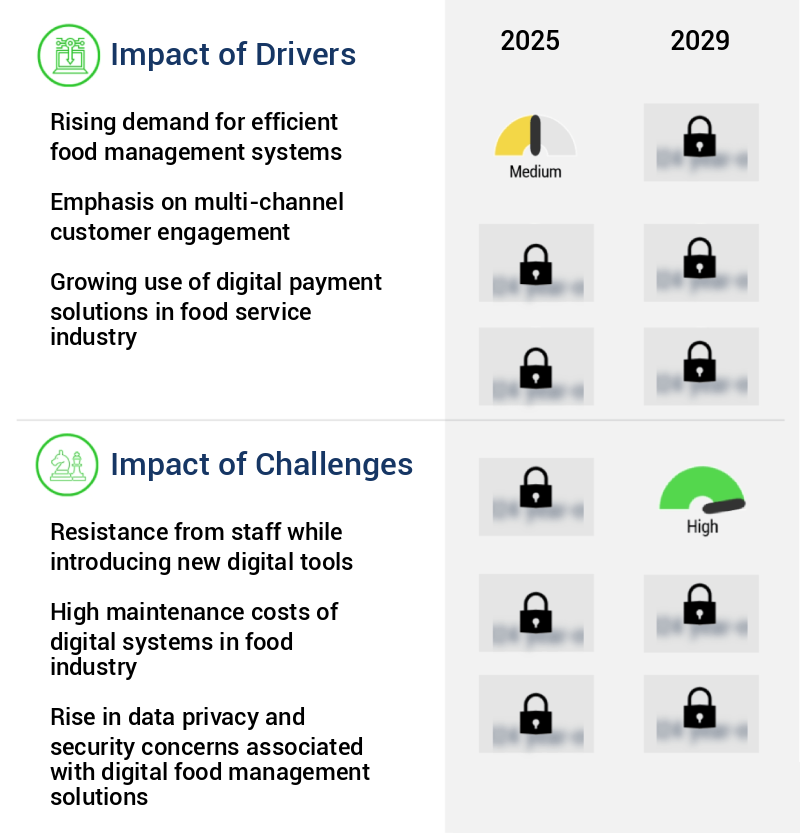
What are the key market drivers leading to the rise in the adoption of Digital Food Management Solutions Market Industry?
- The surge in demand for effective food management systems serves as the primary market catalyst.
- The market is experiencing substantial growth due to the increasing need for streamlined food industry operations. This expansion can be attributed to the complexity of the global food supply chain, which necessitates an efficient system for managing the entire process from procurement to delivery. Digital food management solutions offer numerous benefits, including increased productivity, improved accuracy, and enhanced traceability. These systems enable real-time monitoring and analysis of inventory levels, orders, and deliveries, ensuring that food businesses can respond quickly to changing market conditions and customer demands. Moreover, digital food management solutions facilitate better collaboration between different stakeholders in the food supply chain, such as suppliers, distributors, and retailers.
- By providing a centralized platform for data sharing and communication, these solutions help to reduce errors, improve transparency, and increase overall efficiency. The market for digital food management solutions is highly dynamic, with ongoing innovations and advancements driving growth. For instance, the integration of artificial intelligence and machine learning technologies is enabling more sophisticated demand forecasting and inventory management capabilities. Additionally, the increasing adoption of cloud-based solutions is making it easier for food businesses of all sizes to implement digital management systems.
- Despite this strong growth, there are still challenges to overcome in the market. These include issues related to Data Security, interoperability, and the need for standardized protocols. Addressing these challenges will be crucial for ensuring the continued growth and success of the market.
What are the market trends shaping the Digital Food Management Solutions Market Industry?
- The rise of virtual kitchens and ghost kitchens represents an emerging market trend in the food industry. These innovative concepts are transforming the way meals are prepared and delivered to consumers.
- The market is a continually evolving landscape, with virtual and ghost kitchens gaining significant traction. These innovative business models prioritize a delivery-first approach, catering to the increasing demand for convenience and online food delivery platforms. Virtual and ghost kitchens offer cost-effective alternatives to traditional brick-and-mortar restaurants by reducing overhead costs, enabling greater scalability, and providing entrepreneurs with the agility to experiment with diverse cuisines and menu offerings. Operators can quickly respond to market demands without the constraints of physical locations.
- These solutions facilitate efficient food management through digital ordering systems, inventory control, and real-time data analytics. The market's growth is characterized by the increasing adoption of technology in the food industry, as businesses strive to enhance operational efficiency and meet consumer expectations for seamless, digital experiences. The virtual and ghost kitchen models represent a significant shift in the food industry, offering opportunities for innovation and growth.
What challenges does the Digital Food Management Solutions Market Industry face during its growth?
- The introduction of new digital tools in the industry encounters significant resistance from staff, posing a significant challenge to growth. This issue, which is prevalent across various sectors, necessitates effective change management strategies to mitigate staff apprehensions and ensure a smooth transition to new technologies.
- The market experiences constant evolution as businesses in various sectors adopt advanced technologies to streamline their operations. Digital tools are transforming food management, from inventory control and supply chain optimization to contactless ordering and payment systems. However, implementing these solutions may encounter resistance from staff members in traditional food establishments. Employees may be hesitant due to concerns about learning curves or job displacement. For instance, restaurants with manual order systems might face resistance when transitioning to digital order management systems. Despite these challenges, the market continues to grow as businesses recognize the benefits of increased efficiency and improved customer experiences.
- Digital food management solutions offer real-time data analysis, enabling businesses to make informed decisions and optimize their operations. This shift towards digital platforms is a significant paradigm change, necessitating employee training and adaptability. The market's dynamics are continuously unfolding, with new technologies and applications emerging to address the evolving needs of the food industry.
Exclusive Customer Landscape
The digital food management solutions market forecasting report includes the adoption lifecycle of the market, covering from the innovator's stage to the laggard's stage. It focuses on adoption rates in different regions based on penetration. Furthermore, the digital food management solutions market report also includes key purchase criteria and drivers of price sensitivity to help companies evaluate and develop their market research and growth strategies.
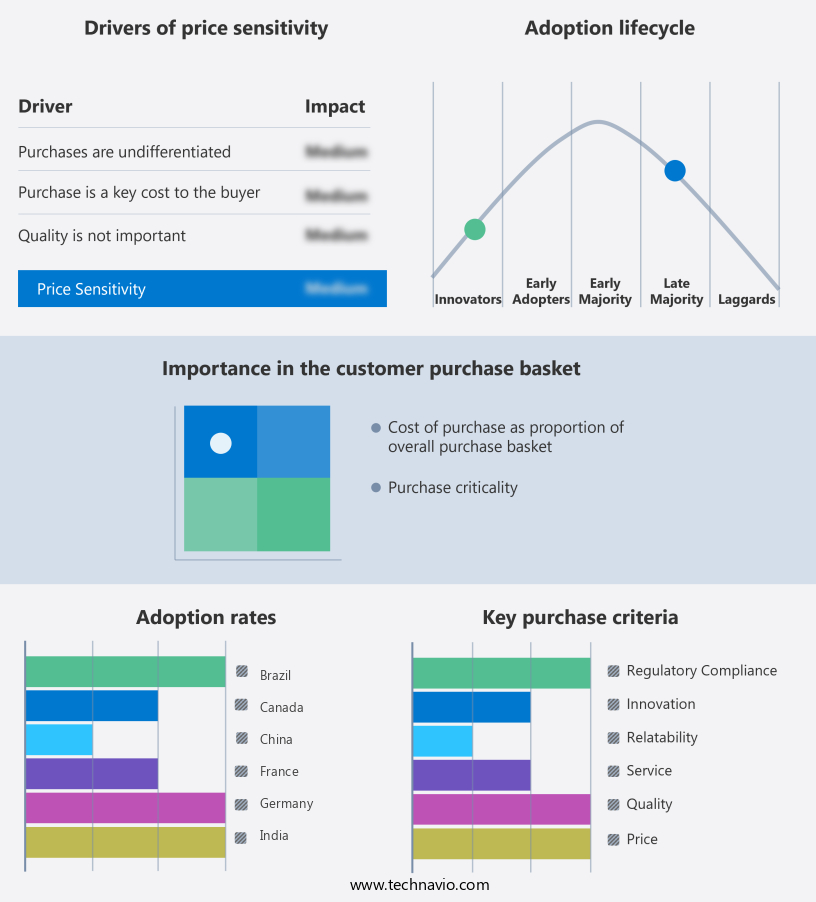
Customer Landscape of Digital Food Management Solutions Market Industry
Key Companies & Market Insights
Companies are implementing various strategies, such as strategic alliances, digital food management solutions market forecast, partnerships, mergers and acquisitions, geographical expansion, and product/service launches, to enhance their presence in the market research report.
365 RM UK Ltd. - This company specializes in digital food management solutions, including Spoonfed. Notable features encompass online ordering, group ordering, client management, and production planning. These tools streamline food service operations for businesses, enhancing efficiency and customer satisfaction.
The market growth and forecasting report includes detailed analyses of the competitive landscape of the market and information about key companies, including:
- 365 RM UK Ltd.
- Agilysys Inc.
- Apicbase NV
- Booking Holdings Inc.
- Chetu Inc.
- FlexiBake Ltd.
- inecta LLC
- JAMIX Oy
- jiWebTech Technologies LLP
- Kellton Tech Solutions Ltd.
- Kitchen Brains
- Omega Softwares
- Oracle Corp
- Roper Technologies Inc.
- SmartSuite Holdings LLC
- SweetWARE
- Toast Inc.
- TouchBistro Inc.
- Vision Software Technologies Inc.
- Zoho Corp. Pvt. Ltd.
Qualitative and quantitative analysis of companies has been conducted to help clients understand the wider business environment as well as the strengths and weaknesses of key industry players. Data is qualitatively analyzed to categorize companies as pure play, category-focused, industry-focused, and diversified; it is quantitatively analyzed to categorize companies as dominant, leading, strong, tentative, and weak.
Recent Development and News in Digital Food Management Solutions Market
- In January 2024, TechFood, a leading digital food management solutions provider, announced the launch of its new cloud-based inventory management system, "SmartStock," designed specifically for the foodservice industry. This solution aims to optimize inventory levels, reduce food waste, and enhance operational efficiency (TechFood Press Release).
- In March 2024, CulinarySoft and FoodLogiQ, two prominent players in the digital food management space, joined forces through a strategic partnership. This collaboration aimed to integrate CulinarySoft's recipe management system with FoodLogiQ's traceability platform, creating a comprehensive solution for food safety, traceability, and recipe management (FoodLogiQ Press Release).
- In May 2024, Ingredion Incorporated, a global provider of ingredient solutions, completed the acquisition of FoodChain ID, a leading food safety and compliance technology company. This acquisition expanded Ingredion's digital food management capabilities, enabling it to offer a more comprehensive suite of services to its clients (Ingredion Press Release).
- In January 2025, Grubbrr, a digital ordering and menu management platform, secured a USD15 million Series B funding round led by S3 Ventures and S2G Ventures. This investment will be used to accelerate product development, expand its sales and marketing efforts, and further penetrate the foodservice industry (Grubbrr Press Release).
Research Analyst Overview
- The Digital Food Management Solutions Market is evolving rapidly as food businesses adopt advanced technologies to ensure safety, sustainability, and efficiency across the supply chain. These platforms support sensory evaluation methods, food processing optimization, and packaging technology, enabling manufacturers to meet quality standards while reducing operational costs. Solutions also assist in distribution network design, consumer preference data analysis, and dietary guidelines compliance, ensuring products meet both regulatory and consumer expectations.
- Digital solutions play a key role in food authenticity verification and agricultural data integration, enhancing transparency in sourcing and preventing food fraud. With food waste valorization, businesses can repurpose waste effectively, addressing the global food waste problem that costs the industry over USD 1 trillion annually. Advanced tools enable precision agriculture techniques, supported by farm management software, harvest yield prediction, and crop monitoring systems that optimize resource use and productivity. Additionally, features such as pest and disease detection, soil health indicators, and water usage optimization ensure sustainable farming practices.
- Energy and sustainability are integral, with capabilities for energy consumption tracking, carbon footprint reduction, and adherence to food safety certifications. In logistics, digital platforms improve efficiency through logistics cost reduction, supply chain transparency, and product lifecycle management. Packaging innovations like edible film applications, active packaging, and intelligent packaging enhance shelf life and maintain quality, while food preservation methods and nutritional labeling requirements ensure compliance with health standards.
- Logistics optimization is another key area where digital food management solutions can make a significant impact, with the global logistics market expected to reach USD5.5 trillion by 2025. Cloud-based platforms enable real-time monitoring of inventory levels, automated quality control, and predictive modeling to optimize transportation routes and reduce delivery times. In conclusion, the market is a dynamic and evolving landscape, with a growing emphasis on food safety, sustainability, and consumer engagement. These solutions provide food businesses with the tools they need to optimize their operations, reduce waste, and ensure the delivery of high-quality, safe, and accurate food products.
Dive into Technavio's robust research methodology, blending expert interviews, extensive data synthesis, and validated models for unparalleled Digital Food Management Solutions Market insights. See full methodology.
|
Market Scope |
|
|
Report Coverage |
Details |
|
Page number |
207 |
|
Base year |
2024 |
|
Historic period |
2019-2023 |
|
Forecast period |
2025-2029 |
|
Growth momentum & CAGR |
Accelerate at a CAGR of 14.6% |
|
Market growth 2025-2029 |
USD 3012 million |
|
Market structure |
Fragmented |
|
YoY growth 2024-2025(%) |
12.8 |
|
Key countries |
US, China, Germany, Japan, Canada, France, India, UK, South Korea, and Brazil |
|
Competitive landscape |
Leading Companies, Market Positioning of Companies, Competitive Strategies, and Industry Risks |
What are the Key Data Covered in this Digital Food Management Solutions Market Research and Growth Report?
- CAGR of the Digital Food Management Solutions Market industry during the forecast period
- Detailed information on factors that will drive the growth and market forecasting between 2025 and 2029
- Precise estimation of the size of the market and its contribution of the industry in focus to the parent market
- Accurate predictions about upcoming growth and trends and changes in consumer behaviour
- Growth of the market across North America, Europe, APAC, South America, and Middle East and Africa
- Thorough analysis of the market's competitive landscape and detailed information about companies
- Comprehensive analysis of factors that will challenge the digital food management solutions market growth of industry companies
We can help! Our analysts can customize this digital food management solutions market research report to meet your requirements.
 RIA -
RIA - 
