Food Starch Market Analysis, Size, and Forecast 2024-2028: North America (Canada and Mexico), Europe (France, Germany, and UK), Middle East and Africa (UAE), APAC (China, India, Indonesia, Japan, Malaysia, South Korea, and Thailand), South America (Brazil), and Rest of World (ROW)

Food Starch Market Analysis, Size, and Forecast 2024-2028:
North America (Canada and Mexico), Europe (France, Germany, and UK), Middle East and Africa (UAE), APAC (China, India, Indonesia, Japan, Malaysia, South Korea, and Thailand), South America (Brazil), and Rest of World (ROW)

Published: Jul 2024 141 Pages SKU: IRTNTR73969

Market Overview at a Glance

$4.84 B
Market Opportunity
4.5%
CAGR
4.23
YoY growth 2023-2024(%)

Food Starch Market Size 2024-2028

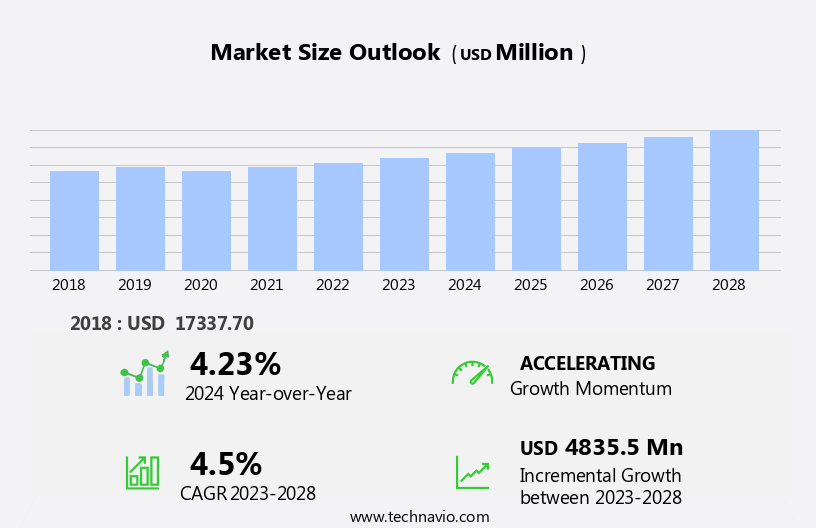
The food starch market size is forecast to increase by USD 4.84 billion, at a CAGR of 4.5% between 2023 and 2028.

  • The market is driven by the growing preference for plant-based alternatives in various food applications, particularly in the areas of thickening, gelling, and emulsifying agents. This shift away from animal-derived substitutes is a significant trend, as consumers increasingly seek out vegetarian and vegan options. Additionally, the rise of online retail sales in the food industry is expanding the market's reach and accessibility, enabling consumers to purchase food starch products more conveniently. However, the market faces challenges from stringent government regulations.
  • Compliance with these regulations can increase production costs and limit the market's growth potential. Companies must navigate these regulatory hurdles while maintaining product quality and safety, ensuring they remain competitive in the marketplace. To capitalize on opportunities and effectively manage these challenges, businesses must stay informed of regulatory changes and invest in research and development to create innovative, cost-effective solutions.

What will be the Size of the Food Starch Market during the forecast period?

Food Starch Market Size

Explore in-depth regional segment analysis with market size data - historical 2018-2022 and forecasts 2024-2028 - in the full report.  
Request Free Sample

The market continues to evolve, driven by advancements in starch technology and its diverse applications across various sectors. Starch syrups production remains a significant area of focus, with the ongoing development of rapid viscosity analyzers to ensure optimal starch paste stability. The granule structure of native starch plays a crucial role in its functionality, with modifications such as starch derivatization methods and starch oxidation impacting its properties. The resistant starch content of modified starches is a key consideration, as it influences digestibility analysis and nutritional value. Starch paste rheology, gelatinization temperature, and crystallinity degree are essential factors in determining starch hydrolysis process and thermal stability.

Starch molecular weight and dextrose equivalent (DE) are critical parameters in starch hydrolysis, with high amylose starch and waxy maize starch exhibiting unique properties. Starch-based film formation, amylase enzyme activity, and starch crosslinking chemistry are also areas of ongoing research. Maltodextrin properties, solubility index, and viscosity measurement are important considerations in food applications, while texture profile analysis and starch processing technology continue to advance. The ongoing exploration of starch derivatization methods, starch retrogradation kinetics, and native starch properties underscores the dynamic nature of this market.

How is this Food Starch Industry segmented?

The food starch industry research report provides comprehensive data (region-wise segment analysis), with forecasts and estimates in "USD million" for the period 2024-2028, as well as historical data from 2018-2022 for the following segments.

  • Type
    • Maize
    • Wheat
    • Others
  • Product Type
    • Native Starch
    • Modified Starch
    • Starch Derivatives
  • Application
    • Food and Beverage (Bakery, Confectionery, Beverages)
    • Industrial
    • Pharmaceuticals
  • Geography
    • North America
      • US
      • Canada
      • Mexico
    • Europe
      • France
      • Germany
      • UK
    • Middle East and Africa
      • UAE
    • APAC
      • China
      • India
      • Indonesia
      • Japan
      • Malaysia
      • South Korea
      • Thailand
    • South America
      • Brazil
    • Rest of World (ROW)

By Type Insights

The maize segment is estimated to witness significant growth during the forecast period.

Maize starch, derived from the kernels through processes such as steeping, grinding, purifying, and drying, holds a significant market presence due to its 70% starch content. This versatile ingredient is extensively utilized in various industries, including paper, textile, and pharmaceuticals. In the paper industry, maize starch enhances bonding strength in paper and corrugated boxes due to its adhesive properties. The textile industry employs it to soften fabric and impart required stiffness to clothes. In pharmaceuticals, maize starch functions as a filler, humectant, binder, and disintegrant. Its applications extend to hard capsules, swallowable tablets, granules, blends, pellet premixes, and other pharmaceutical drugs.

Starch syrups, produced from corn, wheat, rice, or potato, are essential ingredients in numerous food applications. Their viscosity and sweetness levels are controlled through processes like hydrolysis and crystallization. A rapid viscosity analyzer is used to ensure optimal starch syrup production, maintaining the desired consistency and quality. Starch paste stability is crucial in various applications, including food and pharmaceuticals. Starch granule structure, moisture content, molecular weight, and dextrose equivalent (de) are significant factors influencing paste stability. Modified starch types, such as high amylose starch, are used to improve paste stability and functionality. Starch paste rheology plays a vital role in food applications, affecting texture and mouthfeel.

Resistant starch content, determined through starch hydrolysis processes, is essential in food manufacturing for producing low glycemic index foods. Starch derivatization methods, like acetylation, phosphorylation, and crosslinking, are used to enhance starch properties, such as thermal stability and solubility. Starch oxidation impact on gelatinization temperature and crystallinity degree is a critical consideration in food processing. Starch digestibility analysis and retrogradation kinetics are essential in understanding native starch properties and optimizing food processing techniques. Amylose content, amylopectin branching ratio, and maltodextrin properties are crucial factors in determining starch functionality. Waxy maize starch, with its high amylose content, is used in starch-based film formation for Food Packaging applications.

Texture profile analysis is used to evaluate the physical properties of starch-based products. Starch processing technology plays a significant role in optimizing starch production and applications. Glucose syrup composition, with varying dextrose equivalent levels, is essential in food manufacturing for producing various sweetened products. Understanding these factors is crucial for manufacturers to optimize starch usage and product quality.

Food Starch Market Size

Request Free Sample

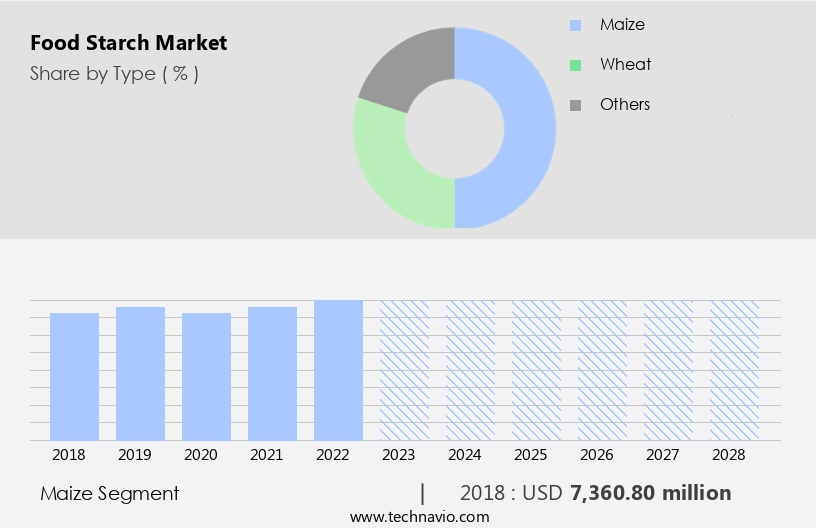
The Maize segment was valued at USD 7.36 billion in 2018 and showed a gradual increase during the forecast period.
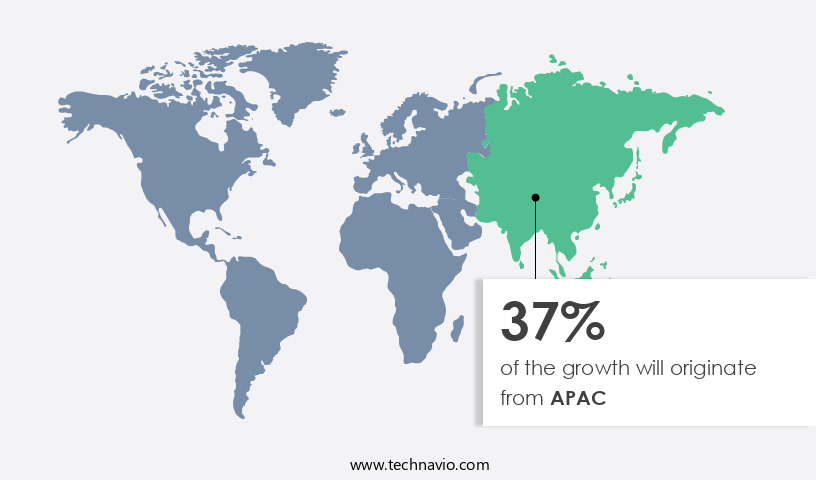
Regional Analysis

APAC is estimated to contribute 37% to the growth of the global market during the forecast period.Technavio's analysts have elaborately explained the regional trends and drivers that shape the market during the forecast period.

Food Starch Market Share by Geography

 Request Free Sample

The market experiences significant growth, with key contributors being developed regions, particularly North America. The US and Canada lead the market, driven by the expanding food and beverage industry. Consumers' increasing preference for convenience foods, such as instant soups, noodles, pasta, and bakery premixes, fuels this growth. Starch syrups production plays a crucial role in this sector, with rapid viscosity analyzers ensuring optimal starch paste stability. Starch granule structure, moisture content, and molecular weight influence food starch functionality. Dextrose equivalent (DE) and modified starch types are essential in various applications, including food, pharmaceuticals, and industrial uses.

Starch paste rheology, resistant starch content, and starch derivatization methods impact product performance. Starch oxidation, gelatinization temperature, crystallinity degree, hydrolysis process, and digestibility analysis are critical factors in starch production and application. Native starch properties, thermal stability, and high amylose starch are essential for starch-based film formation. Amylase enzyme activity, crosslinking chemistry, maltodextrin properties, solubility index, viscosity measurement, and amylopectin branching ratio are other significant factors. Glucose syrup composition varies based on the source of starch and the degree of hydrolysis.

Market Dynamics

Our researchers analyzed the data with 2023 as the base year, along with the key drivers, trends, and challenges. A holistic analysis of drivers will help companies refine their marketing strategies to gain a competitive advantage.

The global food starch market size and forecast projects growth, driven by food starch market trends 2024-2028. B2B food starch supply solutions leverage advanced starch processing technologies for quality. Food starch market growth opportunities 2025 include starch for food processing and non-GMO starch products, meeting demand. Food starch supply chain software optimizes operations, while food starch market competitive analysis highlights key suppliers. Sustainable starch production practices align with eco-friendly food trends. Food starch regulations 2024-2028 shapes food starch demand in North America 2025. High-purity starch solutions and premium food starch insights boost adoption. Starch for bakery products and customized starch formulations target niches. Food starch market challenges and solutions address functionality, with direct procurement strategies for food starch and food starch pricing optimization enhancing profitability. Data-driven food starch analytics and functional ingredient trends drive innovation.

What are the key market drivers leading to the rise in the adoption of Food Starch Industry?

  • The preference for plant-based thickening, gelling, and emulsifying agents over their animal-derived counterparts is the primary market trend. 
  • Food starch, a plant-derived thickening and binding agent, is increasingly replacing traditional animal-derived alternatives in the food industry. Glucose syrup, a common food additive, is composed primarily of starch hydrolysates. Animal-derived thickeners, such as gelatin, are sourced from animal by-products like bones and skin. However, the shift towards plant-based diets is driving demand for alternative Food Additives. Chitosan, a fiber derived from crustacean shells and insect exoskeletons, is a promising alternative to animal-derived thickeners. Its antimicrobial properties make it effective against foodborne bacteria, fungi, and yeast. This plant-based additive is gaining traction in the food industry due to its potential health benefits and alignment with consumer preferences for vegan and vegetarian options.
  • The market is expected to grow as consumers seek out plant-based alternatives to animal-derived ingredients. This trend is likely to continue as people prioritize healthier, more sustainable food choices. Food manufacturers are responding by investing in research and development to create innovative plant-based products that meet the evolving demands of consumers.

What are the market trends shaping the Food Starch Industry?

  • The increasing trend in online sales for food starch is a significant market development. Food starch, a versatile ingredient, experiences rising demand in the digital marketplace.
  • The market experiences significant growth due to the increasing demand for convenience and lower prices in the e-commerce sector. Online sales channels facilitate both business-to-business and business-to-consumer transactions, making it a popular trend for retail services. With busy schedules, consumers prefer the ease and time-saving benefits of shopping online. Additionally, e-commerce platforms often offer competitive pricing due to reduced overhead costs, providing an attractive proposition for food starch purchases. Food starch applications span various industries, including food and beverage, pharmaceuticals, and paper manufacturing. Starch syrups production, a significant application, requires precise control over starch paste stability, granule structure, moisture content, and molecular weight.
  • A rapid viscosity analyzer is an essential tool for monitoring these parameters, ensuring optimal product quality. The dextrose equivalent (DE) is another crucial factor in starch syrup production, influencing the sweetness level and functional properties of the final product. In summary, the market benefits from the e-commerce sector's growth, offering companies increased opportunities for profitability. Consumers appreciate the convenience and cost savings associated with online shopping, while the food starch industry relies on advanced technologies to maintain product quality and meet diverse application requirements.

What challenges does the Food Starch Industry face during its growth?

  • The strict implementation of government regulations poses a significant challenge to the expansion and growth of the industry. 
  • Food starch, as a thickening and gelling agent, is a commonly used food additive subject to regulatory approval by international bodies such as the US FDA, WHO, EFSA, CFIA, and SENASA. These organizations conduct research and trials to evaluate the health impact of food additives, including food starch. In Europe, the SCF and EFSA assess the safety of authorized food additives. Modified starch types, such as starch paste rheology and resistant starch content, undergo various derivatization methods like starch oxidation to enhance their functional properties.
  • The hydrolysis process, which influences starch gelatinization temperature and crystallinity degree, also plays a crucial role in modifying starch types. These modifications contribute to the improvement of food texture, stability, and shelf life. However, it's essential to ensure these modifications do not adversely affect the nutritional value or introduce harmful substances to the food product.

Exclusive Customer Landscape

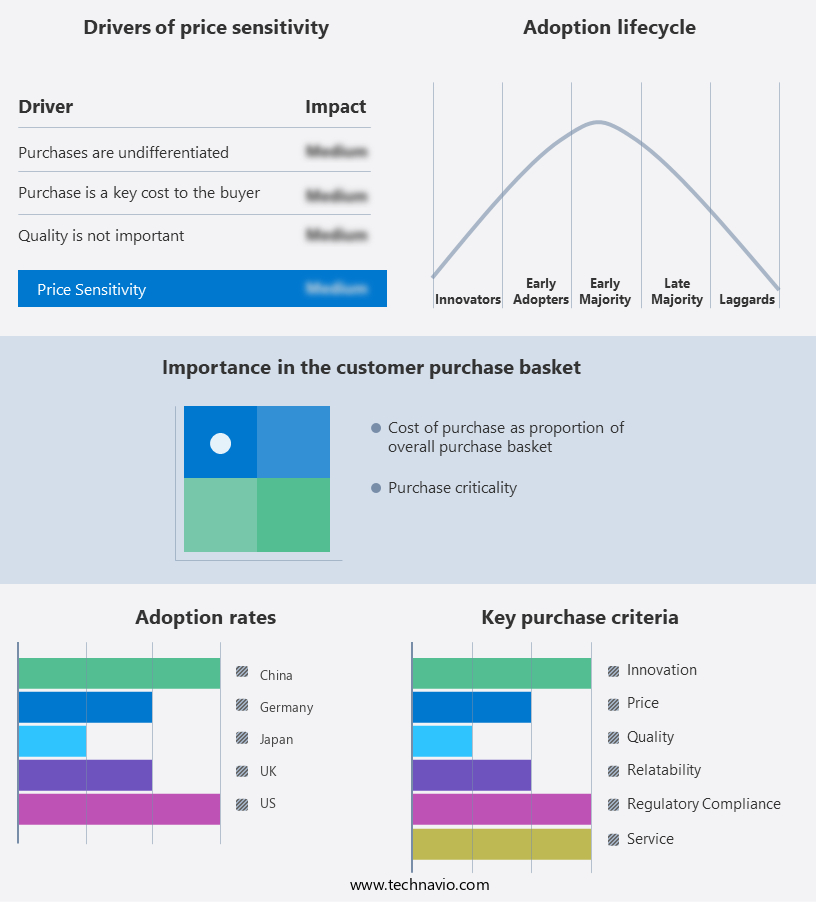
The food starch market forecasting report includes the adoption lifecycle of the market, covering from the innovator's stage to the laggard's stage. It focuses on adoption rates in different regions based on penetration. Furthermore, the food starch market report also includes key purchase criteria and drivers of price sensitivity to help companies evaluate and develop their market growth analysis strategies.

Food Starch Market Share by Geography

 Customer Landscape

Key Companies & Market Insights

Companies are implementing various strategies, such as strategic alliances, food starch market forecast, partnerships, mergers and acquisitions, geographical expansion, and product/service launches, to enhance their presence in the industry.

AGRANA Beteiligungs AG - This company specializes in producing food starches derived from raw materials including corn, potatoes, and wheat. These starches serve diverse applications across various industries. The production process ensures high-quality standards, maintaining the company's reputation as a reliable supplier in the global market.

The industry research and growth report includes detailed analyses of the competitive landscape of the market and information about key companies, including:

  • AGRANA Beteiligungs AG
  • Archer Daniels Midland Co.
  • Beneo GmbH
  • Cargill Inc.
  • Emsland Starke GmbH
  • Global Bio chem Technology Group Co. Ltd.
  • Grain Processing Corp.
  • Ingredion Inc.
  • KMC amba
  • Qingdao CBH Co. Ltd.
  • Qingdao Nuoxing Biotechnology Co. Ltd.
  • Roquette Freres SA
  • Royal Ingredients Group BV
  • Royal Avebe
  • SMS Corp. Co. Ltd.
  • Sonish Starch Technology Co. Ltd.
  • SPAC Starch Products India Pvt. Ltd.
  • Sudzucker AG
  • Tate and Lyle PLC
  • Tereos Participations

Qualitative and quantitative analysis of companies has been conducted to help clients understand the wider business environment as well as the strengths and weaknesses of key industry players. Data is qualitatively analyzed to categorize companies as pure play, category-focused, industry-focused, and diversified; it is quantitatively analyzed to categorize companies as dominant, leading, strong, tentative, and weak.

Recent Development and News in Food Starch Market

  • In January 2024, Archer Daniels Midland Company (ADM) announced the expansion of its corn processing facility in Cedar Rapids, Iowa, increasing its food starch production capacity by 15% (ADM press release). This development aimed to meet the growing demand for food starches in various industries, including food and beverages, pharmaceuticals, and paper.
  • In March 2024, Ingredion Incorporated, a leading global provider of ingredient solutions, signed a strategic partnership with DuPont Nutrition & Biosciences to co-develop and commercialize innovative, plant-based texturants for plant-based meat alternatives (Ingredion press release). This collaboration was expected to bring significant advancements in the texturization of plant-based proteins, enhancing the consumer experience and driving market growth.
  • In May 2024, Tate & Lyle PLC, a leading global provider of food and beverage ingredients and solutions, completed the acquisition of Sweegen, a California-based company specializing in zero-calorie sweeteners and high-intensity sweeteners (Tate & Lyle press release). This strategic move expanded Tate & Lyle's product portfolio, enabling the company to offer a broader range of low-calorie food and beverage solutions, including food starches, to its customers.
  • In April 2025, the European Commission approved the use of genetically modified maize varieties for food and feed applications, including food starch production (European Commission press release). This approval was expected to boost the European the market, as it would increase the availability of raw materials and reduce production costs for starch manufacturers.

Research Analyst Overview

  • The market encompasses various types of starches, including sweet potato starch, rice starch, tapioca starch, corn starch, potato starch, cassava starch, and wheat starch. These starches undergo various processing techniques, such as chemical modification and enzyme-assisted extraction, to enhance their properties. Starch degradation pathways, like the starch browning reaction, pose challenges in the food industry, particularly in confectionery applications. To address these issues, researchers explore starch modification techniques, such as fermentation processes and physical modifications, to improve starch freeze-thaw stability and swelling power. Starch's diverse applications extend beyond food, with significant usage in pharmaceuticals and the production of starch-based bioplastics.
  • Understanding starch's characteristics, like its pasting properties and gel strength, is crucial for optimizing its use in these industries. Rice starch, for instance, is valued for its high amylose content, while tapioca starch processing focuses on improving its transparency. Potato starch extraction techniques aim to preserve its native granule morphology. Cassava starch usage is increasing due to its availability and sustainability. Wheat starch isolation and pea starch application are emerging trends, with potential to disrupt traditional starch markets. Corn starch production remains significant due to its widespread availability and versatility. Overall, the market continues to evolve, driven by advancements in processing techniques and the expanding range of applications.

Dive into Technavio's robust research methodology, blending expert interviews, extensive data synthesis, and validated models for unparalleled Food Starch Market insights. See full methodology.

Market Scope

Report Coverage

Details

Page number

141

Base year

2023

Historic period

2018-2022

Forecast period

2024-2028

Growth momentum & CAGR

Accelerate at a CAGR of 4.5%

Market growth 2024-2028

USD 4835.5 million

Market structure

Fragmented

YoY growth 2023-2024(%)

4.23

Key countries

US, Malaysia, Indonesia, Germany, UK, South Korea, France, Canada, Brazil, Thailand, UAE, Mexico, China, Japan, and India

Competitive landscape

Leading Companies, Market Positioning of Companies, Competitive Strategies, and Industry Risks

Request Free Sample

What are the Key Data Covered in this Food Starch Market Research and Growth Report?

  • CAGR of the Food Starch industry during the forecast period
  • Detailed information on factors that will drive the growth and forecasting between 2024 and 2028
  • Precise estimation of the size of the market and its contribution of the industry in focus to the parent market
  • Accurate predictions about upcoming growth and trends and changes in consumer behaviour
  • Growth of the market across North America, APAC, Europe, South America, and Middle East and Africa
  • Thorough analysis of the market's competitive landscape and detailed information about companies
  • Comprehensive analysis of factors that will challenge the food starch market growth of industry companies

We can help! Our analysts can customize this food starch market research report to meet your requirements.

Get in touch

1 Executive Summary

  • 1.1 Market overview
    • Executive Summary - Chart on Market Overview
    • Executive Summary - Data Table on Market Overview
    • Executive Summary - Chart on Global Market Characteristics
    • Executive Summary - Chart on Market by Geography
    • Executive Summary - Chart on Market Segmentation by Type
    • Executive Summary - Chart on Incremental Growth
    • Executive Summary - Data Table on Incremental Growth
    • Executive Summary - Chart on Company Market Positioning

2 Market Landscape

  • 2.1 Market ecosystem
    • Parent Market
    • Data Table on - Parent Market
  • 2.2 Market characteristics
    • Market characteristics analysis
  • 2.3 Value chain analysis
    • Value Chain Analysis

3 Market Sizing

  • 3.1 Market definition
    • Offerings of companies included in the market definition
  • 3.2 Market segment analysis
    • Market segments
  • 3.3 Market size 2023
    • 3.4 Market outlook: Forecast for 2023-2028
      • Chart on Global - Market size and forecast 2023-2028 ($ million)
      • Data Table on Global - Market size and forecast 2023-2028 ($ million)
      • Chart on Global Market: Year-over-year growth 2023-2028 (%)
      • Data Table on Global Market: Year-over-year growth 2023-2028 (%)

    4 Historic Market Size

    • 4.1 Global Food Starch Market 2018 - 2022
      • Historic Market Size - Data Table on Global Food Starch Market 2018 - 2022 ($ million)
    • 4.2 Type segment analysis 2018 - 2022
      • Historic Market Size - Type Segment 2018 - 2022 ($ million)
    • 4.3 Geography segment analysis 2018 - 2022
      • Historic Market Size - Geography Segment 2018 - 2022 ($ million)
    • 4.4 Country segment analysis 2018 - 2022
      • Historic Market Size - Country Segment 2018 - 2022 ($ million)

    5 Five Forces Analysis

    • 5.1 Five forces summary
      • Five forces analysis - Comparison between 2023 and 2028
    • 5.2 Bargaining power of buyers
      • Bargaining power of buyers - Impact of key factors 2023 and 2028
    • 5.3 Bargaining power of suppliers
      • Bargaining power of suppliers - Impact of key factors in 2023 and 2028
    • 5.4 Threat of new entrants
      • Threat of new entrants - Impact of key factors in 2023 and 2028
    • 5.5 Threat of substitutes
      • Threat of substitutes - Impact of key factors in 2023 and 2028
    • 5.6 Threat of rivalry
      • Threat of rivalry - Impact of key factors in 2023 and 2028
    • 5.7 Market condition
      • Chart on Market condition - Five forces 2023 and 2028

    6 Market Segmentation by Type

    • 6.1 Market segments
      • Chart on Type - Market share (2023-2028) (%)
      • Data Table on Type - Market share (2023-2028) (%)
    • 6.2 Comparison by Type
      • Chart on Comparison by Type
      • Data Table on Comparison by Type
    • 6.3 Maize - Market size and forecast (2023-2028)
      • Chart on Maize - Market size and forecast (2023-2028) ($ million)
      • Data Table on Maize - Market size and forecast (2023-2028) ($ million)
      • Chart on Maize - Year-over-year growth (2023-2028) (%)
      • Data Table on Maize - Year-over-year growth (2023-2028) (%)
    • 6.4 Wheat - Market size and forecast (2023-2028)
      • Chart on Wheat - Market size and forecast (2023-2028) ($ million)
      • Data Table on Wheat - Market size and forecast (2023-2028) ($ million)
      • Chart on Wheat - Year-over-year growth (2023-2028) (%)
      • Data Table on Wheat - Year-over-year growth (2023-2028) (%)
    • 6.5 Others - Market size and forecast (2023-2028)
      • Chart on Others - Market size and forecast (2023-2028) ($ million)
      • Data Table on Others - Market size and forecast (2023-2028) ($ million)
      • Chart on Others - Year-over-year growth (2023-2028) (%)
      • Data Table on Others - Year-over-year growth (2023-2028) (%)
    • 6.6 Market opportunity by Type
      • Market opportunity by Type ($ million)
      • Data Table on Market opportunity by Type ($ million)

    7 Market Segmentation by Product Type

    • 7.1 Market segments
      • Chart on Product Type - Market share (2023-2028) (%)
      • Data Table on Product Type - Market share (2023-2028) (%)
    • 7.2 Comparison by Product Type
      • Chart on Comparison by Product Type
      • Data Table on Comparison by Product Type
    • 7.3 Native Starch - Market size and forecast (2023-2028)
      • Chart on Native Starch - Market size and forecast (2023-2028) ($ million)
      • Data Table on Native Starch - Market size and forecast (2023-2028) ($ million)
      • Chart on Native Starch - Year-over-year growth (2023-2028) (%)
      • Data Table on Native Starch - Year-over-year growth (2023-2028) (%)
    • 7.4 Modified Starch - Market size and forecast (2023-2028)
      • Chart on Modified Starch - Market size and forecast (2023-2028) ($ million)
      • Data Table on Modified Starch - Market size and forecast (2023-2028) ($ million)
      • Chart on Modified Starch - Year-over-year growth (2023-2028) (%)
      • Data Table on Modified Starch - Year-over-year growth (2023-2028) (%)
    • 7.5 Starch Derivatives - Market size and forecast (2023-2028)
      • Chart on Starch Derivatives - Market size and forecast (2023-2028) ($ million)
      • Data Table on Starch Derivatives - Market size and forecast (2023-2028) ($ million)
      • Chart on Starch Derivatives - Year-over-year growth (2023-2028) (%)
      • Data Table on Starch Derivatives - Year-over-year growth (2023-2028) (%)
    • 7.6 Market opportunity by Product Type
      • Market opportunity by Product Type ($ million)
      • Data Table on Market opportunity by Product Type ($ million)

    8 Market Segmentation by Application

    • 8.1 Market segments
      • Chart on Application - Market share (2023-2028) (%)
      • Data Table on Application - Market share (2023-2028) (%)
    • 8.2 Comparison by Application
      • Chart on Comparison by Application
      • Data Table on Comparison by Application
    • 8.3 Food and Beverage (Bakery, Confectionery, Beverages) - Market size and forecast (2023-2028)
      • Chart on Food and Beverage (Bakery, Confectionery, Beverages) - Market size and forecast (2023-2028) ($ million)
      • Data Table on Food and Beverage (Bakery, Confectionery, Beverages) - Market size and forecast (2023-2028) ($ million)
      • Chart on Food and Beverage (Bakery, Confectionery, Beverages) - Year-over-year growth (2023-2028) (%)
      • Data Table on Food and Beverage (Bakery, Confectionery, Beverages) - Year-over-year growth (2023-2028) (%)
    • 8.4 Industrial - Market size and forecast (2023-2028)
      • Chart on Industrial - Market size and forecast (2023-2028) ($ million)
      • Data Table on Industrial - Market size and forecast (2023-2028) ($ million)
      • Chart on Industrial - Year-over-year growth (2023-2028) (%)
      • Data Table on Industrial - Year-over-year growth (2023-2028) (%)
    • 8.5 Pharmaceuticals - Market size and forecast (2023-2028)
      • Chart on Pharmaceuticals - Market size and forecast (2023-2028) ($ million)
      • Data Table on Pharmaceuticals - Market size and forecast (2023-2028) ($ million)
      • Chart on Pharmaceuticals - Year-over-year growth (2023-2028) (%)
      • Data Table on Pharmaceuticals - Year-over-year growth (2023-2028) (%)
    • 8.6 Market opportunity by Application
      • Market opportunity by Application ($ million)
      • Data Table on Market opportunity by Application ($ million)

    9 Customer Landscape

    • 9.1 Customer landscape overview
      • Analysis of price sensitivity, lifecycle, customer purchase basket, adoption rates, and purchase criteria

    10 Geographic Landscape

    • 10.1 Geographic segmentation
      • Chart on Market share by geography 2023-2028 (%)
      • Data Table on Market share by geography 2023-2028 (%)
    • 10.2 Geographic comparison
      • Chart on Geographic comparison
      • Data Table on Geographic comparison
    • 10.3 North America - Market size and forecast 2023-2028
      • Chart on North America - Market size and forecast 2023-2028 ($ million)
      • Data Table on North America - Market size and forecast 2023-2028 ($ million)
      • Chart on North America - Year-over-year growth 2023-2028 (%)
      • Data Table on North America - Year-over-year growth 2023-2028 (%)
    • 10.4 APAC - Market size and forecast 2023-2028
      • Chart on APAC - Market size and forecast 2023-2028 ($ million)
      • Data Table on APAC - Market size and forecast 2023-2028 ($ million)
      • Chart on APAC - Year-over-year growth 2023-2028 (%)
      • Data Table on APAC - Year-over-year growth 2023-2028 (%)
    • 10.5 Europe - Market size and forecast 2023-2028
      • Chart on Europe - Market size and forecast 2023-2028 ($ million)
      • Data Table on Europe - Market size and forecast 2023-2028 ($ million)
      • Chart on Europe - Year-over-year growth 2023-2028 (%)
      • Data Table on Europe - Year-over-year growth 2023-2028 (%)
    • 10.6 South America - Market size and forecast 2023-2028
      • Chart on South America - Market size and forecast 2023-2028 ($ million)
      • Data Table on South America - Market size and forecast 2023-2028 ($ million)
      • Chart on South America - Year-over-year growth 2023-2028 (%)
      • Data Table on South America - Year-over-year growth 2023-2028 (%)
    • 10.7 Middle East and Africa - Market size and forecast 2023-2028
      • Chart on Middle East and Africa - Market size and forecast 2023-2028 ($ million)
      • Data Table on Middle East and Africa - Market size and forecast 2023-2028 ($ million)
      • Chart on Middle East and Africa - Year-over-year growth 2023-2028 (%)
      • Data Table on Middle East and Africa - Year-over-year growth 2023-2028 (%)
    • 10.8 US - Market size and forecast 2023-2028
      • Chart on US - Market size and forecast 2023-2028 ($ million)
      • Data Table on US - Market size and forecast 2023-2028 ($ million)
      • Chart on US - Year-over-year growth 2023-2028 (%)
      • Data Table on US - Year-over-year growth 2023-2028 (%)
    • 10.9 China - Market size and forecast 2023-2028
      • Chart on China - Market size and forecast 2023-2028 ($ million)
      • Data Table on China - Market size and forecast 2023-2028 ($ million)
      • Chart on China - Year-over-year growth 2023-2028 (%)
      • Data Table on China - Year-over-year growth 2023-2028 (%)
    • 10.10 Germany - Market size and forecast 2023-2028
      • Chart on Germany - Market size and forecast 2023-2028 ($ million)
      • Data Table on Germany - Market size and forecast 2023-2028 ($ million)
      • Chart on Germany - Year-over-year growth 2023-2028 (%)
      • Data Table on Germany - Year-over-year growth 2023-2028 (%)
    • 10.11 UK - Market size and forecast 2023-2028
      • Chart on UK - Market size and forecast 2023-2028 ($ million)
      • Data Table on UK - Market size and forecast 2023-2028 ($ million)
      • Chart on UK - Year-over-year growth 2023-2028 (%)
      • Data Table on UK - Year-over-year growth 2023-2028 (%)
    • 10.12 Japan - Market size and forecast 2023-2028
      • Chart on Japan - Market size and forecast 2023-2028 ($ million)
      • Data Table on Japan - Market size and forecast 2023-2028 ($ million)
      • Chart on Japan - Year-over-year growth 2023-2028 (%)
      • Data Table on Japan - Year-over-year growth 2023-2028 (%)
    • 10.13 Market opportunity by geography
      • Market opportunity by geography ($ million)
      • Data Tables on Market opportunity by geography ($ million)
    • 10.14 US - Market size and forecast (2023-2028)
      • Chart on US - Market size and forecast (2023-2028) ($ million)
      • Data Table on US - Market size and forecast (2023-2028) ($ million)
      • Chart on US - Year-over-year growth (2023-2028) (%)
      • Data Table on US - Year-over-year growth (2023-2028) (%)
    • 10.15 Malaysia - Market size and forecast (2023-2028)
      • Chart on Malaysia - Market size and forecast (2023-2028) ($ million)
      • Data Table on Malaysia - Market size and forecast (2023-2028) ($ million)
      • Chart on Malaysia - Year-over-year growth (2023-2028) (%)
      • Data Table on Malaysia - Year-over-year growth (2023-2028) (%)
    • 10.16 Indonesia - Market size and forecast (2023-2028)
      • Chart on Indonesia - Market size and forecast (2023-2028) ($ million)
      • Data Table on Indonesia - Market size and forecast (2023-2028) ($ million)
      • Chart on Indonesia - Year-over-year growth (2023-2028) (%)
      • Data Table on Indonesia - Year-over-year growth (2023-2028) (%)
    • 10.17 South Korea - Market size and forecast (2023-2028)
      • Chart on South Korea - Market size and forecast (2023-2028) ($ million)
      • Data Table on South Korea - Market size and forecast (2023-2028) ($ million)
      • Chart on South Korea - Year-over-year growth (2023-2028) (%)
      • Data Table on South Korea - Year-over-year growth (2023-2028) (%)
    • 10.18 France - Market size and forecast (2023-2028)
      • Chart on France - Market size and forecast (2023-2028) ($ million)
      • Data Table on France - Market size and forecast (2023-2028) ($ million)
      • Chart on France - Year-over-year growth (2023-2028) (%)
      • Data Table on France - Year-over-year growth (2023-2028) (%)
    • 10.19 Canada - Market size and forecast (2023-2028)
      • Chart on Canada - Market size and forecast (2023-2028) ($ million)
      • Data Table on Canada - Market size and forecast (2023-2028) ($ million)
      • Chart on Canada - Year-over-year growth (2023-2028) (%)
      • Data Table on Canada - Year-over-year growth (2023-2028) (%)
    • 10.20 Brazil - Market size and forecast (2023-2028)
      • Chart on Brazil - Market size and forecast (2023-2028) ($ million)
      • Data Table on Brazil - Market size and forecast (2023-2028) ($ million)
      • Chart on Brazil - Year-over-year growth (2023-2028) (%)
      • Data Table on Brazil - Year-over-year growth (2023-2028) (%)
    • 10.21 Thailand - Market size and forecast (2023-2028)
      • Chart on Thailand - Market size and forecast (2023-2028) ($ million)
      • Data Table on Thailand - Market size and forecast (2023-2028) ($ million)
      • Chart on Thailand - Year-over-year growth (2023-2028) (%)
      • Data Table on Thailand - Year-over-year growth (2023-2028) (%)
    • 10.22 UAE - Market size and forecast (2023-2028)
      • Chart on UAE - Market size and forecast (2023-2028) ($ million)
      • Data Table on UAE - Market size and forecast (2023-2028) ($ million)
      • Chart on UAE - Year-over-year growth (2023-2028) (%)
      • Data Table on UAE - Year-over-year growth (2023-2028) (%)
    • 10.23 Mexico - Market size and forecast (2023-2028)
      • Chart on Mexico - Market size and forecast (2023-2028) ($ million)
      • Data Table on Mexico - Market size and forecast (2023-2028) ($ million)
      • Chart on Mexico - Year-over-year growth (2023-2028) (%)
      • Data Table on Mexico - Year-over-year growth (2023-2028) (%)
    • 10.24 India - Market size and forecast (2023-2028)
      • Chart on India - Market size and forecast (2023-2028) ($ million)
      • Data Table on India - Market size and forecast (2023-2028) ($ million)
      • Chart on India - Year-over-year growth (2023-2028) (%)
      • Data Table on India - Year-over-year growth (2023-2028) (%)
    • 10.25 Rest of World (ROW) - Market size and forecast (2023-2028)
      • Chart on Rest of World (ROW) - Market size and forecast (2023-2028) ($ million)
      • Data Table on Rest of World (ROW) - Market size and forecast (2023-2028) ($ million)
      • Chart on Rest of World (ROW) - Year-over-year growth (2023-2028) (%)
      • Data Table on Rest of World (ROW) - Year-over-year growth (2023-2028) (%)

    11 Drivers, Challenges, and Opportunity/Restraints

    • 11.1 Market drivers
      • 11.2 Market challenges
        • 11.3 Impact of drivers and challenges
          • Impact of drivers and challenges in 2023 and 2028
        • 11.4 Market opportunities/restraints

          12 Competitive Landscape

          • 12.1 Overview
            • 12.2 Competitive Landscape
              • Overview on criticality of inputs and factors of differentiation
            • 12.3 Landscape disruption
              • Overview on factors of disruption
            • 12.4 Industry risks
              • Impact of key risks on business

            13 Competitive Analysis

            • 13.1 Companies profiled
              • Companies covered
            • 13.2 Market positioning of companies
              • Matrix on companies position and classification
            • 13.3 AGRANA Beteiligungs AG
              • AGRANA Beteiligungs AG - Overview
              • AGRANA Beteiligungs AG - Business segments
              • AGRANA Beteiligungs AG - Key news
              • AGRANA Beteiligungs AG - Key offerings
              • AGRANA Beteiligungs AG - Segment focus
            • 13.4 Archer Daniels Midland Co.
              • Archer Daniels Midland Co. - Overview
              • Archer Daniels Midland Co. - Business segments
              • Archer Daniels Midland Co. - Key news
              • Archer Daniels Midland Co. - Key offerings
              • Archer Daniels Midland Co. - Segment focus
            • 13.5 Beneo GmbH
              • Beneo GmbH - Overview
              • Beneo GmbH - Product / Service
              • Beneo GmbH - Key news
              • Beneo GmbH - Key offerings
            • 13.6 Cargill Inc.
              • Cargill Inc. - Overview
              • Cargill Inc. - Product / Service
              • Cargill Inc. - Key news
              • Cargill Inc. - Key offerings
            • 13.7 Ingredion Inc.
              • Ingredion Inc. - Overview
              • Ingredion Inc. - Business segments
              • Ingredion Inc. - Key news
              • Ingredion Inc. - Key offerings
              • Ingredion Inc. - Segment focus
            • 13.8 Qingdao Nuoxing Biotechnology Co. Ltd.
              • Qingdao Nuoxing Biotechnology Co. Ltd. - Overview
              • Qingdao Nuoxing Biotechnology Co. Ltd. - Product / Service
              • Qingdao Nuoxing Biotechnology Co. Ltd. - Key offerings
            • 13.9 Roquette Freres SA
              • Roquette Freres SA - Overview
              • Roquette Freres SA - Product / Service
              • Roquette Freres SA - Key offerings
            • 13.10 Sonish Starch Technology Co. Ltd.
              • Sonish Starch Technology Co. Ltd. - Overview
              • Sonish Starch Technology Co. Ltd. - Product / Service
              • Sonish Starch Technology Co. Ltd. - Key offerings
            • 13.11 SPAC Starch Products India Pvt. Ltd.
              • SPAC Starch Products India Pvt. Ltd. - Overview
              • SPAC Starch Products India Pvt. Ltd. - Product / Service
              • SPAC Starch Products India Pvt. Ltd. - Key offerings
            • 13.12 Tate and Lyle PLC
              • Tate and Lyle PLC - Overview
              • Tate and Lyle PLC - Business segments
              • Tate and Lyle PLC - Key news
              • Tate and Lyle PLC - Key offerings
              • Tate and Lyle PLC - Segment focus

            14 Appendix

            • 14.1 Scope of the report
              • 14.2 Inclusions and exclusions checklist
                • Inclusions checklist
                • Exclusions checklist
              • 14.3 Currency conversion rates for US$
                • Currency conversion rates for US$
              • 14.4 Research methodology
                • Research methodology
              • 14.5 Data procurement
                • Information sources
              • 14.6 Data validation
                • Data validation
              • 14.7 Validation techniques employed for market sizing
                • Validation techniques employed for market sizing
              • 14.8 Data synthesis
                • Data synthesis
              • 14.9 360 degree market analysis
                • 360 degree market analysis
              • 14.10 List of abbreviations
                • List of abbreviations

              Research Methodology

              Technavio presents a detailed picture of the market by way of study, synthesis, and summation of data from multiple sources. The analysts have presented the various facets of the market with a particular focus on identifying the key industry influencers. The data thus presented is comprehensive, reliable, and the result of extensive research, both primary and secondary.

              INFORMATION SOURCES

              Primary sources

              • Manufacturers and suppliers
              • Channel partners
              • Industry experts
              • Strategic decision makers

              Secondary sources

              • Industry journals and periodicals
              • Government data
              • Financial reports of key industry players
              • Historical data
              • Press releases

              DATA ANALYSIS

              Data Synthesis

              • Collation of data
              • Estimation of key figures
              • Analysis of derived insights

              Data Validation

              • Triangulation with data models
              • Reference against proprietary databases
              • Corroboration with industry experts

              REPORT WRITING

              Qualitative

              • Market drivers
              • Market challenges
              • Market trends
              • Five forces analysis

              Quantitative

              • Market size and forecast
              • Market segmentation
              • Geographical insights
              • Competitive landscape

              Interested in this report?

              Get your sample now to see our research methodology and insights!

              Download Now

              Frequently Asked Questions

              Food Starch market growth will increase by $ 4835.5 mn during 2024-2028 .

              The Food Starch market is expected to grow at a CAGR of 4.5% during 2024-2028 .

              Food Starch market is segmented by Type( Maize, Wheat, Others) Product Type( Native Starch, Modified Starch, Starch Derivatives)

              AGRANA Beteiligungs AG, Archer Daniels Midland Co., Beneo GmbH, Cargill Inc., Emsland Starke GmbH, Global Bio chem Technology Group Co. Ltd., Grain Processing Corp., Ingredion Inc., KMC amba, Qingdao CBH Co. Ltd., Qingdao Nuoxing Biotechnology Co. Ltd., Roquette Freres SA, Royal Ingredients Group BV, Royal Avebe, SMS Corp. Co. Ltd., Sonish Starch Technology Co. Ltd., SPAC Starch Products India Pvt. Ltd., Sudzucker AG, Tate and Lyle PLC, Tereos Participations are a few of the key vendors in the Food Starch market.

              APAC will register the highest growth rate of 37% among the other regions. Therefore, the Food Starch market in APAC is expected to garner significant business opportunities for the vendors during the forecast period.

              US, Malaysia, Indonesia, Germany, UK, South Korea, France, Canada, Brazil, Thailand, UAE, Mexico, China, Japan, India

              • Preference over animal-derived thickening is the driving factor this market.
              • gelling is the driving factor this market.
              • and emulsifying agentsTraditional food thickening is the driving factor this market.
              • gelling is the driving factor this market.
              • and emulsifying agents are animal-derived ingredients and are produced using the skin and bones of different animal sources is the driving factor this market.
              • such as cattle is the driving factor this market.
              • pigs (swine) is the driving factor this market.
              • and fish. For instance is the driving factor this market.
              • gelatin is one of the major animal-derived food additives that is used for dressings is the driving factor this market.
              • sauces is the driving factor this market.
              • and confectionery. Similarly is the driving factor this market.
              • chitosan has gained attention as a potential food additive due to its antimicrobial activities against a range of foodborne filamentous fungi is the driving factor this market.
              • yeast is the driving factor this market.
              • and bacteria. Chitosan is a fiber that is derived from the exoskeleton of insects and the shells of crustaceans is the driving factor this market.
              • such as shrimp is the driving factor this market.
              • clams is the driving factor this market.
              • and lobsters. However is the driving factor this market.
              • the changing food preferences of people for a vegan diet are pushing up the demand for plant-based food products. Veganism is gaining traction progressively among consumers around the world. It strongly favors animal rights and is concerned for the environment. Consumers who embrace veganism are making conscious efforts to refrain from consuming food products of animal origin. These consumers prefer healthy alternatives to animal-sourced food products. These factors have propelled the demand for food starch obtained from maize is the driving factor this market.
              • wheat is the driving factor this market.
              • potato is the driving factor this market.
              • and rice.In countries such as the US is the driving factor this market.
              • Canada is the driving factor this market.
              • and the UK is the driving factor this market.
              • there is a high demand for plant-based food ingredients due to the increasing trend of veganism. As per the data provided by the Plant-Based Foods Association (PBFA) and The Good Food Institute (GFI) is the driving factor this market.
              • in 2020 is the driving factor this market.
              • plant-based food retail sales grew by 27% in the US over that in 2019 is the driving factor this market.
              • which was faster than the growth rate of the overall US retail market is the driving factor this market.
              • which grew by only 15%. According to People for the Ethical Treatment of Animals (PETA) is the driving factor this market.
              • about 2.5% of the US population follows a vegan diet and lifestyle. In the UK and the rest of the world is the driving factor this market.
              • 0.5%-0.7% of the total population is expected to adopt veganism during the forecast period. This rise in the global vegan population has driven the demand for food starch obtained from plant sources. The millennial population living in such countries is opting for plant-based products due to ethical issues over animal cruelty. Thus is the driving factor this market.
              • the growing consumer preference for plant-derived food starch is expected to be favorable for the growth of the global food starch market during the forecast period. is the driving factor this market.

              The Food Starch market vendors should focus on grabbing business opportunities from the Maize segment as it accounted for the largest market share in the base year.