
France Ridesharing Market Size 2026-2030
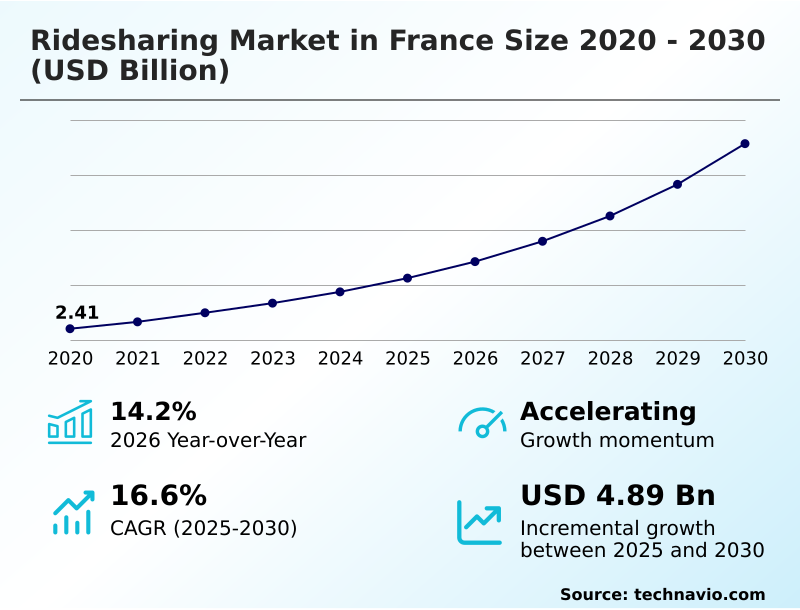
The france ridesharing market size is valued to increase by USD 4.89 billion, at a CAGR of 16.6% from 2025 to 2030. Digital platform optimization and smart mobility integration will drive the france ridesharing market.
Major Market Trends & Insights
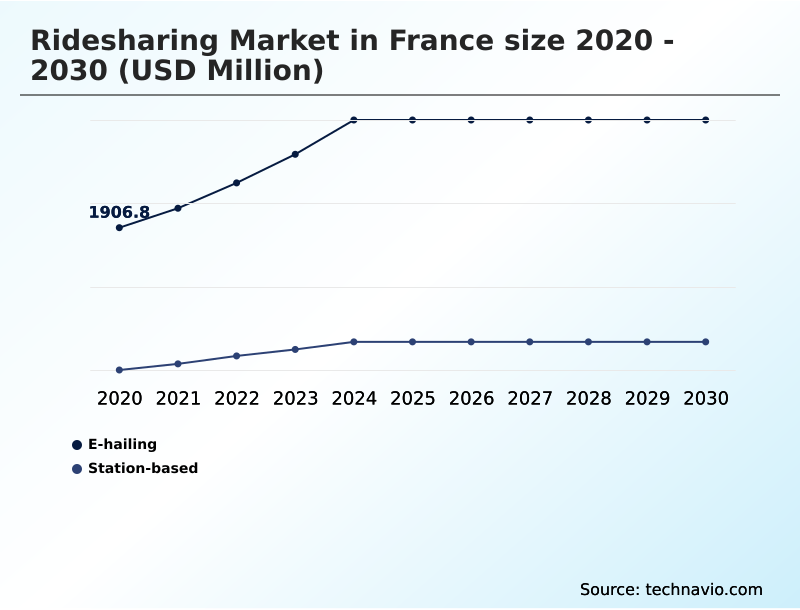
- By Service - E-hailing segment was valued at USD 2.97 billion in 2024
- By Vehicle Type - Car and vans segment accounted for the largest market revenue share in 2024
Market Size & Forecast
- Market Opportunities: USD 6.74 billion
- Market Future Opportunities: USD 4.89 billion
- CAGR from 2025 to 2030 : 16.6%
Market Summary
- The ridesharing market in France is undergoing a significant transformation, driven by technological innovation and shifting consumer preferences toward sustainable and convenient transportation. At its core, the market leverages digital platforms that facilitate on-demand services, connecting a dynamic driver partner ecosystem with passengers through sophisticated geolocation technology.
- This ecosystem is expanding beyond traditional e-hailing to include diverse shared mobility options such as carpooling platforms and micromobility solutions. A critical factor influencing growth is the focus on operational efficiency, achieved through AI-powered route optimization and dynamic pricing models that balance supply and demand.
- For instance, logistics businesses are now exploring partnerships with ridesharing networks to handle last-mile connectivity for package delivery, a business scenario that demonstrates the sector's expanding utility beyond passenger transport.
- However, the industry navigates a complex environment of regulatory frameworks and the operational challenges of the gig economy model, pushing companies to innovate continuously in areas like user safety features and the integration of low-emission vehicles to maintain a competitive edge and align with national sustainability goals.
- The evolution toward integrated, multimodal journey planning signifies the market's future direction, aiming to create a seamless urban mobility experience.
What will be the Size of the France Ridesharing Market during the forecast period?
Get Key Insights on Market Forecast (PDF) Get Free Sample
How is the France Ridesharing Market Segmented?
The france ridesharing industry research report provides comprehensive data (region-wise segment analysis), with forecasts and estimates in "USD million" for the period 2026-2030, as well as historical data from 2020-2024 for the following segments.
- Service
- E-hailing
- Station-based
- Vehicle type
- Car and vans
- Two-wheelers
- Connectivity
- Short distance
- Long distance
- Geography
- Europe
- France
- Europe
By Service Insights
The e-hailing segment is estimated to witness significant growth during the forecast period.
The e-hailing segment is a cornerstone of modern urban mobility solutions, functioning as a transportation network company that delivers on-demand services through sophisticated mobile applications.
This model leverages geolocation technology and passenger matching for immediate ride booking, with dynamic pricing and seamless payment processing enhancing user convenience. Real-time tracking provides transparency and safety throughout the journey.
The integration of smart mobility features into these ride-hailing platforms is critical for optimizing routes and managing passenger logistics in complex smart city transportation ecosystems.
As a result of these advancements, platform engagement has grown significantly, with some metrics showing an increase of over 14% year-over-year, demonstrating the segment's role in providing flexible travel options.
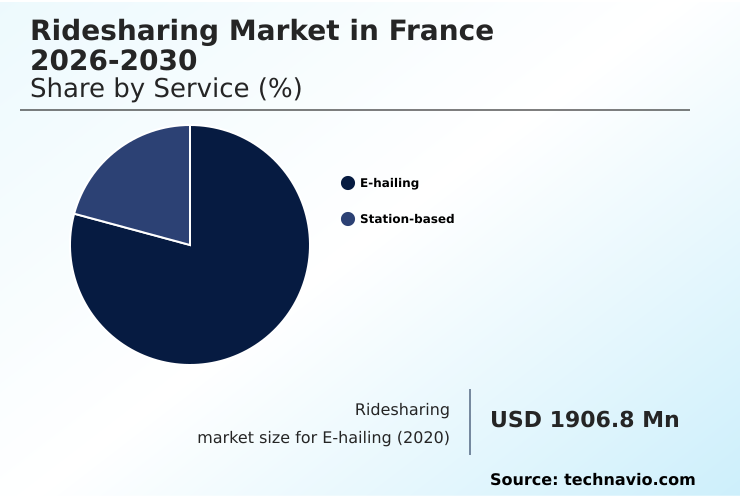
The E-hailing segment was valued at USD 2.97 billion in 2024 and showed a gradual increase during the forecast period.
Market Dynamics
Our researchers analyzed the data with 2025 as the base year, along with the key drivers, trends, and challenges. A holistic analysis of drivers will help companies refine their marketing strategies to gain a competitive advantage.
- Strategic analysis of the market must address several interconnected issues. A central debate concerns the impact of dynamic pricing on driver earnings and the gig economy labor laws impact on ridesharing. Concurrently, the role of AI in ridesharing route optimization is undisputed, with advanced systems improving efficiency by over 15% compared to manual dispatch.
- However, significant regulatory challenges for ridesharing in urban areas persist. Success increasingly depends on multimodal transport integration strategies, such as integrating public transit with ridesharing apps, which requires assessing ridesharing and its effect on public transportation. This convergence demands robust safety standards for ride-hailing platforms and measures to handle data privacy concerns in on-demand transport apps.
- The future of autonomous vehicles in shared mobility promises to revolutionize the sector, but the discussion around comparing e-hailing and station-based models remains relevant for current operations. Stakeholders are focused on how to improve urban mobility with ridesharing, exploring the benefits of corporate carpooling programs and the environmental benefits of electric scooter sharing.
- Key initiatives include developing ridesharing solutions for last-mile connectivity, reducing traffic congestion through shared rides, and promoting the electric vehicle adoption in ridesharing fleets. Continuous improvement in optimizing fleet management for ridesharing companies and enhancing the user experience design for mobility apps is essential, whether for urban commuting or a ridesharing platform for long-distance travel.
What are the key market drivers leading to the rise in the adoption of France Ridesharing Industry?
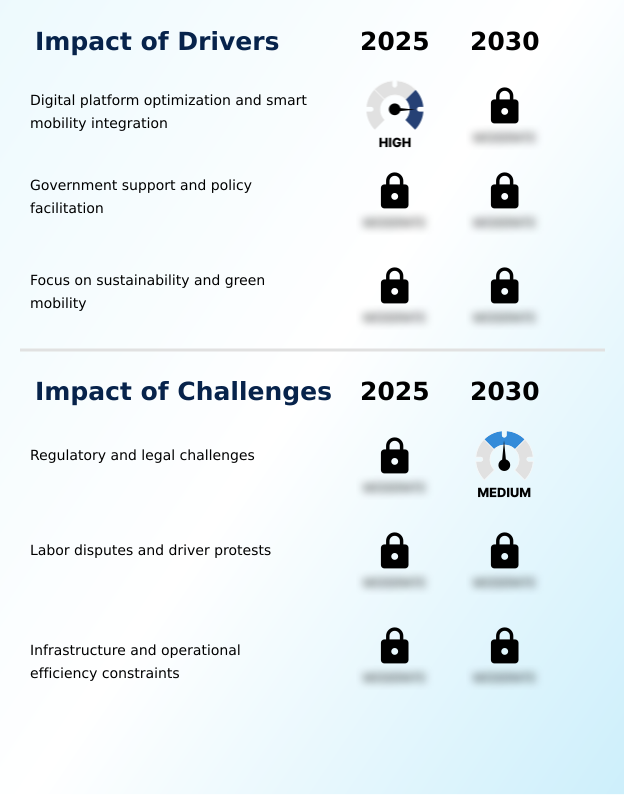
- Digital platform optimization and smart mobility integration function as a primary market driver by enhancing operational efficiency and elevating the user experience.
- Market growth is significantly influenced by digital platform enhancements that improve urban transport efficiency. The use of smart routing algorithms and digital dispatching has reduced average passenger wait times by up to 30%, a key factor in improving service quality.
- Predictive demand analytics enable mobility on demand (MoD) platforms to anticipate travel patterns, ensuring better shared vehicle utilization and operational efficiency. The network effect is strengthened through streamlined driver onboarding and public-private partnerships focused on commuter ride matching.
- These collaborations have led to a 10% increase in demand-responsive transport options in underserved areas. Furthermore, an emphasis on user safety features is crucial for building trust and sustaining the growth of shared mobility ecosystems.
What are the market trends shaping the France Ridesharing Industry?
- The integration of multimodal transportation options represents a significant trend, reflecting a strategic shift toward comprehensive, interconnected mobility solutions. This approach combines various travel modes to deliver a seamless user experience.
- The market is increasingly shaped by the push toward sustainable transport options and integrated mobility platforms. A key trend is the expansion of multimodal journey planning, which leverages application programming interfaces to blend ridesharing with public transit and micromobility solutions.
- This shift toward transport as a service (TaaS) has improved urban accessibility, with early adopters reporting a 15% increase in user retention. Concurrently, the adoption of low-emission vehicles is accelerating, with companies transitioning to electric vehicle fleets to support green mobility initiatives.
- This has resulted in a measurable impact, reducing the average carbon footprint per trip by over 20% through diligent tracking. The long-term vision includes shared autonomous vehicles, which promise to redefine eco-friendly commuting.
What challenges does the France Ridesharing Industry face during its growth?
- The presence of regulatory and legal complexities poses a significant challenge, constraining operational flexibility and affecting overall market growth.
- The market's expansion faces hurdles from the complexities of the gig economy model and evolving regulatory frameworks. Labor disputes and driver protests can increase driver churn by over 15%, disrupting the reliability of shared transport services. Simultaneously, ensuring robust passenger safety protocols, including comprehensive driver background checks and trip verification, adds to operational costs.
- In dense urban areas, the challenge of congestion reduction remains, as an increase in peer-to-peer ride sharing can strain infrastructure if not managed through policies that encourage higher vehicle occupancy rates. Platforms must also refine surge pricing systems to balance supply and demand, while effective fleet management is essential for optimizing urban logistics and profitability.
Exclusive Technavio Analysis on Customer Landscape
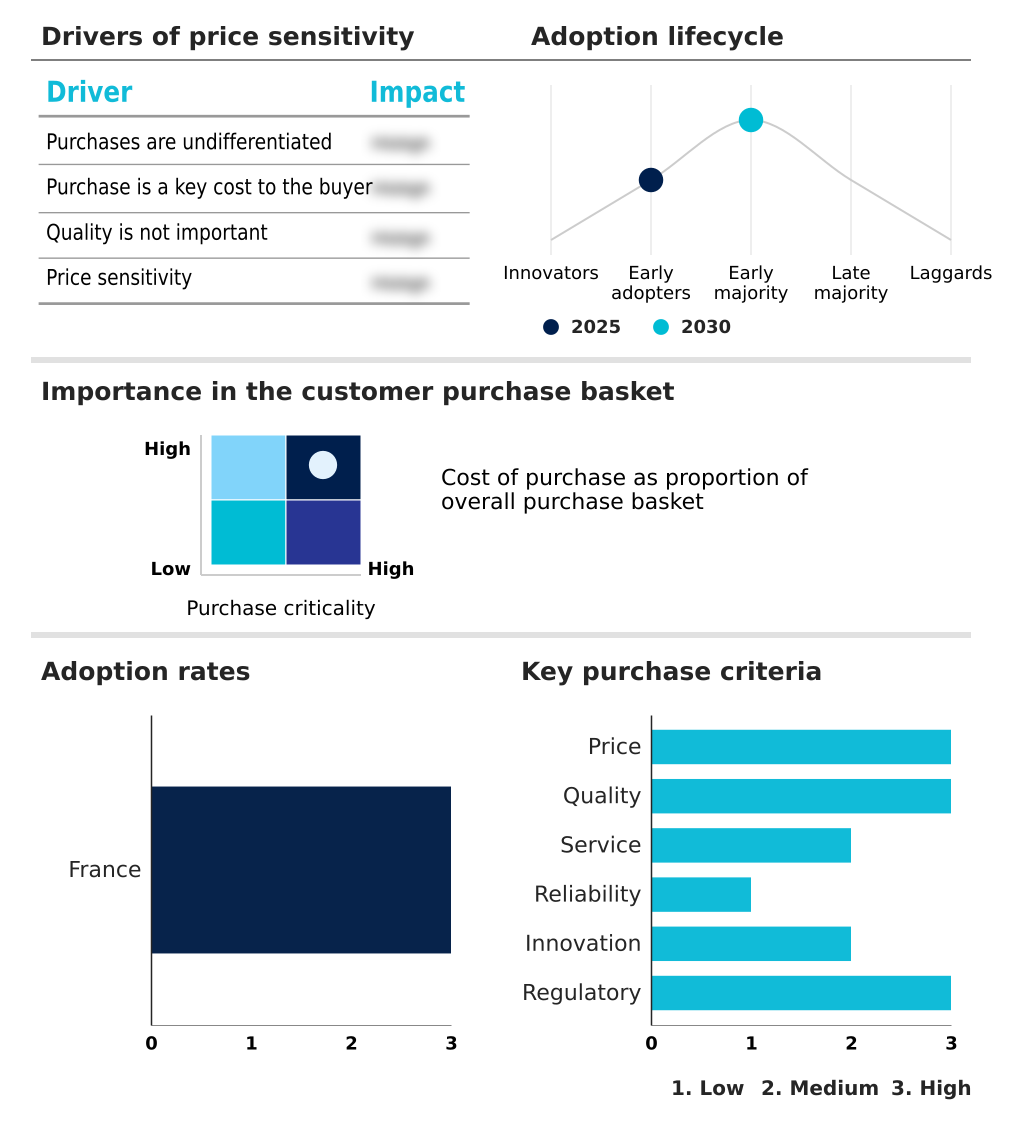
The france ridesharing market forecasting report includes the adoption lifecycle of the market, covering from the innovator’s stage to the laggard’s stage. It focuses on adoption rates in different regions based on penetration. Furthermore, the france ridesharing market report also includes key purchase criteria and drivers of price sensitivity to help companies evaluate and develop their market growth analysis strategies.
Customer Landscape of France Ridesharing Industry
Competitive Landscape
Companies are implementing various strategies, such as strategic alliances, france ridesharing market forecast, partnerships, mergers and acquisitions, geographical expansion, and product/service launches, to enhance their presence in the industry.
Blacklane GmbH - Analysis indicates a focus on connecting users for shared long-distance travel, emphasizing cost efficiency, optimized routes, and lower environmental impact through shared mobility.
The industry research and growth report includes detailed analyses of the competitive landscape of the market and information about key companies, including:
- Blacklane GmbH
- Bolt Technology OU
- Caocao Mobility Paris
- CarpoolWorld inc.
- Citygo
- Comuto SA
- France Taxi SAS
- Groupe Rousselet
- Heetch
- Karos Mobility
- Lyft Inc.
- MyEcoCar
- Public In Motion GmbH
- QRyde
- Rezo Pouce
- Transopco UK Ltd.
- Uber Technologies Inc.
Qualitative and quantitative analysis of companies has been conducted to help clients understand the wider business environment as well as the strengths and weaknesses of key industry players. Data is qualitatively analyzed to categorize companies as pure play, category-focused, industry-focused, and diversified; it is quantitatively analyzed to categorize companies as dominant, leading, strong, tentative, and weak.
Recent Development and News in France ridesharing market
- In August, 2025, Uber Technologies Inc. received clarity on employment classifications following a French Supreme Court decision that confirmed the independent contractor status of its drivers, which helps in structuring operations more efficiently and reduces litigation risk.
- In September, 2025, BlaBlaCar expanded its platform features by integrating a real-time fuel efficiency tracking system to encourage eco-conscious driving behavior and reduce cost burdens for shared riders.
- In January, 2025, the French government expanded the Sustainable Mobility Package, a policy initiative enabling employers to provide tax-free financial support for employees using eco-friendly commuting options, including ridesharing and carpooling.
- In May, 2025, BlaBlaCar introduced train ticket sales in France, complementing its carpooling services to offer multimodal, eco-friendly travel options and reduce reliance on single-occupancy vehicles.
Dive into Technavio’s robust research methodology, blending expert interviews, extensive data synthesis, and validated models for unparalleled France Ridesharing Market insights. See full methodology.
| Market Scope | |
|---|---|
| Page number | 169 |
| Base year | 2025 |
| Historic period | 2020-2024 |
| Forecast period | 2026-2030 |
| Growth momentum & CAGR | Accelerate at a CAGR of 16.6% |
| Market growth 2026-2030 | USD 4893.3 million |
| Market structure | Fragmented |
| YoY growth 2025-2026(%) | 14.2% |
| Key countries | France |
| Competitive landscape | Leading Companies, Market Positioning of Companies, Competitive Strategies, and Industry Risks |
Research Analyst Overview
- The ridesharing market in France is a dynamic arena of technological advancement and complex operational frameworks. Central to its function are on-demand services built on a foundation of geolocation technology for precise passenger matching, real-time navigation guiding smart routing algorithms, and digital dispatching for heightened operational efficiency.
- The integration of seamless payment processing and robust customer relationship management systems has been pivotal, with leading platforms reporting user engagement growth of over 14% year-over-year. The driver partner ecosystem operates within a challenging gig economy model, necessitating stringent driver background checks and user authentication for security.
- Strategic boardroom decisions are increasingly focused on capital-intensive shifts toward sustainable shared mobility, including low-emission vehicles and electric vehicle fleets, which involves significant investment in fleet management. This move is a direct response to both regulatory pressure and consumer demand for eco-friendly options, tracked via carbon footprint tracking.
- As the market evolves, advanced user safety features and trip verification are standard, while the long-term potential of autonomous vehicle deployment remains a key area of R&D. The competitive landscape compels continuous innovation, leveraging predictive demand analytics and application programming interfaces for superior multimodal integration across e-hailing, carpooling platforms, and station-based mobility.
- This is how firms build a network effect and manage everything from surge pricing systems to last-mile connectivity.
What are the Key Data Covered in this France Ridesharing Market Research and Growth Report?
-
What is the expected growth of the France Ridesharing Market between 2026 and 2030?
-
USD 4.89 billion, at a CAGR of 16.6%
-
-
What segmentation does the market report cover?
-
The report is segmented by Service (E-hailing, and Station-based), Vehicle Type (Car and vans, and Two-wheelers), Connectivity (Short distance, and Long distance) and Geography (Europe)
-
-
Which regions are analyzed in the report?
-
Europe
-
-
What are the key growth drivers and market challenges?
-
Digital platform optimization and smart mobility integration, Regulatory and legal challenges
-
-
Who are the major players in the France Ridesharing Market?
-
Blacklane GmbH, Bolt Technology OU, Caocao Mobility Paris, CarpoolWorld inc., Citygo, Comuto SA, France Taxi SAS, Groupe Rousselet, Heetch, Karos Mobility, Lyft Inc., MyEcoCar, Public In Motion GmbH, QRyde, Rezo Pouce, Transopco UK Ltd. and Uber Technologies Inc.
-
Market Research Insights
- Market dynamics are shaped by a strategic push for greater urban transport efficiency and integrated urban mobility solutions. Platforms are evolving beyond simple ride-hailing to become comprehensive transportation network companies, with some achieving a 25% improvement in shared vehicle utilization through advanced demand-responsive transport algorithms.
- The emphasis on sustainable transport options is evident, as corporate ridesharing programs have enabled businesses to lower employee transit costs by up to 15%. This shift is supported by public-private partnerships focused on enhancing smart city transportation infrastructure.
- The adoption of mobility on demand (MoD) principles is creating more flexible travel options, strengthening the value proposition against personal car ownership and contributing to broader congestion reduction goals.
We can help! Our analysts can customize this france ridesharing market research report to meet your requirements.
 RIA -
RIA - 
