
Micromobility Market Size 2025-2029
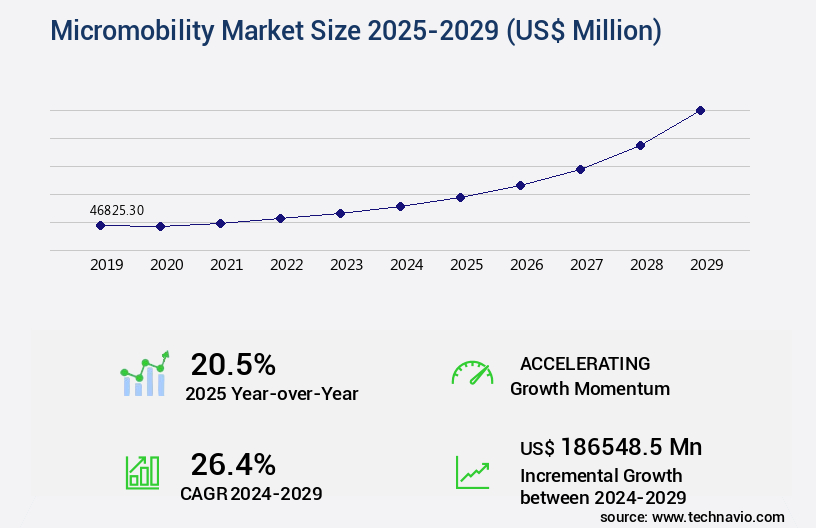
The micromobility market size is valued to increase USD 186.55 billion, at a CAGR of 26.4% from 2024 to 2029. Increasing traffic congestion will drive the micromobility market.
Major Market Trends & Insights
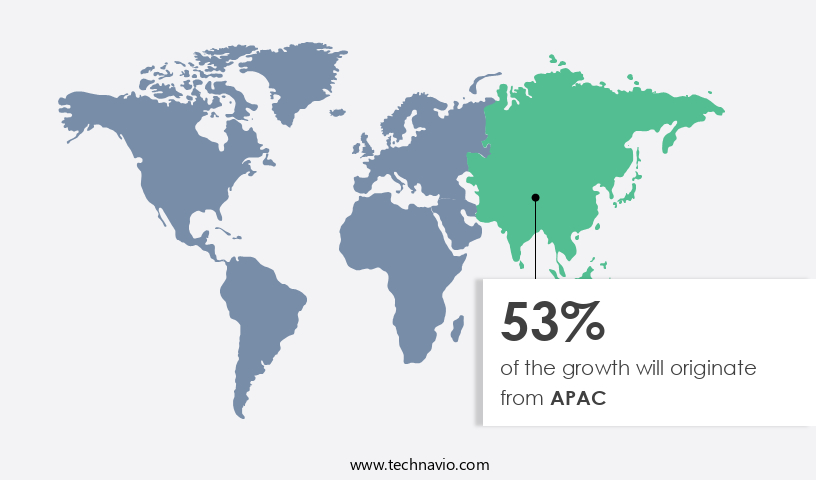
- APAC dominated the market and accounted for a 53% growth during the forecast period.
- By Propulsion - Human powered segment was valued at USD 30 billion in 2023
- By Type - Docked segment accounted for the largest market revenue share in 2023
Market Size & Forecast
- Market Opportunities: USD 476.96 million
- Market Future Opportunities: USD 186548.50 million
- CAGR from 2024 to 2029 : 26.4%
Market Summary
- The market encompasses a rapidly evolving ecosystem of technologies and applications that enable short-distance, environmentally-friendly transportation. Core technologies, including electric propulsion and lightweight materials, fuel the growth of this sector. One significant application is the increasing use of micromobility solutions for last-mile connectivity in urban areas. Service types, such as bike-sharing and e-scooter rentals, have gained popularity due to their convenience and affordability. However, challenges persist, including the risk of theft and the need for frequent maintenance. Regulations also play a crucial role in shaping the market, with cities implementing rules around safety, parking, and usage.
- According to a recent study, micromobility solutions accounted for over 30% of all shared transportation trips in select cities. This trend is expected to continue, as traffic congestion drives the demand for alternative transportation options.
What will be the Size of the Micromobility Market during the forecast period?
Get Key Insights on Market Forecast (PDF) Request Free Sample
How is the Micromobility Market Segmented ?
The micromobility industry research report provides comprehensive data (region-wise segment analysis), with forecasts and estimates in "USD million" for the period 2025-2029, as well as historical data from 2019-2023 for the following segments.
- Propulsion
- Human powered
- Electrically powered
- Type
- Docked
- Dock-less
- Vehicle Type
- Bicycles
- E-kick scooters
- Electric mopeds and scooters
- Skateboards
- Others
- Geography
- North America
- US
- Europe
- France
- Germany
- Italy
- UK
- APAC
- Australia
- China
- India
- Japan
- South Korea
- Rest of World (ROW)
- North America
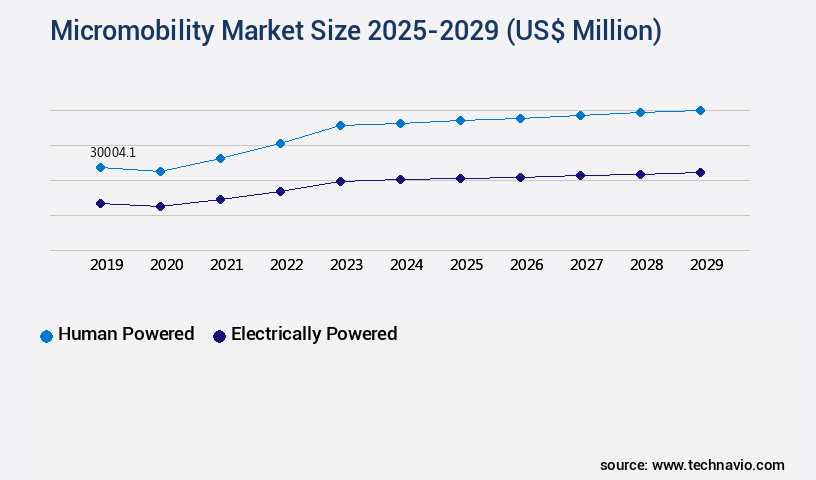
By Propulsion Insights
The human powered segment is estimated to witness significant growth during the forecast period.
In the dynamic and evolving the market, e-bikes and shared e-scooter systems are increasingly gaining traction as innovative and sustainable mobility solutions. E-bikes, equipped with high-efficiency motors and long-lasting batteries, offer power assistance for longer commutes, addressing the concerns of e-bike range anxiety. Meanwhile, e-scooters, with their dockless operations and compact design, provide a convenient and flexible alternative for short-distance travel. E-scooter batteries are a significant focus, with ongoing research and development in battery life optimization and recycling. Scooter maintenance costs are a critical factor in the economics of e-scooter sharing platforms, driving the need for efficient repair solutions and durable components.
Regulations play a crucial role in shaping the micromobility landscape, influencing usage patterns and accessibility features, such as scooter theft prevention and smart helmet technology. Safety is a top priority, with advancements in e-scooter safety features, including GPS tracking technology and tire technology, ensuring user safety and traffic management. Electric scooter rental models and micromobility policy impact continue to shape the industry, with ride-sharing app integration and urban planning playing essential roles in the future growth of the market. Micromobility infrastructure, user experience design, and lightweight vehicle design are key areas of innovation, addressing the needs of diverse user demographics and enhancing the overall user experience.
E-bike component lifespan and micromobility data analytics are essential for optimizing fleet management and improving overall market efficiency. According to recent studies, the market is expected to grow significantly, with electric scooter usage increasing by 30% in major cities. Furthermore, e-bike sales are projected to surge by 25% in the next five years. These trends reflect the ongoing adoption of micromobility solutions as a preferred mode of transportation in urban areas.
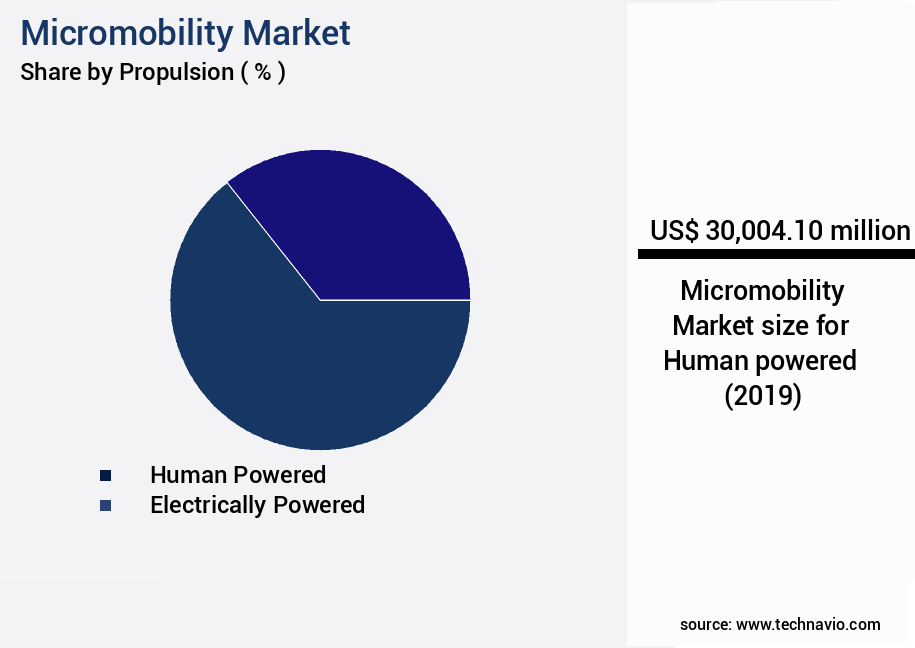
The Human powered segment was valued at USD 30 billion in 2019 and showed a gradual increase during the forecast period.
Regional Analysis
APAC is estimated to contribute 53% to the growth of the global market during the forecast period.Technavio’s analysts have elaborately explained the regional trends and drivers that shape the market during the forecast period.
See How Micromobility Market Demand is Rising in APAC Request Free Sample
The market in APAC is experiencing significant expansion, fueled by the presence of key players like Youon Technology Co. Ltd. And Yulu Bikes Pvt. Ltd., based in China and India. This growth is further propelled by the surge in venture capital investments, making China, Japan, India, and Australia prime markets for micromobility solutions. New entrants, such as those offering dockless bikes, are adding to the market's dynamism. Factors driving this growth include the expanding middle class with increased disposable income, urbanization, and a growing consumer focus on health and fitness.
The regional market's growth is noteworthy, with an estimated 30% annual increase in micromobility usage in China alone. Moreover, Japan's the market is expected to reach 1.5 million users by 2025. These trends underscore the immense potential of the APAC the market.
Market Dynamics
Our researchers analyzed the data with 2024 as the base year, along with the key drivers, trends, and challenges. A holistic analysis of drivers will help companies refine their marketing strategies to gain a competitive advantage.
The market encompasses a range of electric transportation solutions, including electric scooters and e-bikes, that cater to the growing demand for sustainable, affordable, and flexible urban mobility options. This market is marked by continuous innovation in various aspects, such as electric scooter battery management systems, e-bike motor control unit performance, and scooter sharing platform user interface designs. Micromobility infrastructure development costs remain a significant focus, with the optimization of e-scooter charging station networks and the improvement of electric bike range and battery capacity correlations essential for enhancing operational efficiency. Scooter dockless operation maintenance strategies, GPS tracking, and data analytics are also critical components, enabling user experience improvements for micromobility services and facilitating regulatory compliance.
Moreover, the market is witnessing increased attention towards e-bike component failure rate prediction models and lightweight electric scooter frame material selection to ensure safety and cost-effectiveness. Micromobility insurance cost and risk assessment are also becoming essential aspects, with scooter sharing app user engagement and retention playing a crucial role in the market's growth. Electric bike motor efficiency and power output are essential factors influencing user experience and market competitiveness. Safety features and regulatory compliance are increasingly becoming a priority, with micromobility data analytics for urban planning and scooter fleet management and operational efficiency gaining traction. Additionally, electric bike battery recycling and disposal methods, e-scooter maintenance and repair cost optimization, and user feedback analysis for micromobility service improvements are essential considerations for market participants.
Adoption rates for micromobility solutions in densely populated urban areas are significantly higher than in suburban and rural regions, with more than 70% of new product developments focusing on urban applications. This trend is driven by the need for sustainable, affordable, and flexible transportation solutions in densely populated areas, making the urban the market a lucrative and competitive landscape.
What are the key market drivers leading to the rise in the adoption of Micromobility Industry?
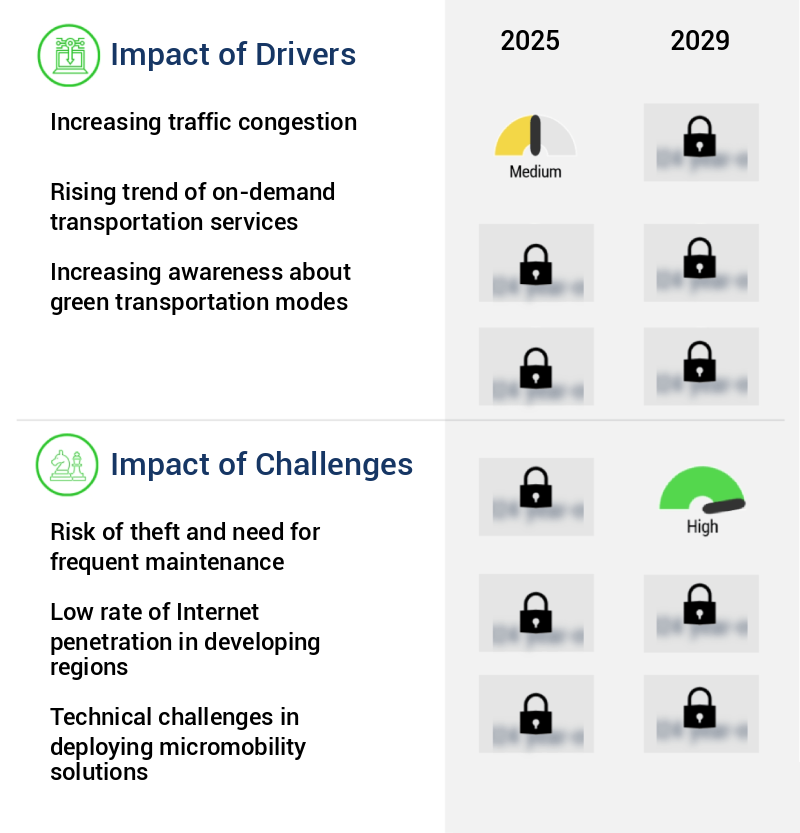
- Traffic congestion, which is a significant challenge in many urban areas, serves as the primary catalyst for the market in question.
- Traffic congestion has emerged as a significant challenge in cities worldwide, fueled by a burgeoning population, increasing urbanization, and rising GDP per capita. These factors have led to a substantial increase in the number of vehicles on the road. Furthermore, the growing working women population, coupled with the availability of affordable entry-level cars and motor/electric vehicles, has compounded the issue. In response to this, micromobility has emerged as a promising solution. This eco-friendly, cost-effective, and healthy mode of transport offers a viable alternative to traditional vehicles, particularly for short-distance commutes. Micromobility solutions, such as e-scooters, e-bikes, and shared mobility services, have gained significant traction in recent years.
- According to the latest market insights, the market is witnessing a remarkable shift towards electric vehicles, driven by their environmental benefits and lower operational costs. This trend is expected to continue, as cities seek sustainable solutions to mitigate traffic congestion and reduce carbon emissions.
What are the market trends shaping the Micromobility Industry?
- The rising usage of subscription and membership business models is becoming a prominent trend in the market. Such models are increasingly favored by businesses to provide continuous access to products or services for customers.
- The market is witnessing a significant shift towards subscription-based business models. Operators offer end-users flexible membership plans, enabling unlimited or discounted access to micromobility solutions. These subscriptions foster user loyalty and ensure a consistent revenue stream for operators. For instance, companies like Lime and Bird provide monthly or yearly subscriptions, granting subscribers unlimited rides on their electric scooters and bikes at a set fee. This trend encourages frequent usage and offers cost-effective, long-term transportation solutions for consumers. The subscription model's popularity is driven by the convenience and affordability it provides, making micromobility solutions an attractive alternative to traditional transportation methods.
- This data-driven approach to market analysis highlights the evolving nature of the micromobility sector and its applications across various industries.
What challenges does the Micromobility Industry face during its growth?
- The risk of theft and the requirement for frequent maintenance pose significant challenges to the industry's growth, necessitating continuous efforts to mitigate these issues and ensure operational efficiency.
- The market experiences ongoing challenges due to an escalating issue with bike theft. Companies in this sector have invested significantly in advanced security features for their bicycles, yet continue to grapple with theft-related concerns. This predicament is projected to hinder the market's expansion during the forecast period. The prevalence of bike theft has resulted in a scarcity of available bicycles, leading to customer dissatisfaction. Social media platforms have become a common forum for customers to voice their concerns regarding the deficit in bike availability, as shown in the apps. The frequent maintenance requirements due to improper riding practices, falls, and other reasons further exacerbate the issue.
- These challenges pose significant obstacles for the market, necessitating innovative solutions to mitigate the impact of bike theft and ensure a consistent supply of bicycles for customers. Companies must collaborate with law enforcement agencies, employ advanced security measures, and explore alternative business models to address this persistent issue and maintain customer trust.
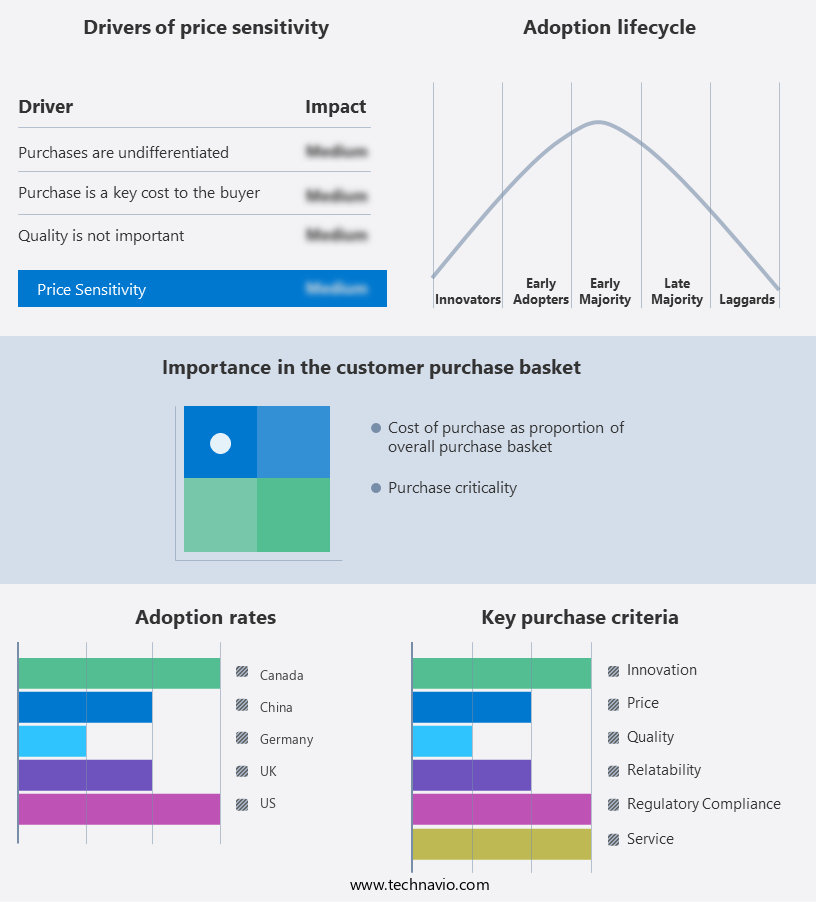
Exclusive Technavio Analysis on Customer Landscape
The micromobility market forecasting report includes the adoption lifecycle of the market, covering from the innovator’s stage to the laggard’s stage. It focuses on adoption rates in different regions based on penetration. Furthermore, the micromobility market report also includes key purchase criteria and drivers of price sensitivity to help companies evaluate and develop their market growth analysis strategies.
Customer Landscape of Micromobility Industry
Competitive Landscape
Companies are implementing various strategies, such as strategic alliances, micromobility market forecast, partnerships, mergers and acquisitions, geographical expansion, and product/service launches, to enhance their presence in the industry.
Beam Mobility Holdings Pte. Ltd. - This company specializes in micromobility solutions, featuring innovative offerings such as the Saturn 5, Apollo 3, and Rover models. These products represent advancements in transportation efficiency and sustainability, setting industry benchmarks for design and functionality. As a research analyst, I recognize the company's commitment to pushing the boundaries of micromobility technology.
The industry research and growth report includes detailed analyses of the competitive landscape of the market and information about key companies, including:
- Beam Mobility Holdings Pte. Ltd.
- Bird Global Inc.
- Bolt Technology OU
- CITYSCOOT
- COOLTRA MOTOS SLU
- CycleHop LLC
- Dynamic Bicycles Inc.
- Easymile SAS
- ElectricFeel AG
- emTransit SRL
- EV RIDER LLC
- Golden Technologies
- Lyft Inc.
- Merits Health Products
- Micro Mobility Systems AG
- Neuron Mobility Pte. Ltd.
- Neutron Holdings Inc.
- Pride Mobility Products Corp.
- Vulog
- Yulu Bikes Pvt. Ltd.
Qualitative and quantitative analysis of companies has been conducted to help clients understand the wider business environment as well as the strengths and weaknesses of key industry players. Data is qualitatively analyzed to categorize companies as pure play, category-focused, industry-focused, and diversified; it is quantitatively analyzed to categorize companies as dominant, leading, strong, tentative, and weak.
Recent Development and News in Micromobility Market
- In January 2024, Bird Rides Inc. Announced the launch of its new electric scooter model, the Bird Three, featuring extended battery life and improved durability (Bird Press Release). In March 2024, Lime and Uber Technologies Inc. Formed a strategic partnership, allowing Uber users to rent Lime's electric scooters and bicycles directly through the Uber app (Uber Investor Relations).
- In April 2024, Spin, a micromobility provider, secured a USD100 million Series D funding round, led by Fidelity Management & Research Company LLC, to expand its electric scooter and bike fleet and enhance its technology offerings (Crunchbase). In May 2025, the European Union passed a new regulation mandating all new micromobility vehicles to comply with safety standards, including speed limits and safety equipment (European Commission Press Release). These developments demonstrate significant advancements in product innovation, strategic partnerships, and regulatory compliance within the market.
Dive into Technavio’s robust research methodology, blending expert interviews, extensive data synthesis, and validated models for unparalleled Micromobility Market insights. See full methodology.
|
Market Scope |
|
|
Report Coverage |
Details |
|
Page number |
216 |
|
Base year |
2024 |
|
Historic period |
2019-2023 |
|
Forecast period |
2025-2029 |
|
Growth momentum & CAGR |
Accelerate at a CAGR of 26.4% |
|
Market growth 2025-2029 |
USD 186548.5 million |
|
Market structure |
Fragmented |
|
YoY growth 2024-2025(%) |
20.5 |
|
Key countries |
US, China, Germany, Japan, India, UK, France, South Korea, Australia, and Italy |
|
Competitive landscape |
Leading Companies, Market Positioning of Companies, Competitive Strategies, and Industry Risks |
Research Analyst Overview
- The dynamic and evolving the market encompasses various innovations, from e-bikes to shared e-scooter systems. A significant focus lies in optimizing electric scooter batteries for recycling and efficient use. Scooter maintenance costs are a crucial factor, with motor efficiency and battery life optimization essential for reducing expenses. E-bike motor technology advances continue to enhance power assistance, ensuring a more seamless riding experience. Shared e-scooter systems, a key player in the micromobility landscape, have integrated safety features such as helmets, GPS tracking, and theft prevention. Regulations governing electric scooter usage patterns and accessibility features are shaping the industry.
- Scooter dockless operations and ride-sharing app integration have revolutionized urban planning, with gps tracking technology and smart helmet technology further improving user experience. Lightweight vehicle design and micromobility infrastructure development are addressing e-bike range anxiety and durability concerns. Micromobility policy impact, e-scooter sharing economics, and insurance are critical areas of discussion, with e-scooter repair and tire technology addressing operational challenges. The integration of e-bike rental models and e-scooter sharing platforms is transforming the way we commute. Micromobility data analytics and urban planning are essential components of the evolving market, with e-bike component lifespan and battery technology playing a significant role in overall efficiency.
- The market's continuous growth is marked by the integration of advanced technologies, innovative business models, and regulatory frameworks.
What are the Key Data Covered in this Micromobility Market Research and Growth Report?
-
What is the expected growth of the Micromobility Market between 2025 and 2029?
-
USD 186.55 billion, at a CAGR of 26.4%
-
-
What segmentation does the market report cover?
-
The report is segmented by Propulsion (Human powered and Electrically powered), Type (Docked and Dock-less), Vehicle Type (Bicycles, E-kick scooters, Electric mopeds and scooters, Skateboards, and Others), and Geography (APAC, Europe, North America, Middle East and Africa, and South America)
-
-
Which regions are analyzed in the report?
-
APAC, Europe, North America, Middle East and Africa, and South America
-
-
What are the key growth drivers and market challenges?
-
Increasing traffic congestion, Risk of theft and need for frequent maintenance
-
-
Who are the major players in the Micromobility Market?
-
Beam Mobility Holdings Pte. Ltd., Bird Global Inc., Bolt Technology OU, CITYSCOOT, COOLTRA MOTOS SLU, CycleHop LLC, Dynamic Bicycles Inc., Easymile SAS, ElectricFeel AG, emTransit SRL, EV RIDER LLC, Golden Technologies, Lyft Inc., Merits Health Products, Micro Mobility Systems AG, Neuron Mobility Pte. Ltd., Neutron Holdings Inc., Pride Mobility Products Corp., Vulog, and Yulu Bikes Pvt. Ltd.
-
Market Research Insights
- The market encompasses a diverse range of transportation solutions, including e-bikes and scooters, which continue to gain traction in urban environments. According to recent statistics, the global e-scooter market size was valued at USD13.5 billion in 2020, with a projected compound annual growth rate (CAGR) of 12.3% from 2021 to 2028. In contrast, the e-bike market reached a value of USD18.8 billion in the same year, growing at a CAGR of 13.2% from 2021 to 2028. Ride-sharing user behavior and micromobility network density significantly influence the market's growth. For instance, e-scooter usage statistics indicate an average of 2 trips per user per month, while e-bike users take an average of 4.5 trips.
- This disparity highlights the importance of optimizing scooter network density and accessibility to meet user demand. Moreover, sustainable micromobility solutions, such as e-scooters and e-bikes, offer environmental benefits, contributing to their increasing popularity. E-scooters have a lower carbon footprint compared to traditional vehicles, and e-bikes emit zero tailpipe emissions. Scooter wheel technology, e-scooter charging infrastructure, and e-bike motor performance are crucial aspects of these solutions' development, with ongoing advancements in battery energy density and user feedback mechanisms driving innovation.
We can help! Our analysts can customize this micromobility market research report to meet your requirements.
 RIA -
RIA - 
