Fresh Herbs Market Size 2026-2030
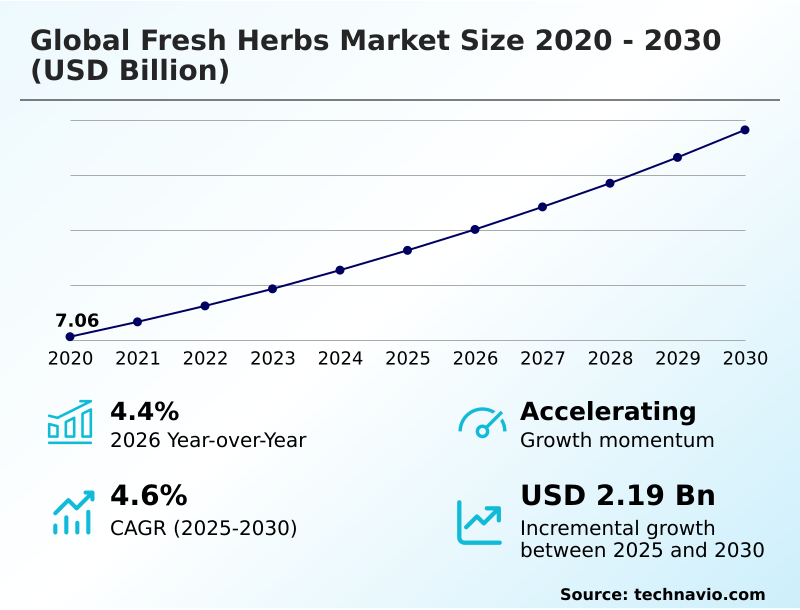
The Fresh Herbs Market size was valued at USD 8.63 billion in 2025, growing at a CAGR of 4.6% during the forecast period 2026-2030.
Major Market Trends & Insights
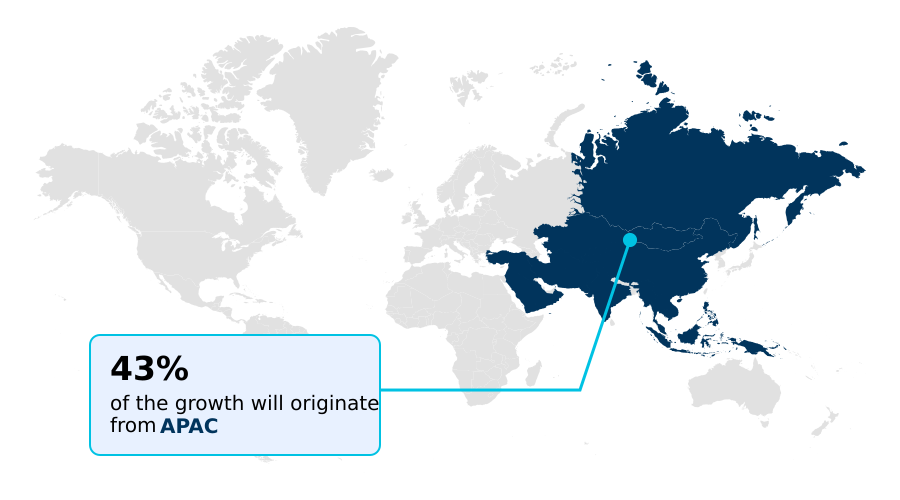
- APAC dominated the market and accounted for a 42.7% growth during the forecast period.
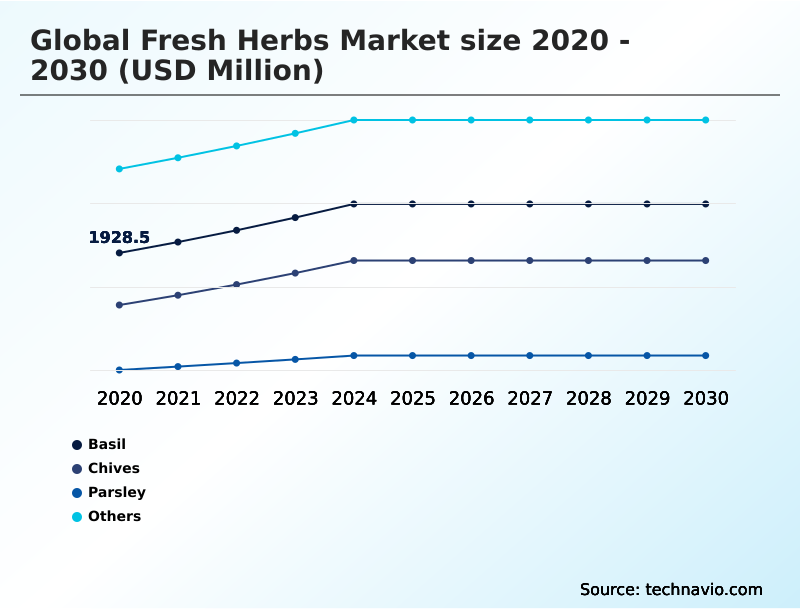
- By Type - Basil segment was valued at USD 2.31 billion in 2024
- By Product Type - Conventional segment accounted for the largest market revenue share in 2024
Market Size & Forecast
- Historic Market Opportunities 2020-2024: USD 3.76 billion
- Market Future Opportunities 2025-2030: USD 2.19 billion
- CAGR from 2025 to 2030 : 4.6%
Market Summary
- The fresh herbs market is characterized by a significant shift toward technology-driven cultivation, with controlled environment agriculture now accounting for over 40% of new production capacity. This transition addresses the dual need for year-round availability and consistent quality, where indoor farming systems have been shown to use up to 90% less water than traditional field farming.
- A key driver is the increasing adoption of precision farming, which optimizes nutrient delivery and improves crop yields. For instance, a typical operational scenario involves using automated fertigation systems to manage the precise nutrient inputs for basil, enhancing its essential oil content.
- However, the industry grapples with the challenge of a short shelf life, which can lead to significant post-harvest losses. This perishable nature necessitates sophisticated cold chain logistics, from producer to retailer, to maintain product freshness and value, impacting overall supply chain costs and efficiency.
What will be the Size of the Fresh Herbs Market during the forecast period?
Get Key Insights on Market Forecast (PDF) Request Free Sample
How is the Fresh Herbs Market Segmented?
The fresh herbs industry research report provides comprehensive data (region-wise segment analysis), with forecasts and analysis for the period 2026-2030, as well as historical data from 2020-2024 for the following segments.
- Type
- Basil
- Chives
- Parsley
- Others
- Product type
- Conventional
- Organic
- End-user
- Food service
- Retail
- Geography
- APAC
- China
- Japan
- India
- Europe
- Germany
- UK
- France
- North America
- US
- Canada
- Mexico
- Middle East and Africa
- Saudi Arabia
- UAE
- South Africa
- South America
- Brazil
- Argentina
- Rest of World (ROW)
- APAC
How is the Fresh Herbs Market Segmented by Type?
The basil segment is estimated to witness significant growth during the forecast period.
The basil segment, representing approximately 32% of the fresh herbs market, is primarily driven by its widespread use as a culinary seasoning in global cuisines.
The adoption of high-density hydroponic systems has significantly boosted production efficiency, with some operations reporting a 100% increase in growth rates compared to traditional soil-based methods.
This technological shift is pivotal for maintaining a consistent supply of natural flavor enhancers for the foodservice sector. Innovations in developing downy-mildew-resistant cultivars have also been critical, reducing potential crop losses by over 50% in affected regions.
The segment's expansion is further supported by controlled environment agriculture techniques that optimize the phytochemical content, meeting consumer demand for high-quality, aromatic basil year-round.
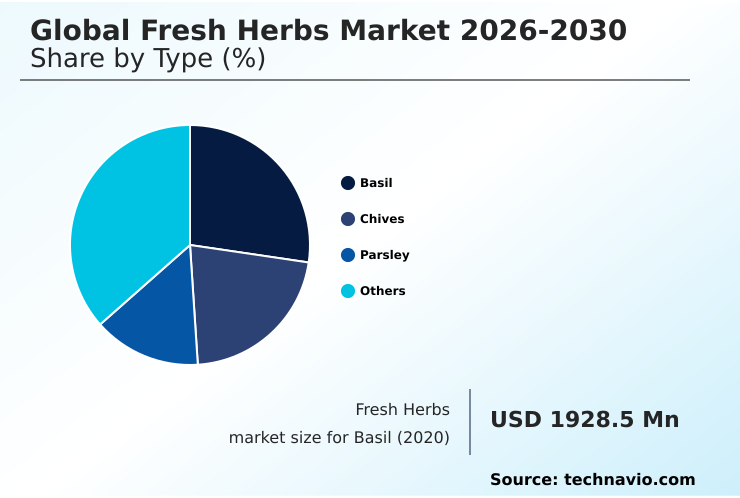
The Basil segment was valued at USD 2.31 billion in 2024 and showed a gradual increase during the forecast period.
How demand for the Fresh Herbs market is rising in the leading region?
APAC is estimated to contribute 42.7% to the growth of the global market during the forecast period.Technavio’s analysts have elaborately explained the regional trends and drivers that shape the market during the forecast period.
See How Fresh Herbs Market demand is rising in APAC Request Free Sample
The global fresh herbs market's geographic landscape is led by APAC, which is projected to contribute over 42% of the market's incremental growth, outpacing Europe’s growth rate by 0.6 percentage points.
This dominance is driven by deep-rooted culinary traditions and a rising middle class in countries like China and India demanding premium ingredients.
The limited availability of arable land in dense urban areas across APAC has catalyzed the adoption of soil-free cultivation methods, with investment in new climate-intelligent greenhouses increasing by over 20% in the region.
This contrasts with North America, where growth is steady but more focused on expanding retail distribution networks for organic products.
The adoption of soilless cultivation and other sustainable practices is reshaping the region's supply chain infrastructure, enabling producers to supply fresh herbs to urban centers more efficiently.
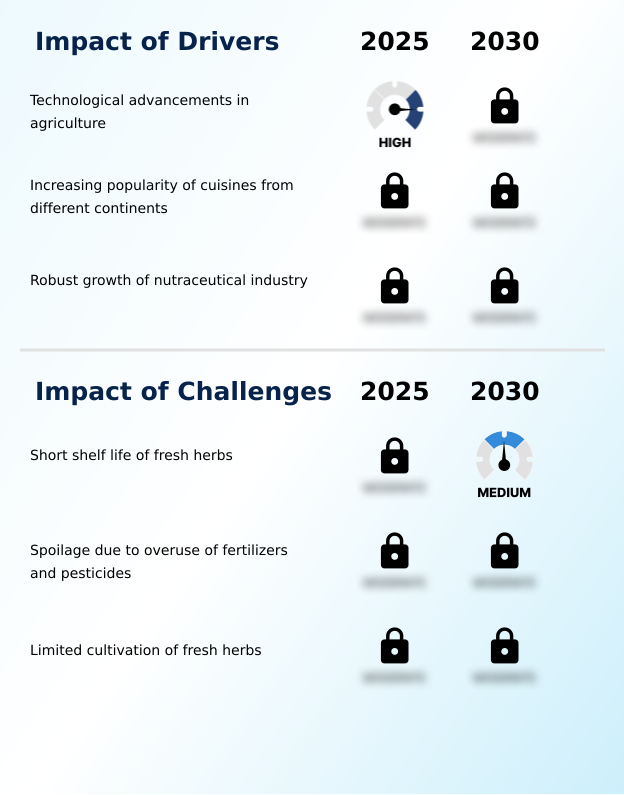
What are the key Drivers, Trends, and Challenges in the Fresh Herbs Market?
Our researchers analyzed the data with 2025 as the base year, along with the key drivers, trends, and challenges. A holistic analysis of drivers will help companies refine their marketing strategies to gain a competitive advantage.
- Understanding the intricacies of the fresh herbs market requires a detailed look into its core operational dynamics and emerging technologies. A primary consideration for new entrants is the impact of vertical farming on fresh herb costs, where initial capital expenditure is high, but long-term operational efficiencies can reduce per-unit production costs by up to 30% compared to conventional methods.
- Concurrently, producers are heavily invested in finding technology to extend fresh herb shelf life, as post-harvest losses can be significant. Innovations in modified atmosphere packaging and edible coatings are showing promise in this area.
- When comparing organic vs conventional herb farming, the market shows a clear bifurcation; while conventional methods dominate volume, the organic segment commands a price premium of 20-40%, driven by consumer demand for clean-label products. Establishing best practices for fresh herb supply chain management is crucial, focusing on minimizing transit times and maintaining an unbroken cold chain.
- However, significant challenges in scaling fresh herb production remain, including high energy consumption in indoor farms and the need for skilled labor, which can constrain rapid expansion despite growing demand.
What are the key market drivers leading to the rise in the adoption of Fresh Herbs Industry?
- Technological advancements in agriculture, particularly in controlled environment and precision farming, are a key driver for the market's growth.
- Technological advancements in controlled environment agriculture are a primary driver, enabling a 30% increase in yield for certain herbs compared to traditional field farming.
- The adoption of precision farming techniques, including automated irrigation and hydroponic systems, has revolutionized production by allowing for year-round cultivation regardless of external climate conditions.
- This has been crucial in stabilizing supply and meeting the consistent demand from food processing and retail sectors.
- By optimizing growing conditions, these technologies not only ensure higher crop quality but also lead to significant crop loss reduction, with some vertical farms reporting wastage rates below 5%.
- The ability to produce high-quality herbs consistently is expanding the market's potential, making fresh herbs a more reliable and profitable agricultural product.
What are the market trends shaping the Fresh Herbs Industry?
- A strong and rising demand from the foodservice and hospitality sectors, which prioritize fresh, natural ingredients, is a significant trend shaping the market.
- A primary trend shaping the market is the surging demand from the foodservice sector, which now accounts for over half of total consumption, a 10% increase over the last five years. This shift is driven by evolving consumer preferences toward clean-label ingredients and authentic culinary traditions that rely on fresh, aromatic herbs.
- As a result, chefs are incorporating a wider variety of premium ingredients, boosting the adoption of indoor urban farming and vertical farming to ensure a consistent, year-round supply. This trend directly impacts supply chains, forcing distributors to handle a more diverse and perishable inventory.
- The move toward freshness has also elevated the importance of a product's sensory profile, with establishments reporting a 15% rise in customer satisfaction when using locally sourced, high-quality herbs.
What challenges does the Fresh Herbs Industry face during its growth?
- The inherently short shelf life of fresh herbs presents a significant challenge that impacts the supply chain and profitability across the market.
- The inherent short shelf life of fresh herbs remains the most significant market challenge, with spoilage causing an estimated 25% loss in value from farm to consumer. This high rate of enzymatic degradation and microbial growth necessitates substantial investment in post-harvest technologies and an unbroken cold chain logistics network.
- The cost of such infrastructure is a major barrier, especially for smaller growers, making it difficult to compete with larger, more capitalized operations. Even with advanced packaging technologies, extending freshness by more than a few days is difficult, leading to high wastage reduction pressures at the retail level.
- Consequently, this core challenge directly limits market expansion by constraining distribution range and increasing operational costs across the supply chain.
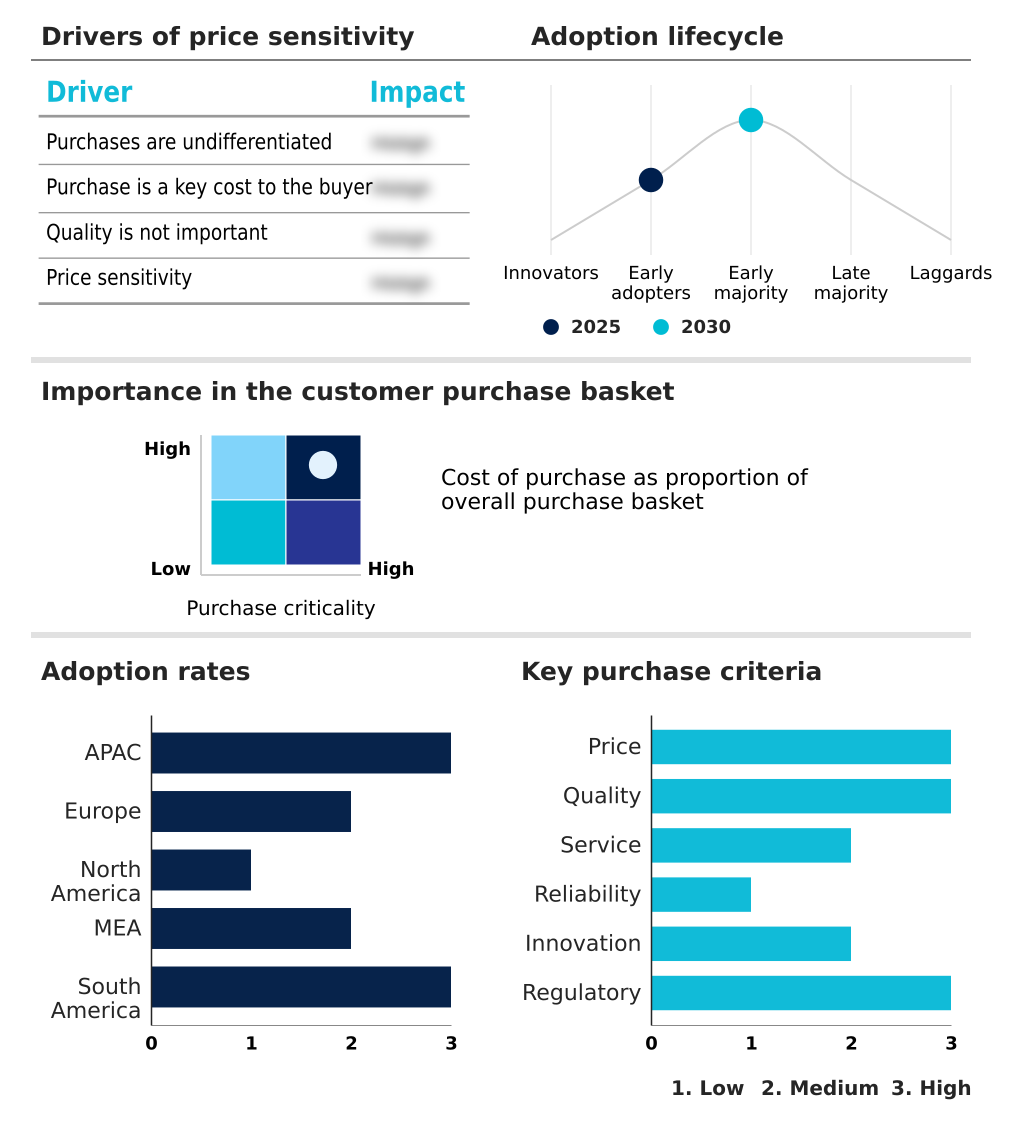
Exclusive Technavio Analysis on Customer Landscape
The fresh herbs market forecasting report includes the adoption lifecycle of the market, covering from the innovator’s stage to the laggard’s stage. It focuses on adoption rates in different regions based on penetration. Furthermore, the fresh herbs market report also includes key purchase criteria and drivers of price sensitivity to help companies evaluate and develop their market growth analysis strategies.
Customer Landscape of Fresh Herbs Industry
Competitive Landscape
Companies are implementing various strategies, such as strategic alliances, fresh herbs market forecast, partnerships, mergers and acquisitions, geographical expansion, and product/service launches, to enhance their presence in the industry.
80 Acres Farms - Key offerings include a variety of fresh herbs and microgreens, such as basil and arugula, cultivated through sustainable, automated indoor farming to ensure consistent quality.
The industry research and growth report includes detailed analyses of the competitive landscape of the market and information about key companies, including:
- 80 Acres Farms
- AeroFarms LLC
- Babe Farms Inc.
- BrightFarms Inc.
- Dole plc
- Farm.One Inc.
- Fresh Del Monte Produce Inc
- Fresh Origins
- Gotham Greens Holdings LLC
- Indoor Urban Farming GmbH
- Jones Food Co
- Living Earth Farm
- Living Herbs LLC
- Monterey Bay Herb Co.
- Mucci Intl Mrktg Inc.
- Plenty Unlimited Inc.
- Rocket Farms Inc.
- Soli Organic Inc.
- Taylor Fresh Foods Inc.
- Vitacress
Qualitative and quantitative analysis of companies has been conducted to help clients understand the wider business environment as well as the strengths and weaknesses of key industry players. Data is qualitatively analyzed to categorize companies as pure play, category-focused, industry-focused, and diversified; it is quantitatively analyzed to categorize companies as dominant, leading, strong, tentative, and weak.
Market Intelligence Radar: High-Impact Developments & Growth Signals
- In the Agricultural Products and Services industry, the widespread adoption of vertical farming and controlled environment agriculture has been pivotal. This trend directly benefits the fresh herbs market by enabling year-round production of high-value, perishable items, thereby mitigating supply chain volatility and improving operational efficiency for producers.
- The increasing integration of precision farming technologies, including automated irrigation and AI-driven plant health monitoring, is transforming cultivation practices. For the fresh herbs market, this leads to enhanced crop quality and a significant reduction in agricultural inputs, aligning with consumer preferences for sustainable practices.
- There is a growing emphasis on developing robust cold chain logistics and advanced packaging technologies to minimize spoilage of perishable goods. This development is critical for the fresh herbs market, as it supports shelf-life extension and reduces wastage during transit, enabling broader retail distribution.
- A significant push toward sustainable and organic farming methods is reshaping production standards across the agricultural sector. This shift directly impacts the fresh herbs market by increasing demand for certified organic products and driving investments in integrated pest management and other eco-friendly cultivation techniques.
Dive into Technavio’s robust research methodology, blending expert interviews, extensive data synthesis, and validated models for unparalleled Fresh Herbs Market insights. See full methodology.
| Market Scope | |
|---|---|
| Page number | 279 |
| Base year | 2025 |
| Historic period | 2020-2024 |
| Forecast period | 2026-2030 |
| Growth momentum & CAGR | Accelerate at a CAGR of 4.6% |
| Market growth 2026-2030 | USD 2192.7 million |
| Market structure | Fragmented |
| YoY growth 2025-2026(%) | 4.4% |
| Key countries | China, Japan, India, South Korea, Australia, Indonesia, Germany, UK, France, Italy, Spain, The Netherlands, US, Canada, Mexico, Saudi Arabia, UAE, South Africa, Israel, Turkey, Brazil, Argentina and Chile |
| Competitive landscape | Leading Companies, Market Positioning of Companies, Competitive Strategies, and Industry Risks |
Research Analyst Overview
- The fresh herbs market ecosystem involves a complex interplay of stakeholders, with indoor farming technology providers enabling over 60% of new production capacity. These suppliers provide essential systems like automated irrigation and smart spectral LED lighting to growers, who represent the core producers.
- The value chain progresses through distributors who manage complex cold chain logistics to mitigate spoilage, which can reduce product value by 25% if not handled correctly. The output reaches end-users through two primary channels: the foodservice sector, which demands consistent quality for culinary applications, and retail distribution, where consumer preferences for packaging and organic certification are paramount.
- Regulatory bodies influence the market by setting food safety mandates, while R&D entities focus on developing hardier, more flavorful plant varieties, ensuring the industry's continued innovation and growth.
What are the Key Data Covered in this Fresh Herbs Market Research and Growth Report?
-
What is the expected growth of the Fresh Herbs Market between 2026 and 2030?
-
The Fresh Herbs Market is expected to grow by USD 2.19 billion during 2026-2030, registering a CAGR of 4.6%. Year-over-year growth in 2026 is estimated at 4.4%%. This acceleration is shaped by technological advancements in agriculture, which is intensifying demand across multiple end-use verticals covered in the report.
-
-
What segmentation does the market report cover?
-
The report is segmented by Type (Basil, Chives, Parsley, and Others), Product Type (Conventional, and Organic), End-user (Food service, and Retail) and Geography (APAC, Europe, North America, Middle East and Africa, South America). Among these, the Basil segment is estimated to witness significant growth during the forecast period, driven by rising adoption across key application areas. Each segment includes detailed qualitative and quantitative analysis, along with historical data from 2020-2024 and forecasts through 2030 with year-over-year growth rates.
-
-
Which regions are analyzed in the report?
-
The report covers APAC, Europe, North America, Middle East and Africa and South America. APAC is estimated to contribute 42.7% to market growth during the forecast period. Country-level analysis includes China, Japan, India, South Korea, Australia, Indonesia, Germany, UK, France, Italy, Spain, The Netherlands, US, Canada, Mexico, Saudi Arabia, UAE, South Africa, Israel, Turkey, Brazil, Argentina and Chile, with dedicated market size tables and year-over-year growth for each.
-
-
What are the key growth drivers and market challenges?
-
The primary driver is technological advancements in agriculture, which is accelerating investment and industry demand. The main challenge is short shelf life of fresh herbs, creating operational barriers for key market participants. The report quantifies the impact of each driver and challenge across 2026 and 2030 with comparative analysis.
-
-
Who are the major players in the Fresh Herbs Market?
-
Key vendors include 80 Acres Farms, AeroFarms LLC, Babe Farms Inc., BrightFarms Inc., Dole plc, Farm.One Inc., Fresh Del Monte Produce Inc, Fresh Origins, Gotham Greens Holdings LLC, Indoor Urban Farming GmbH, Jones Food Co, Living Earth Farm, Living Herbs LLC, Monterey Bay Herb Co., Mucci Intl Mrktg Inc., Plenty Unlimited Inc., Rocket Farms Inc., Soli Organic Inc., Taylor Fresh Foods Inc. and Vitacress. The report provides qualitative and quantitative analysis categorizing companies as dominant, leading, strong, tentative, and weak based on their market positioning. Company profiles include business segment analysis, SWOT assessment, key offerings, and recent strategic developments.
-
Market Research Insights
- The competitive landscape of the fresh herbs market is undergoing significant consolidation, with strategic mergers and acquisitions redefining market positions; post-merger integrations have shown to improve operational efficiency by up to 15%. Prominent players such as 80 Acres Farms have expanded their national reach by acquiring vertical farming assets, while large-scale producers like Taylor Fresh Foods Inc.
- have focused on global expansion through strategic purchases. These moves reflect a broader industry trend toward achieving scale and integrating technology to enhance production. In contrast, some major corporations, including Dole plc and Fresh Del Monte Produce Inc., have divested parts of their fresh produce operations to streamline their business focus.
- This strategic restructuring allows companies to adapt to the primary challenge of managing highly perishable products by investing in localized, technology-driven production to meet consistent consumer demand.
We can help! Our analysts can customize this fresh herbs market research report to meet your requirements.
 RIA -
RIA - 
