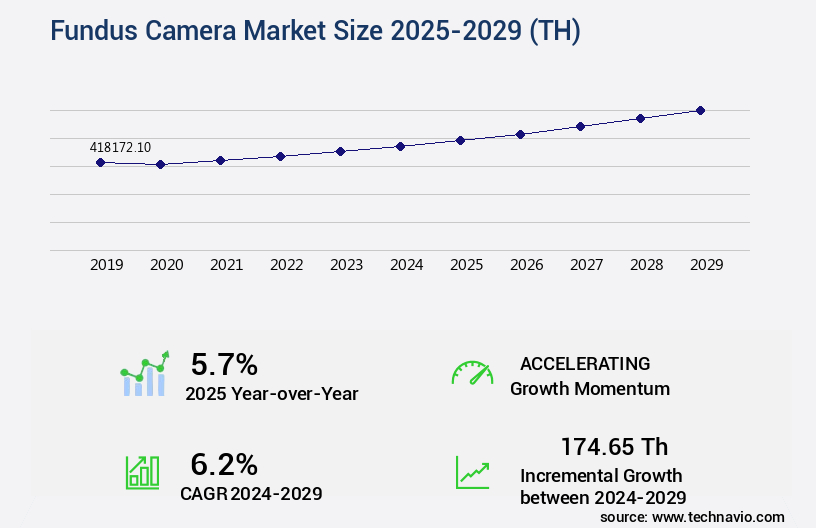
Fundus Camera Market Size 2025-2029
The fundus camera market size is valued to increase by USD 174.65 th, at a CAGR of 6.2% from 2024 to 2029. Rising prevalence of eye diseases will drive the fundus camera market.
Major Market Trends & Insights
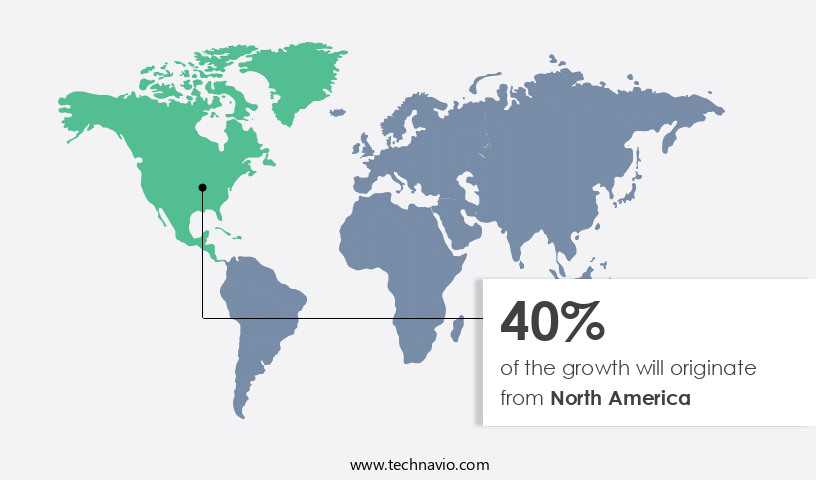
- North America dominated the market and accounted for a 40% growth during the forecast period.
- By Product - Non-mydriatic segment was valued at USD 205,866.10 th in 2023
- By End-user - Hospitals segment accounted for the largest market revenue share in 2023
Market Size & Forecast
- Market Opportunities: USD 59.86 thousand
- Market Future Opportunities: USD 174653.90 thousand
- CAGR from 2024 to 2029: 6.2%
Market Summary
- The market experiences steady expansion, driven by the escalating prevalence of eye diseases and the integration of advanced technologies. The global market for fundus cameras is projected to surpass USD 2.5 billion by 2026. This growth can be attributed to the increasing demand for non-invasive diagnostic tools and the integration of artificial intelligence (AI) into fundus cameras for enhanced image analysis. Despite this promising outlook, the market faces challenges, such as the shortage of skilled workforce to operate and interpret the data generated by these sophisticated devices. To address this issue, manufacturers are investing in user-friendly designs and developing AI algorithms to assist in diagnosis.
- These advancements are expected to broaden the accessibility of fundus cameras, particularly in underserved regions. In summary, the market is poised for continued growth, fueled by the rising burden of eye diseases and technological advancements. The integration of AI is revolutionizing the industry, enabling more accurate and efficient diagnosis. However, the shortage of skilled personnel remains a significant challenge that manufacturers must address to maximize the potential of these innovative tools.
What will be the Size of the Fundus Camera Market during the forecast period?
Get Key Insights on Market Forecast (PDF) Request Free Sample
How is the Fundus Camera Market Segmented?
The fundus camera industry research report provides comprehensive data (region-wise segment analysis), with forecasts and estimates in "USD thousand" for the period 2025-2029, as well as historical data from 2019-2023 for the following segments.
- Product
- Non-mydriatic
- Hybrid fundus cameras
- Mydriatic fundus cameras
- ROP fundus cameras
- End-user
- Hospitals
- Ophthalmology clinics
- Others
- Geography
- North America
- US
- Europe
- France
- Germany
- Italy
- UK
- APAC
- China
- India
- Japan
- South Korea
- South America
- Brazil
- Rest of World (ROW)
- North America
By Product Insights
The non-mydriatic segment is estimated to witness significant growth during the forecast period.
The market continues to evolve, with non-mydriatic fundus cameras gaining significant traction. These innovative devices enable retinal image acquisition without pupil dilation, enhancing patient comfort and convenience. The market's growth can be attributed to the increasing adoption of these user-friendly, rapid imaging devices in clinical and point-of-care settings. Non-mydriatic fundus cameras are particularly indispensable for routine screening procedures, such as diabetic retinopathy examinations, where consistent monitoring is crucial. Advanced technologies, including high-resolution fundus imaging, red-free imaging, and optical coherence tomography, are integrated into these devices, enabling precise retinal pathology diagnosis and macular thickness measurement. Furthermore, automated image analysis, retinal vessel segmentation, and disease progression monitoring are facilitated through sophisticated image processing algorithms and Diagnostic Imaging systems.
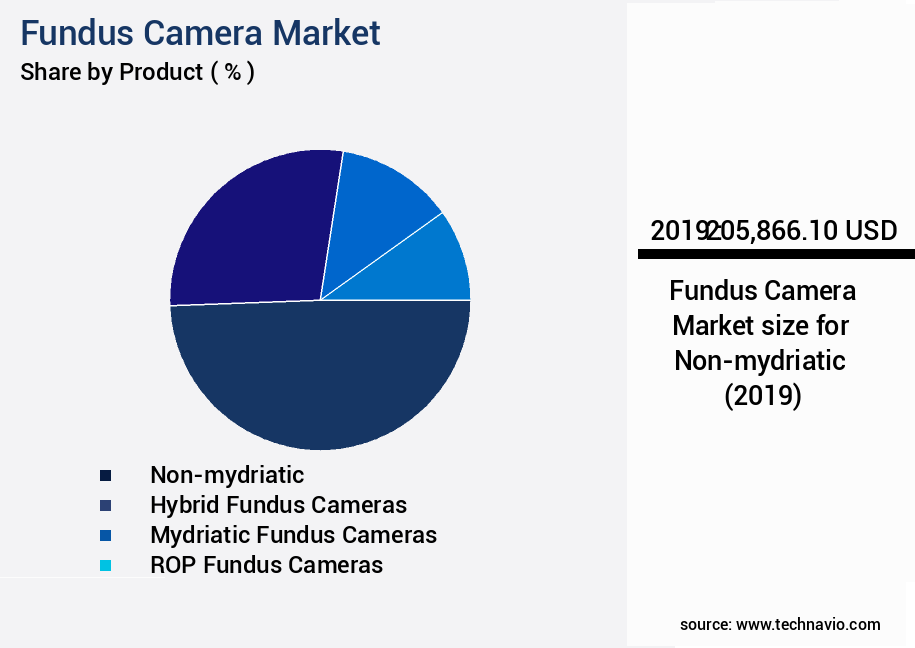
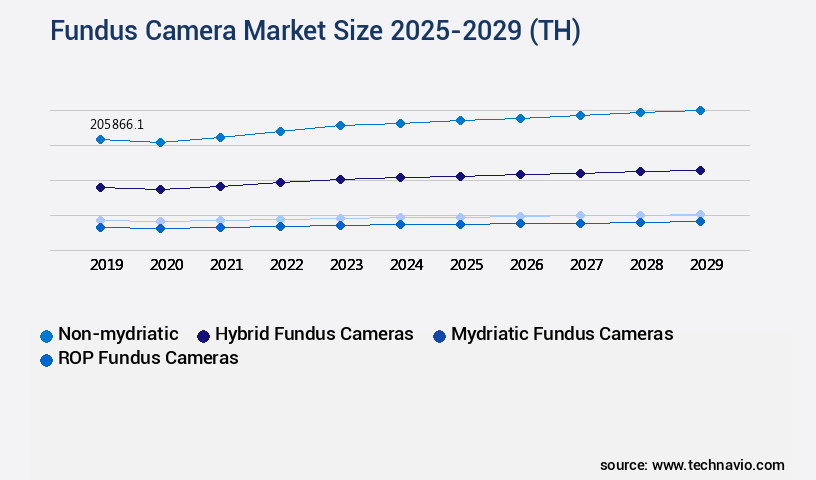
The Non-mydriatic segment was valued at USD 205866.10 th in 2019 and showed a gradual increase during the forecast period.
With teleophthalmology systems and remote diagnostics, non-mydriatic fundus cameras offer increased accessibility, making them a preferred choice for healthcare providers. According to a recent study, non-mydriatic fundus cameras accounted for over 60% of the total fundus camera sales in 2020, underscoring their growing importance in the market.
Regional Analysis
North America is estimated to contribute 40% to the growth of the global market during the forecast period. Technavio's analysts have elaborately explained the regional trends and drivers that shape the market during the forecast period.
See How Fundus Camera Market Demand is Rising in North America Request Free Sample
The market in North America is undergoing steady expansion, fueled by the rising prevalence of eye disorders among the population, particularly those aged 65 and above. According to recent demographic projections, the number of Americans in this age group is projected to surge from approximately 55 million in 2022 to around 80 million by 2050, representing a substantial 47% increase. This demographic shift is expected to significantly impact the total population composition, with the 65-and-older age group's share rising from 17% to 23%.
The aging population's increased susceptibility to age-related eye conditions, such as diabetic retinopathy and glaucoma, is driving the demand for advanced diagnostic tools like fundus cameras. These devices enable early detection and timely intervention, thereby improving patient outcomes and reducing healthcare costs in the long run.
Market Dynamics
Our researchers analyzed the data with 2024 as the base year, along with the key drivers, trends, and challenges. A holistic analysis of drivers will help companies refine their marketing strategies to gain a competitive advantage.
The market is experiencing significant growth due to the increasing demand for advanced retinal imaging technologies. One of the key trends in this market is the development and integration of sophisticated software solutions for retinal image analysis. These tools employ various techniques such as retinal vessel diameter measurement software, automated macular edema detection algorithms, and high-resolution fundus image analysis pipelines. Optic disc assessment using machine learning algorithms is another area of active research, aiming to improve clinical accuracy and efficiency. Clinical validation of retinal image analysis tools is a critical aspect of this market, ensuring the reliability and effectiveness of these technologies. Comparison of fundus camera image quality metrics is another important area of research, with a focus on improving image quality for fundus photography and reducing image artifacts. Integration of fundus imaging with electronic health records and teleophthalmology platforms for fundus image interpretation is also gaining traction, enabling remote diagnosis and monitoring of retinal diseases. Advancements in image processing for retinal disease diagnosis include the development of novel algorithms for retinal image analysis, assessment of image quality in different fundus cameras, and the application of artificial intelligence and Deep Learning models for diabetic retinopathy detection. Image-based biomarkers for retinal diseases are another area of active research, offering potential for early and accurate diagnosis and prognosis. Fundus camera image acquisition protocol optimization and multimodal retinal image fusion techniques are also key areas of focus, ensuring standardization and accuracy in retinal imaging. The market for software for retinal image analysis and quantification is expected to grow significantly, driven by the increasing demand for advanced retinal imaging technologies and the need for more accurate and efficient diagnosis and monitoring of retinal diseases.
What are the key market drivers leading to the rise in the adoption of Fundus Camera Industry?
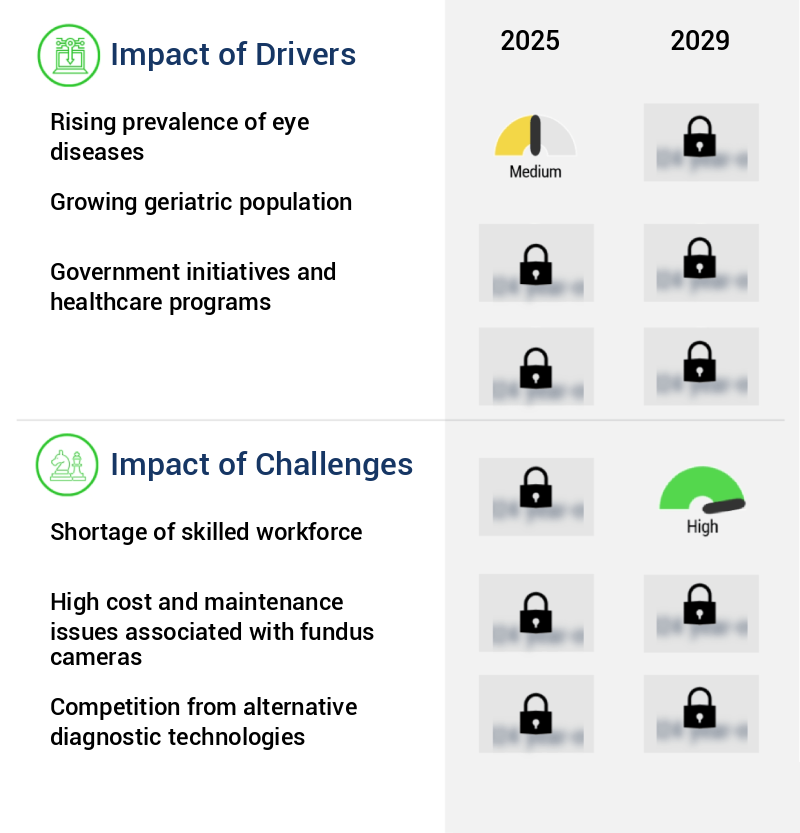
- The increasing prevalence of eye diseases serves as the primary driver for the market's growth.
- The market is experiencing significant growth due to the increasing prevalence of eye diseases and the need for early detection and diagnosis. According to the World Health Organization (WHO), approximately 2.2 billion people worldwide had suffered from near or distant vision impairment as of August 2023, with nearly half of these cases being preventable or undiagnosed. Major causes of distance vision impairment or blindness include cataracts, refractive errors, age-related macular degeneration (AMD), glaucoma, and diabetic retinopathy, collectively affecting over 180 million people.
- Presbyopia, the leading cause of near vision impairment, affects over 826 million individuals. Fundus cameras play a crucial role in the diagnosis and monitoring of these conditions, offering high-resolution images of the retina for accurate assessment. This evolving market presents opportunities for advancements in technology and applications across various sectors, including hospitals, clinics, and diagnostic centers.
What are the market trends shaping the Fundus Camera Industry?
- Artificial intelligence integration is becoming a prominent trend in the market. The implementation of artificial intelligence technology is gaining significance in the field of fundus cameras.
- The integration of artificial intelligence (AI) into fundus cameras signifies a significant trend in the market, fueled by the imperative for automated analysis and early detection of eye diseases. AI-enabled fundus cameras augment diagnostic precision and lessen the burden on ophthalmologists by delivering precise and prompt evaluations. In clinical trials, the Optomed Aurora AEYE, introduced by Optomed Oyj on May 1, 2024, demonstrated a sensitivity of 92%-93% and a specificity of 89%-94% as the first FDA-cleared handheld AI fundus camera for detecting more than mild diabetic retinopathy.
- This non-mydriatic device, designed for use in primary care settings, underscores the potential of AI technology to revolutionize eye care.
What challenges does the Fundus Camera Industry face during its growth?
- The shortage of a skilled workforce poses a significant challenge to the industry's growth trajectory. With an increasing demand for specialized talent, businesses in this sector face intense competition to recruit and retain qualified personnel. This labor market constraint can hinder innovation, productivity, and ultimately, the industry's ability to expand and adapt to market demands.
- The market is experiencing a transformative phase, driven by the integration of artificial intelligence (AI) technology. Advanced fundus cameras equipped with AI capabilities offer enhanced diagnostic accuracy and efficiency, making them indispensable tools in the healthcare industry. However, the market's growth is not without challenges. The shortage of skilled personnel, particularly in developing regions, poses a significant hurdle. Operating these sophisticated devices requires specialized training to ensure accurate image interpretation. In the US, the projected decrease in ophthalmologists by 2,600 by 2035, coupled with an anticipated increase in demand for eye care services by 5,155, underscores the pressing need for more trained ophthalmic professionals.
- This shortfall highlights the importance of investing in training programs and technological advancements to address this issue.
Exclusive Technavio Analysis on Customer Landscape
The fundus camera market forecasting report includes the adoption lifecycle of the market, covering from the innovator's stage to the laggard's stage. It focuses on adoption rates in different regions based on penetration. Furthermore, the fundus camera market report also includes key purchase criteria and drivers of price sensitivity to help companies evaluate and develop their market growth analysis strategies.

Customer Landscape of Fundus Camera Industry
Competitive Landscape
Companies are implementing various strategies, such as strategic alliances, fundus camera market forecast, partnerships, mergers and acquisitions, geographical expansion, and product/service launches, to enhance their presence in the industry.
Allm Inc. - The company provides advanced fundus cameras, such as the CX-1 model, featuring five photography modes: Color, Red-Free, Cobalt, Fluorescein Angiography (FA), and Fundus Autofluorescence (FAF).
The industry research and growth report includes detailed analyses of the competitive landscape of the market and information about key companies, including:
- Allm Inc.
- Canon Inc.
- Carl Zeiss AG
- Chongqing Bio Newvision Medical Equipment Ltd.
- CSO ITALIA
- Epipole Ltd.
- Essilor Instruments USA
- Forus Health Pvt. Ltd.
- Haag Streit AG
- Hongdee Ophthalmic Equipment
- INTUVISION LABS
- Kody Medical Electronics Pvt. Ltd.
- Kowa Co. Ltd.
- Marco
- Mediworks
- New Vision
- NIDEK Co. Ltd.
- Optitech Eye Care
- Optomed Oyj
- PHELCOM
- Remidio Innovative Solutions Pvt. Ltd.
- Revenio Group Oyj
- Topcon Corp.
- VISIONIX USA INC.
- Volk Optical
- Zimed Healthcare Inc.
Qualitative and quantitative analysis of companies has been conducted to help clients understand the wider business environment as well as the strengths and weaknesses of key industry players. Data is qualitatively analyzed to categorize companies as pure play, category-focused, industry-focused, and diversified; it is quantitatively analyzed to categorize companies as dominant, leading, strong, tentative, and weak.
Recent Development and News in Fundus Camera Market
- In January 2024, Topcon Corporation, a leading ophthalmic device manufacturer, announced the launch of its new TRC-NW8 Fundus Camera system, featuring advanced autofocus technology and high-resolution imaging capabilities (Topcon Press Release, 2024).
- In March 2024, Carl Zeiss Meditec AG and Google entered into a strategic partnership to integrate Google's DeepMind Health artificial intelligence technology into Zeiss's fundus cameras for early detection of diseases such as diabetic retinopathy and age-related macular degeneration (Carl Zeiss Meditec AG Press Release, 2024).
- In April 2024, Optos Plc, a UK-based medical device company, raised £ 50 million in a funding round led by Woodford Investment Management to expand its product portfolio and accelerate global growth in the market (Financial Times, 2024).
- In May 2025, the US Food and Drug Administration (FDA) granted 510(k) clearance to NIDEK Co. Ltd. for its new RS-3000 Advance fundus camera system, featuring a wide-field imaging capability and advanced image processing technology (NIDEK Co. Ltd. Press Release, 2025).
Dive into Technavio's robust research methodology, blending expert interviews, extensive data synthesis, and validated models for unparalleled Fundus Camera Market insights. See full methodology.
|
Market Scope |
|
|
Report Coverage |
Details |
|
Page number |
207 |
|
Base year |
2024 |
|
Historic period |
2019-2023 |
|
Forecast period |
2025-2029 |
|
Growth momentum & CAGR |
Accelerate at a CAGR of 6.2% |
|
Market growth 2025-2029 |
USD 174.65 thousand |
|
Market structure |
Fragmented |
|
YoY growth 2024-2025(%) |
5.7 |
|
Key countries |
US, Germany, Japan, China, UK, France, India, South Korea, Italy, and Brazil |
|
Competitive landscape |
Leading Companies, Market Positioning of Companies, Competitive Strategies, and Industry Risks |
Research Analyst Overview
- The market continues to evolve, driven by advancements in medical image archiving and diagnostic technologies. High-resolution fundus imaging, including red-free imaging and color fundus photography, plays a pivotal role in retinal pathology diagnosis. Optical coherence tomography (OCT) and retinal vessel segmentation, facilitated by automated image analysis, enable macular thickness measurement and disease progression monitoring. Fluorescence angiography imaging and retinal lesion detection are essential for early diagnosis and treatment of various retinal conditions. Multispectral imaging, lens opacity compensation, and fundus photography techniques contribute to improved image quality assessment and clinical decision support. Teleophthalmology systems, remote diagnostics, and near infrared imaging expand access to diagnostic services, especially in underserved areas.
- Industry growth is expected to reach double digits, with diagnostic imaging systems, image processing algorithms, and retinal image acquisition technologies leading the charge. For instance, a leading healthcare organization implemented a wide-field retinal imaging system, resulting in a 30% increase in early-stage diabetic retinopathy detection. This underscores the potential of fundus camera technology in improving patient outcomes and reducing healthcare costs. Image registration techniques, 3D retinal imaging, and autofluorescence imaging further enhance diagnostic capabilities, offering new opportunities for market growth.
What are the Key Data Covered in this Fundus Camera Market Research and Growth Report?
-
What is the expected growth of the Fundus Camera Market between 2025 and 2029?
-
USD 174.65 th, at a CAGR of 6.2%
-
-
What segmentation does the market report cover?
-
The report is segmented by Product (Non-mydriatic, Hybrid fundus cameras, Mydriatic fundus cameras, and ROP fundus cameras), End-user (Hospitals, Ophthalmology clinics, and Others), and Geography (North America, Europe, Asia, and Rest of World (ROW))
-
-
Which regions are analyzed in the report?
-
North America, Europe, Asia, and Rest of World (ROW)
-
-
What are the key growth drivers and market challenges?
-
Rising prevalence of eye diseases, Shortage of skilled workforce
-
-
Who are the major players in the Fundus Camera Market?
-
Allm Inc., Canon Inc., Carl Zeiss AG, Chongqing Bio Newvision Medical Equipment Ltd., CSO ITALIA, Epipole Ltd., Essilor Instruments USA, Forus Health Pvt. Ltd., Haag Streit AG, Hongdee Ophthalmic Equipment, INTUVISION LABS, Kody Medical Electronics Pvt. Ltd., Kowa Co. Ltd., Marco, Mediworks, New Vision, NIDEK Co. Ltd., Optitech Eye Care, Optomed Oyj, PHELCOM, Remidio Innovative Solutions Pvt. Ltd., Revenio Group Oyj, Topcon Corp., VISIONIX USA INC., Volk Optical, and Zimed Healthcare Inc.
-
Market Research Insights
- The market for fundus cameras continues to expand, driven by the increasing demand for non-invasive diagnostic tools in the healthcare industry. According to industry reports, the market is projected to grow by over 10% annually. For instance, a leading ophthalmology clinic reported a 15% increase in fundus camera sales last year due to the growing number of diagnoses made possible by these devices. Advanced imaging modalities, such as optical coherence tomography (OCT), are increasingly being integrated into fundus cameras to enhance diagnostic accuracy.
- Additionally, the adoption of machine learning applications and computer vision techniques in fundus camera systems is expected to further boost market growth. With ongoing advancements in hardware specifications, software features, and clinical workflow integration, fundus cameras are becoming indispensable tools for healthcare professionals.
We can help! Our analysts can customize this fundus camera market research report to meet your requirements.
 RIA -
RIA - 
