Game Based Learning Market Analysis, Size, and Forecast 2026-2030: North America (US, Canada, and Mexico), Europe (Germany, UK, and France), APAC (China, Japan, and India), Middle East and Africa (Saudi Arabia, UAE, and South Africa), South America (Brazil, Argentina, and Colombia), and Rest of World (ROW)

Game Based Learning Market Analysis, Size, and Forecast 2026-2030:
North America (US, Canada, and Mexico), Europe (Germany, UK, and France), APAC (China, Japan, and India), Middle East and Africa (Saudi Arabia, UAE, and South Africa), South America (Brazil, Argentina, and Colombia), and Rest of World (ROW)

Published: Dec 2025 284 Pages SKU: IRTNTR81209

Market Overview at a Glance

$45.14 B
Market Opportunity
21.5%
CAGR 2025 - 2030
46%
North America Growth
$15.04 B
Solutions segment 2024

Game Based Learning Market Size 2026-2030

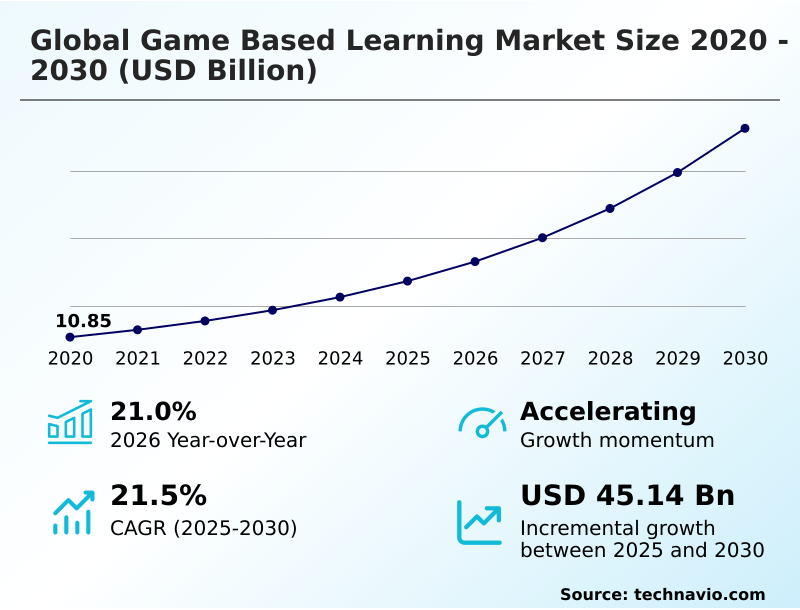
The game based learning market size is valued to increase by USD 45.14 billion, at a CAGR of 21.5% from 2025 to 2030. Proliferation of advanced technologies such as immersive reality will drive the game based learning market.

Major Market Trends & Insights

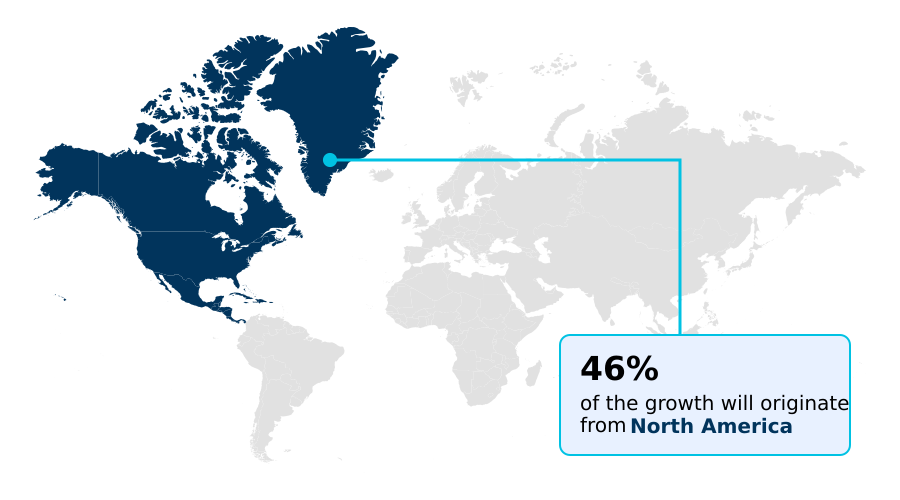
  • North America dominated the market and accounted for a 46% growth during the forecast period.
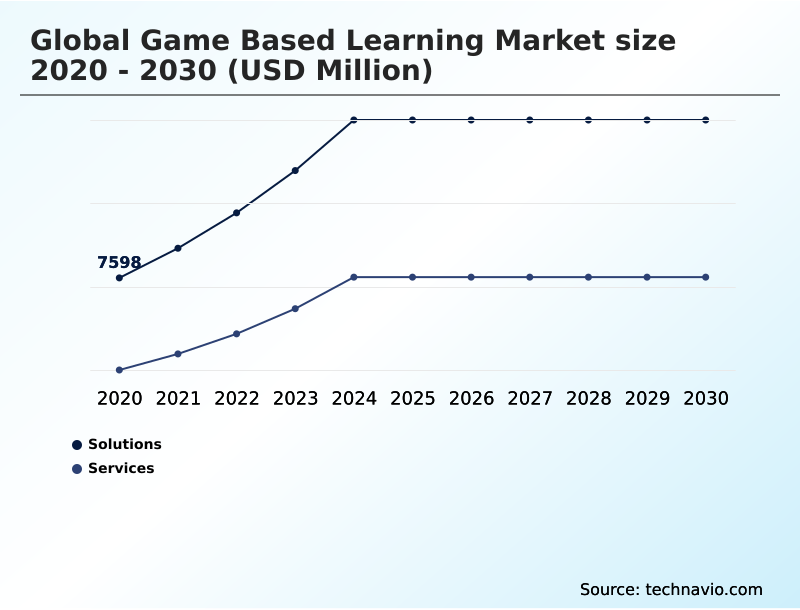
  • By Component - Solutions segment was valued at USD 15.04 billion in 2024
  • By End-user - Academic segment accounted for the largest market revenue share in 2024

Market Size & Forecast

  • Market Opportunities: USD 61.69 billion
  • Market Future Opportunities: USD 45.14 billion
  • CAGR from 2025 to 2030 : 21.5%

Market Summary

  • The Game Based Learning Market is undergoing significant transformation, driven by the need for more engaging and effective training methodologies. This market utilizes gamification mechanics and interactive content to enhance learner engagement and knowledge retention in both academic and corporate settings.
  • A core driver is the integration of technologies like artificial intelligence and virtual reality, which enable highly personalized learning and immersive simulations. For instance, a manufacturing firm can use simulation games to train technicians on complex machinery in a risk-free environment, reducing on-the-job errors and improving safety compliance.
  • This approach is particularly effective for soft skills development, where role-playing scenarios help build critical thinking and communication abilities. While the corporate training sector is a major adopter for upskilling and compliance, the k-12 education field also shows strong demand for curriculum-aligned games that support stem education.
  • The focus remains on delivering measurable learning outcomes through sophisticated instructional design, moving beyond traditional methods toward dynamic, performance-based educational tools. This evolution within the Game Based Learning Market highlights a shift towards data-driven pedagogical approaches and scalable solutions for diverse learning needs.

What will be the Size of the Game Based Learning Market during the forecast period?

Get Key Insights on Market Forecast (PDF) Request Free Sample

How is the Game Based Learning Market Segmented?

The game based learning industry research report provides comprehensive data (region-wise segment analysis), with forecasts and estimates in "USD million" for the period 2026-2030, as well as historical data from 2020-2024 for the following segments.

  • Component
    • Solutions
    • Services
  • End-user
    • Academic
    • Non-academic
  • Platform
    • Mobile apps
    • Web based platforms
    • Console based learning
  • Geography
    • North America
      • US
      • Canada
      • Mexico
    • Europe
      • Germany
      • UK
      • France
    • APAC
      • China
      • Japan
      • India
    • Middle East and Africa
      • Saudi Arabia
      • UAE
      • South Africa
    • South America
      • Brazil
      • Argentina
      • Colombia
    • Rest of World (ROW)

By Component Insights

The solutions segment is estimated to witness significant growth during the forecast period.

The solutions segment is shifting toward dynamic platforms that integrate gamification mechanics and machine learning algorithms to foster experiential learning. These offerings utilize interactive content and branching narratives to promote critical thinking and collaborative learning among users.

Organizations are leveraging these solutions to move beyond static training, with implementations showing a 20% increase in long-term knowledge retention. Analysis of learner performance data creates proprietary data sets, forming a data moat that enhances platform value.

However, successful deployment requires effective change management to align with performance evaluation metrics, ensuring user adoption and proving the value of investing in advanced problem-solving skills development through these sophisticated tools.

Request Free Sample

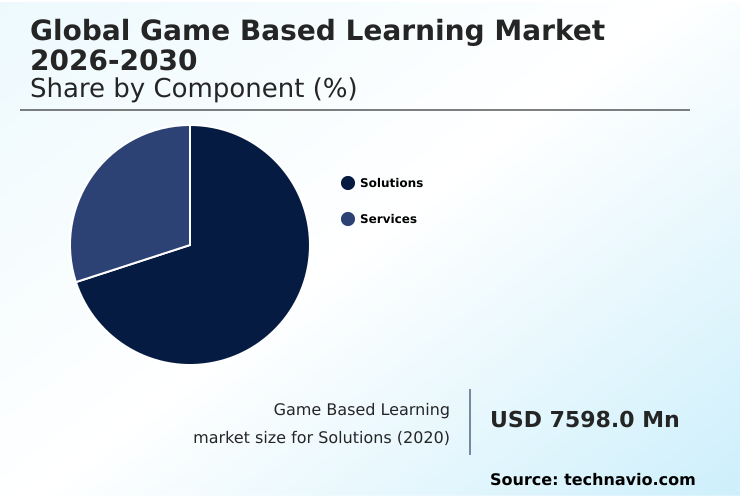
The Solutions segment was valued at USD 15.04 billion in 2024 and showed a gradual increase during the forecast period.

Request Free Sample

Regional Analysis

North America is estimated to contribute 46% to the growth of the global market during the forecast period.Technavio’s analysts have elaborately explained the regional trends and drivers that shape the market during the forecast period.

See How Game Based Learning Market Demand is Rising in North America Request Free Sample

The geographic landscape is diverse, with North America leading in market maturity and investment, commanding 46% of the incremental growth. This region sees heavy adoption in corporate settings, especially for high-fidelity simulations in vocational training and higher education.

Europe follows, with a strong focus on data privacy regulations and pedagogical rigor, which influences the design of simulation games.

In contrast, the APAC region is the fastest-growing market, characterized by mobile-first adoption of augmented reality for on-the-job training and performance support. This mobile-centric approach results in a 35% higher adoption rate for AR-based applications compared to other regions.

This trend toward democratized forms of learning is expanding digital literacy and improving competency levels across various industries, though providers must navigate complex cybersecurity protocols and ensure curriculum alignment.

Market Dynamics

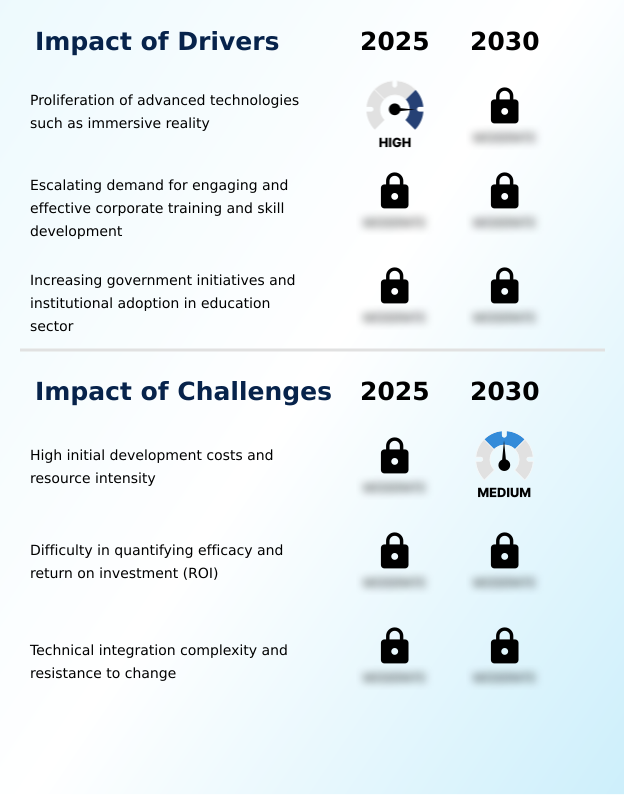
Our researchers analyzed the data with 2025 as the base year, along with the key drivers, trends, and challenges. A holistic analysis of drivers will help companies refine their marketing strategies to gain a competitive advantage.

  • Strategists are increasingly focused on the roi of game based corporate training, demanding clear metrics that justify the initial development costs of serious games. A key area of investment is game based learning for soft skills, where simulations create a safe space for practicing complex interpersonal dynamics.
  • The use of ai in adaptive learning platforms is central to creating personalized learning paths with games, tailoring challenges to individual user needs. In specialized fields, vr simulations for medical training are becoming standard, while ar for on-the-job performance support is transforming industrial sectors. These applications demonstrate the broad impact of immersive tech on training.
  • To achieve scale, organizations are focused on integrating gbl with learning management systems, a primary challenge in corporate gbl implementation. Success hinges on effective gamification strategies for employee engagement and the use of data analytics for learner performance to refine content. Providers are also exploring authoring tools for custom learning games, empowering organizations to create their own solutions.
  • The market is seeing strong applications in game based learning for stem education and game based learning for k-12 curriculum. Simultaneously, game based compliance training solutions and mobile game based learning applications are expanding access.
  • The overarching challenge remains the difficulty in measuring efficacy of learning games and using generative ai for educational content responsibly, particularly within game based learning in higher education.

What are the key market drivers leading to the rise in the adoption of Game Based Learning Industry?

  • The proliferation of advanced technologies, including immersive reality, is a key driver for market expansion.

  • Market growth is driven by accelerating demand in corporate training and k-12 education for tools that boost learner engagement. Companies are achieving measurable business outcomes, with gamified sales training platforms correlating to a 15% increase in quota attainment.
  • This focus on talent development is pushing organizations to adopt more effective pedagogical approaches that improve user performance and knowledge retention.
  • In the academic sphere, government support for digital education infrastructure and smart classrooms is fueling the adoption of platforms for stem education. These educational sandboxes improve student outcomes by over 25% in some districts.
  • The market's momentum is sustained by a continuous cycle of professional development for educators and trainers, solidifying the value of interactive learning methodologies.

What are the market trends shaping the Game Based Learning Industry?

  • The proliferation of artificial intelligence represents a key market trend, enabling the development of adaptive learning engines that create personalized educational experiences.

  • Key trends are reshaping the market, led by the integration of artificial intelligence to power adaptive learning. This technology moves beyond static modules to create dynamic role-playing scenarios where the difficulty adjusts to a learner's zone of proximal development, improving learning outcomes by over 20%.
  • Immersive technologies like virtual reality are enabling unprecedented soft skills development, offering haptic feedback in a psychologically safe environment. For instance, VR simulations have shown a 35% reduction in on-the-job errors for procedural tasks. Generative AI is also emerging as a tool for creating vast, responsive content, further enhancing personalized skill pathing.
  • These advancements collectively address learner knowledge gaps more effectively, making training more efficient and impactful.

What challenges does the Game Based Learning Industry face during its growth?

  • High initial development costs and resource intensity represent a key challenge impacting industry growth.

  • Significant challenges constrain market growth, primarily the high cost and complexity of instructional design. Developing a single, high-quality module can require 50% more resources than traditional e-learning, involving subject matter experts and extensive playtesting. While user-friendly authoring tools are emerging, achieving deep personalized learning often requires custom development, which is unfeasible for many.
  • The difficulty in proving definitive ROI without standardized methodologies remains a major hurdle. Furthermore, integrating new platforms with a legacy learning management system and ensuring compliance with single sign-on protocols can delay implementation by months. Even with microlearning modules, organizations struggle to deploy them effectively without robust data analytics to prove their impact, pushing providers toward more scalable pricing models.

Exclusive Technavio Analysis on Customer Landscape

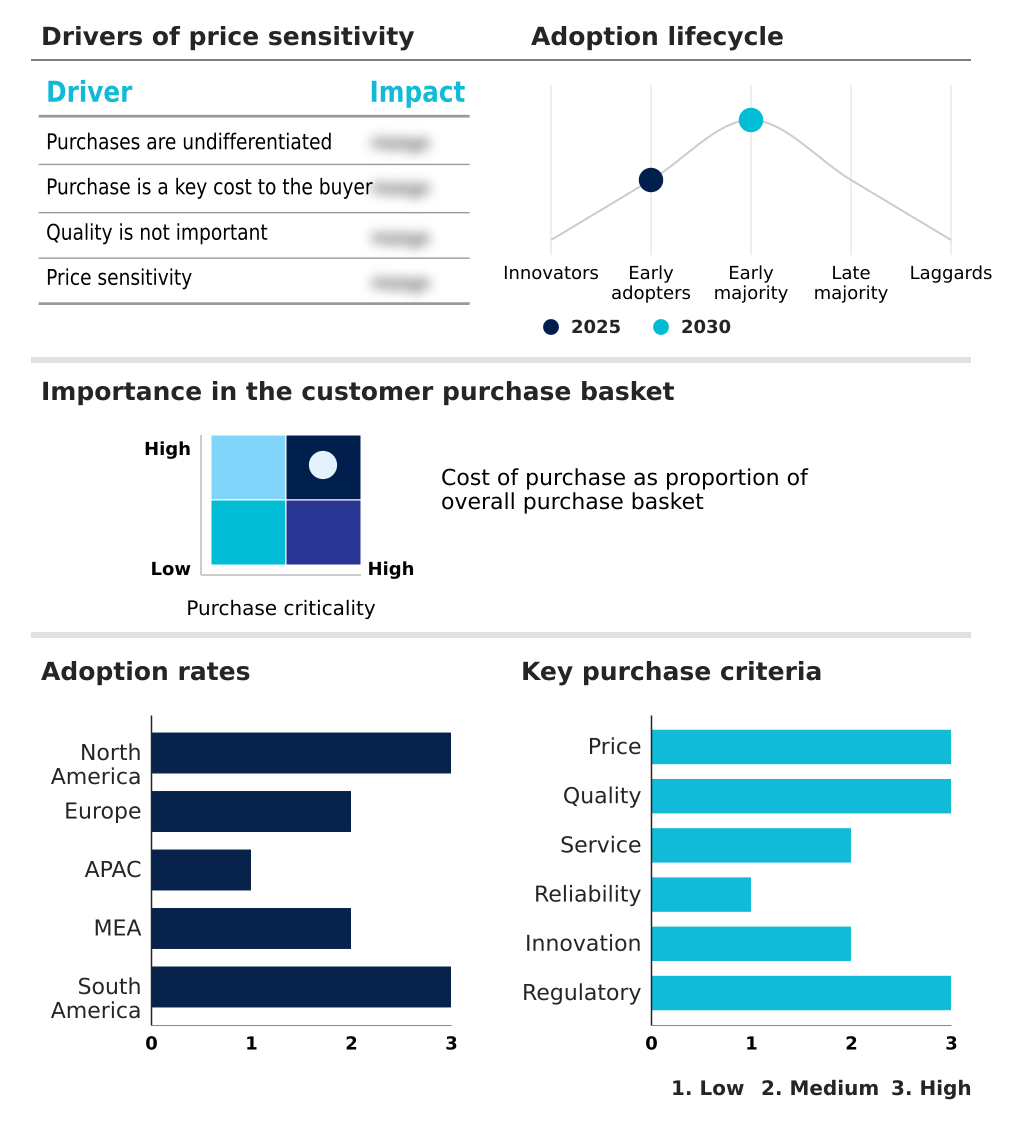
The game based learning market forecasting report includes the adoption lifecycle of the market, covering from the innovator’s stage to the laggard’s stage. It focuses on adoption rates in different regions based on penetration. Furthermore, the game based learning market report also includes key purchase criteria and drivers of price sensitivity to help companies evaluate and develop their market growth analysis strategies.

Customer Landscape of Game Based Learning Industry

Competitive Landscape

Companies are implementing various strategies, such as strategic alliances, game based learning market forecast, partnerships, mergers and acquisitions, geographical expansion, and product/service launches, to enhance their presence in the industry.

Banzai Labs Inc. - Delivers game-based financial literacy programs using interactive, real-life scenarios to enhance money management skills for young adults, focusing on practical application and engagement.

The industry research and growth report includes detailed analyses of the competitive landscape of the market and information about key companies, including:

  • Banzai Labs Inc.
  • BI WORLDWIDE
  • BrainPOP
  • BrainQuake Inc.
  • BreakAway Ltd. Inc.
  • Docebo Inc.
  • Duolingo Inc.
  • EliteGamingLIVE
  • Filament Games
  • Funbrain Holdings LLC
  • iCivics Inc.
  • LearningWare Inc.
  • Lets Nurture Infotech Pvt. Ltd.
  • Lumos Labs Inc.
  • Microsoft Corp.
  • PLAYKIDS INTERNET MOVEL SA
  • Prodigy Education
  • Roblox Corp.
  • Schell Games LLC

Qualitative and quantitative analysis of companies has been conducted to help clients understand the wider business environment as well as the strengths and weaknesses of key industry players. Data is qualitatively analyzed to categorize companies as pure play, category-focused, industry-focused, and diversified; it is quantitatively analyzed to categorize companies as dominant, leading, strong, tentative, and weak.

Recent Development and News in Game based learning market

  • In September, 2024, PwC launched a new commercial service to build immersive learning experiences for its clients, leveraging its custom VR platform to train professionals in soft skills like diversity and inclusion.
  • In November, 2024, Duolingo Inc. announced the integration of OpenAI's GPT-4 model into its platform, creating AI-powered features such as 'Roleplay' and 'Explain My Answer' to enhance conversational practice and provide personalized feedback.
  • In February, 2025, Interplay Learning secured $18 million in a growth equity round to expand its immersive VR and 3D simulation training platform for skilled trades professionals.
  • In April, 2025, Microsoft Corp. announced expanded features for its Viva Learning platform, emphasizing AI-powered content recommendations and skill pathing to create intelligent and personalized enterprise learning ecosystems.

Dive into Technavio’s robust research methodology, blending expert interviews, extensive data synthesis, and validated models for unparalleled Game Based Learning Market insights. See full methodology.

Market Scope
Page number 284
Base year 2025
Historic period 2020-2024
Forecast period 2026-2030
Growth momentum & CAGR Accelerate at a CAGR of 21.5%
Market growth 2026-2030 USD 45144.5 million
Market structure Fragmented
YoY growth 2025-2026(%) 21.0%
Key countries US, Canada, Mexico, Germany, UK, France, Italy, The Netherlands, Spain, China, Japan, India, South Korea, Australia, Indonesia, Saudi Arabia, UAE, South Africa, Israel, Turkey, Brazil, Argentina and Colombia
Competitive landscape Leading Companies, Market Positioning of Companies, Competitive Strategies, and Industry Risks

Request Free Sample

Research Analyst Overview

  • The market is defined by a strategic shift from static content to dynamic, adaptive learning ecosystems. This evolution is powered by artificial intelligence and machine learning algorithms that enable personalized learning at scale, a boardroom-level consideration impacting both training budgets and talent development strategy.
  • Organizations are leveraging immersive technologies like virtual reality and augmented reality to create engaging simulation games and role-playing scenarios, with a particular focus on complex corporate training and vocational training. This move towards experiential learning is proving effective for soft skills development and compliance training, enhancing knowledge retention.
  • Successful implementation requires seamless integration with an existing learning management system and robust data analytics to track user performance. The demand for effective k-12 education and higher education solutions drives curriculum alignment and sophisticated instructional design.
  • The most effective pedagogical approaches combine gamification mechanics with interactive content to foster critical thinking and problem-solving skills, supported by microlearning modules and performance support tools that improve digital literacy and facilitate collaborative learning. Firms that master the use of authoring tools to build these platforms are establishing a distinct competitive advantage.

What are the Key Data Covered in this Game Based Learning Market Research and Growth Report?

  • What is the expected growth of the Game Based Learning Market between 2026 and 2030?

    • USD 45.14 billion, at a CAGR of 21.5%

  • What segmentation does the market report cover?

    • The report is segmented by Component (Solutions, and Services), End-user (Academic, and Non-academic), Platform (Mobile apps, Web based platforms, and Console based learning.) and Geography (North America, Europe, APAC, Middle East and Africa, South America)

  • Which regions are analyzed in the report?

    • North America, Europe, APAC, Middle East and Africa and South America

  • What are the key growth drivers and market challenges?

    • Proliferation of advanced technologies such as immersive reality, High initial development costs and resource intensity

  • Who are the major players in the Game Based Learning Market?

    • Banzai Labs Inc., BI WORLDWIDE, BrainPOP, BrainQuake Inc., BreakAway Ltd. Inc., Docebo Inc., Duolingo Inc., EliteGamingLIVE, Filament Games, Funbrain Holdings LLC, iCivics Inc., LearningWare Inc., Lets Nurture Infotech Pvt. Ltd., Lumos Labs Inc., Microsoft Corp., PLAYKIDS INTERNET MOVEL SA, Prodigy Education, Roblox Corp. and Schell Games LLC

Market Research Insights

  • Market dynamics are shaped by a demand for tangible, measurable business outcomes from training investments. The use of high-fidelity simulations and sophisticated branching narratives has been shown to improve competency levels by over 30% compared to traditional methods. Organizations leverage these platforms to create a psychologically safe environment for practice, addressing knowledge gaps within a structured framework.
  • As a result, onboarding time for new employees can be reduced by as much as 15%. The application of standardized methodologies for assessing learning outcomes is becoming critical for justifying expenditures. Furthermore, the ability to build a proprietary data moat from learner performance data gives established platforms a significant competitive edge, making talent development more efficient and effective.

We can help! Our analysts can customize this game based learning market research report to meet your requirements.

Get in touch

1. Executive Summary

1.1 Market overview

Executive Summary - Chart on Market Overview
Executive Summary - Data Table on Market Overview
Executive Summary - Chart on Global Market Characteristics
Executive Summary - Chart on Market by Geography
Executive Summary - Chart on Market Segmentation by Component
Executive Summary - Chart on Market Segmentation by End-user
Executive Summary - Chart on Market Segmentation by Platform
Executive Summary - Chart on Incremental Growth
Executive Summary - Data Table on Incremental Growth
Executive Summary - Chart on Company Market Positioning

2. Technavio Analysis

2.1 Analysis of price sensitivity, lifecycle, customer purchase basket, adoption rates, and purchase criteria

2.2 Criticality of inputs and Factors of differentiation

Chart on Overview on criticality of inputs and factors of differentiation

2.3 Factors of disruption

Chart on Overview on factors of disruption

2.4 Impact of drivers and challenges

Chart on Impact of drivers and challenges in 2025 and 2030

3. Market Landscape

3.1 Market ecosystem

Chart on Parent Market
Data Table on - Parent Market

3.2 Market characteristics

Chart on Market characteristics analysis

3.3 Value chain analysis

Chart on Value chain analysis

4. Market Sizing

4.1 Market definition

Data Table on Offerings of companies included in the market definition

4.2 Market segment analysis

Market segments

4.3 Market size 2025

4.4 Market outlook: Forecast for 2025-2030

Chart on Global - Market size and forecast 2025-2030 ($ million)
Data Table on Global - Market size and forecast 2025-2030 ($ million)
Chart on Global Market: Year-over-year growth 2025-2030 (%)
Data Table on Global Market: Year-over-year growth 2025-2030 (%)

5. Historic Market Size

5.1 Global Game Based Learning Market 2020 - 2024

Historic Market Size - Data Table on Global Game Based Learning Market 2020 - 2024 ($ million)

5.2 Component segment analysis 2020 - 2024

Historic Market Size - Component Segment 2020 - 2024 ($ million)

5.3 End-user segment analysis 2020 - 2024

Historic Market Size - End-user Segment 2020 - 2024 ($ million)

5.4 Platform segment analysis 2020 - 2024

Historic Market Size - Platform Segment 2020 - 2024 ($ million)

5.5 Geography segment analysis 2020 - 2024

Historic Market Size - Geography Segment 2020 - 2024 ($ million)

5.6 Country segment analysis 2020 - 2024

Historic Market Size - Country Segment 2020 - 2024 ($ million)

6. Qualitative Analysis

6.1 The AI impact on global game based learning market

7. Five Forces Analysis

7.1 Five forces summary

Five forces analysis - Comparison between 2025 and 2030

7.2 Bargaining power of buyers

Bargaining power of buyers - Impact of key factors 2025 and 2030

7.3 Bargaining power of suppliers

Bargaining power of suppliers - Impact of key factors in 2025 and 2030

7.4 Threat of new entrants

Threat of new entrants - Impact of key factors in 2025 and 2030

7.5 Threat of substitutes

Threat of substitutes - Impact of key factors in 2025 and 2030

7.6 Threat of rivalry

Threat of rivalry - Impact of key factors in 2025 and 2030

7.7 Market condition

Chart on Market condition - Five forces 2025 and 2030

8. Market Segmentation by Component

8.1 Market segments

Chart on Component - Market share 2025-2030 (%)
Data Table on Component - Market share 2025-2030 (%)

8.2 Comparison by Component

Chart on Comparison by Component
Data Table on Comparison by Component

8.3 Solutions - Market size and forecast 2025-2030

Chart on Solutions - Market size and forecast 2025-2030 ($ million)
Data Table on Solutions - Market size and forecast 2025-2030 ($ million)
Chart on Solutions - Year-over-year growth 2025-2030 (%)
Data Table on Solutions - Year-over-year growth 2025-2030 (%)

8.4 Services - Market size and forecast 2025-2030

Chart on Services - Market size and forecast 2025-2030 ($ million)
Data Table on Services - Market size and forecast 2025-2030 ($ million)
Chart on Services - Year-over-year growth 2025-2030 (%)
Data Table on Services - Year-over-year growth 2025-2030 (%)

8.5 Market opportunity by Component

Market opportunity by Component ($ million)
Data Table on Market opportunity by Component ($ million)

9. Market Segmentation by End-user

9.1 Market segments

Chart on End-user - Market share 2025-2030 (%)
Data Table on End-user - Market share 2025-2030 (%)

9.2 Comparison by End-user

Chart on Comparison by End-user
Data Table on Comparison by End-user

9.3 Academic - Market size and forecast 2025-2030

Chart on Academic - Market size and forecast 2025-2030 ($ million)
Data Table on Academic - Market size and forecast 2025-2030 ($ million)
Chart on Academic - Year-over-year growth 2025-2030 (%)
Data Table on Academic - Year-over-year growth 2025-2030 (%)

9.4 Non-academic - Market size and forecast 2025-2030

Chart on Non-academic - Market size and forecast 2025-2030 ($ million)
Data Table on Non-academic - Market size and forecast 2025-2030 ($ million)
Chart on Non-academic - Year-over-year growth 2025-2030 (%)
Data Table on Non-academic - Year-over-year growth 2025-2030 (%)

9.5 Market opportunity by End-user

Market opportunity by End-user ($ million)
Data Table on Market opportunity by End-user ($ million)

10. Market Segmentation by Platform

10.1 Market segments

Chart on Platform - Market share 2025-2030 (%)
Data Table on Platform - Market share 2025-2030 (%)

10.2 Comparison by Platform

Chart on Comparison by Platform
Data Table on Comparison by Platform

10.3 Mobile apps - Market size and forecast 2025-2030

Chart on Mobile apps - Market size and forecast 2025-2030 ($ million)
Data Table on Mobile apps - Market size and forecast 2025-2030 ($ million)
Chart on Mobile apps - Year-over-year growth 2025-2030 (%)
Data Table on Mobile apps - Year-over-year growth 2025-2030 (%)

10.4 Web based platforms - Market size and forecast 2025-2030

Chart on Web based platforms - Market size and forecast 2025-2030 ($ million)
Data Table on Web based platforms - Market size and forecast 2025-2030 ($ million)
Chart on Web based platforms - Year-over-year growth 2025-2030 (%)
Data Table on Web based platforms - Year-over-year growth 2025-2030 (%)

10.5 Console based learning - Market size and forecast 2025-2030

Chart on Console based learning - Market size and forecast 2025-2030 ($ million)
Data Table on Console based learning - Market size and forecast 2025-2030 ($ million)
Chart on Console based learning - Year-over-year growth 2025-2030 (%)
Data Table on Console based learning - Year-over-year growth 2025-2030 (%)

10.6 Market opportunity by Platform

Market opportunity by Platform ($ million)
Data Table on Market opportunity by Platform ($ million)

11. Customer Landscape

11.1 Customer landscape overview

Analysis of price sensitivity, lifecycle, customer purchase basket, adoption rates, and purchase criteria

12. Geographic Landscape

12.1 Geographic segmentation

Chart on Market share by geography 2025-2030 (%)
Data Table on Market share by geography 2025-2030 (%)

12.2 Geographic comparison

Chart on Geographic comparison
Data Table on Geographic comparison

12.3 North America - Market size and forecast 2025-2030

Chart on North America - Market size and forecast 2025-2030 ($ million)
Data Table on North America - Market size and forecast 2025-2030 ($ million)
Chart on North America - Year-over-year growth 2025-2030 (%)
Data Table on North America - Year-over-year growth 2025-2030 (%)
Chart on Regional Comparison - North America
Data Table on Regional Comparison - North America

12.3.1 US - Market size and forecast 2025-2030

Chart on US - Market size and forecast 2025-2030 ($ million)
Data Table on US - Market size and forecast 2025-2030 ($ million)
Chart on US - Year-over-year growth 2025-2030 (%)
Data Table on US - Year-over-year growth 2025-2030 (%)

12.3.2 Canada - Market size and forecast 2025-2030

Chart on Canada - Market size and forecast 2025-2030 ($ million)
Data Table on Canada - Market size and forecast 2025-2030 ($ million)
Chart on Canada - Year-over-year growth 2025-2030 (%)
Data Table on Canada - Year-over-year growth 2025-2030 (%)

12.3.3 Mexico - Market size and forecast 2025-2030

Chart on Mexico - Market size and forecast 2025-2030 ($ million)
Data Table on Mexico - Market size and forecast 2025-2030 ($ million)
Chart on Mexico - Year-over-year growth 2025-2030 (%)
Data Table on Mexico - Year-over-year growth 2025-2030 (%)

12.4 Europe - Market size and forecast 2025-2030

Chart on Europe - Market size and forecast 2025-2030 ($ million)
Data Table on Europe - Market size and forecast 2025-2030 ($ million)
Chart on Europe - Year-over-year growth 2025-2030 (%)
Data Table on Europe - Year-over-year growth 2025-2030 (%)
Chart on Regional Comparison - Europe
Data Table on Regional Comparison - Europe

12.4.1 Germany - Market size and forecast 2025-2030

Chart on Germany - Market size and forecast 2025-2030 ($ million)
Data Table on Germany - Market size and forecast 2025-2030 ($ million)
Chart on Germany - Year-over-year growth 2025-2030 (%)
Data Table on Germany - Year-over-year growth 2025-2030 (%)

12.4.2 UK - Market size and forecast 2025-2030

Chart on UK - Market size and forecast 2025-2030 ($ million)
Data Table on UK - Market size and forecast 2025-2030 ($ million)
Chart on UK - Year-over-year growth 2025-2030 (%)
Data Table on UK - Year-over-year growth 2025-2030 (%)

12.4.3 France - Market size and forecast 2025-2030

Chart on France - Market size and forecast 2025-2030 ($ million)
Data Table on France - Market size and forecast 2025-2030 ($ million)
Chart on France - Year-over-year growth 2025-2030 (%)
Data Table on France - Year-over-year growth 2025-2030 (%)

12.4.4 Italy - Market size and forecast 2025-2030

Chart on Italy - Market size and forecast 2025-2030 ($ million)
Data Table on Italy - Market size and forecast 2025-2030 ($ million)
Chart on Italy - Year-over-year growth 2025-2030 (%)
Data Table on Italy - Year-over-year growth 2025-2030 (%)

12.4.5 The Netherlands - Market size and forecast 2025-2030

Chart on The Netherlands - Market size and forecast 2025-2030 ($ million)
Data Table on The Netherlands - Market size and forecast 2025-2030 ($ million)
Chart on The Netherlands - Year-over-year growth 2025-2030 (%)
Data Table on The Netherlands - Year-over-year growth 2025-2030 (%)

12.4.6 Spain - Market size and forecast 2025-2030

Chart on Spain - Market size and forecast 2025-2030 ($ million)
Data Table on Spain - Market size and forecast 2025-2030 ($ million)
Chart on Spain - Year-over-year growth 2025-2030 (%)
Data Table on Spain - Year-over-year growth 2025-2030 (%)

12.5 APAC - Market size and forecast 2025-2030

Chart on APAC - Market size and forecast 2025-2030 ($ million)
Data Table on APAC - Market size and forecast 2025-2030 ($ million)
Chart on APAC - Year-over-year growth 2025-2030 (%)
Data Table on APAC - Year-over-year growth 2025-2030 (%)
Chart on Regional Comparison - APAC
Data Table on Regional Comparison - APAC

12.5.1 China - Market size and forecast 2025-2030

Chart on China - Market size and forecast 2025-2030 ($ million)
Data Table on China - Market size and forecast 2025-2030 ($ million)
Chart on China - Year-over-year growth 2025-2030 (%)
Data Table on China - Year-over-year growth 2025-2030 (%)

12.5.2 Japan - Market size and forecast 2025-2030

Chart on Japan - Market size and forecast 2025-2030 ($ million)
Data Table on Japan - Market size and forecast 2025-2030 ($ million)
Chart on Japan - Year-over-year growth 2025-2030 (%)
Data Table on Japan - Year-over-year growth 2025-2030 (%)

12.5.3 India - Market size and forecast 2025-2030

Chart on India - Market size and forecast 2025-2030 ($ million)
Data Table on India - Market size and forecast 2025-2030 ($ million)
Chart on India - Year-over-year growth 2025-2030 (%)
Data Table on India - Year-over-year growth 2025-2030 (%)

12.5.4 South Korea - Market size and forecast 2025-2030

Chart on South Korea - Market size and forecast 2025-2030 ($ million)
Data Table on South Korea - Market size and forecast 2025-2030 ($ million)
Chart on South Korea - Year-over-year growth 2025-2030 (%)
Data Table on South Korea - Year-over-year growth 2025-2030 (%)

12.5.5 Australia - Market size and forecast 2025-2030

Chart on Australia - Market size and forecast 2025-2030 ($ million)
Data Table on Australia - Market size and forecast 2025-2030 ($ million)
Chart on Australia - Year-over-year growth 2025-2030 (%)
Data Table on Australia - Year-over-year growth 2025-2030 (%)

12.5.6 Indonesia - Market size and forecast 2025-2030

Chart on Indonesia - Market size and forecast 2025-2030 ($ million)
Data Table on Indonesia - Market size and forecast 2025-2030 ($ million)
Chart on Indonesia - Year-over-year growth 2025-2030 (%)
Data Table on Indonesia - Year-over-year growth 2025-2030 (%)

12.6 Middle East and Africa - Market size and forecast 2025-2030

Chart on Middle East and Africa - Market size and forecast 2025-2030 ($ million)
Data Table on Middle East and Africa - Market size and forecast 2025-2030 ($ million)
Chart on Middle East and Africa - Year-over-year growth 2025-2030 (%)
Data Table on Middle East and Africa - Year-over-year growth 2025-2030 (%)
Chart on Regional Comparison - Middle East and Africa
Data Table on Regional Comparison - Middle East and Africa

12.6.1 Saudi Arabia - Market size and forecast 2025-2030

Chart on Saudi Arabia - Market size and forecast 2025-2030 ($ million)
Data Table on Saudi Arabia - Market size and forecast 2025-2030 ($ million)
Chart on Saudi Arabia - Year-over-year growth 2025-2030 (%)
Data Table on Saudi Arabia - Year-over-year growth 2025-2030 (%)

12.6.2 UAE - Market size and forecast 2025-2030

Chart on UAE - Market size and forecast 2025-2030 ($ million)
Data Table on UAE - Market size and forecast 2025-2030 ($ million)
Chart on UAE - Year-over-year growth 2025-2030 (%)
Data Table on UAE - Year-over-year growth 2025-2030 (%)

12.6.3 South Africa - Market size and forecast 2025-2030

Chart on South Africa - Market size and forecast 2025-2030 ($ million)
Data Table on South Africa - Market size and forecast 2025-2030 ($ million)
Chart on South Africa - Year-over-year growth 2025-2030 (%)
Data Table on South Africa - Year-over-year growth 2025-2030 (%)

12.6.4 Israel - Market size and forecast 2025-2030

Chart on Israel - Market size and forecast 2025-2030 ($ million)
Data Table on Israel - Market size and forecast 2025-2030 ($ million)
Chart on Israel - Year-over-year growth 2025-2030 (%)
Data Table on Israel - Year-over-year growth 2025-2030 (%)

12.6.5 Turkey - Market size and forecast 2025-2030

Chart on Turkey - Market size and forecast 2025-2030 ($ million)
Data Table on Turkey - Market size and forecast 2025-2030 ($ million)
Chart on Turkey - Year-over-year growth 2025-2030 (%)
Data Table on Turkey - Year-over-year growth 2025-2030 (%)

12.7 South America - Market size and forecast 2025-2030

Chart on South America - Market size and forecast 2025-2030 ($ million)
Data Table on South America - Market size and forecast 2025-2030 ($ million)
Chart on South America - Year-over-year growth 2025-2030 (%)
Data Table on South America - Year-over-year growth 2025-2030 (%)
Chart on Regional Comparison - South America
Data Table on Regional Comparison - South America

12.7.1 Brazil - Market size and forecast 2025-2030

Chart on Brazil - Market size and forecast 2025-2030 ($ million)
Data Table on Brazil - Market size and forecast 2025-2030 ($ million)
Chart on Brazil - Year-over-year growth 2025-2030 (%)
Data Table on Brazil - Year-over-year growth 2025-2030 (%)

12.7.2 Argentina - Market size and forecast 2025-2030

Chart on Argentina - Market size and forecast 2025-2030 ($ million)
Data Table on Argentina - Market size and forecast 2025-2030 ($ million)
Chart on Argentina - Year-over-year growth 2025-2030 (%)
Data Table on Argentina - Year-over-year growth 2025-2030 (%)

12.7.3 Colombia - Market size and forecast 2025-2030

Chart on Colombia - Market size and forecast 2025-2030 ($ million)
Data Table on Colombia - Market size and forecast 2025-2030 ($ million)
Chart on Colombia - Year-over-year growth 2025-2030 (%)
Data Table on Colombia - Year-over-year growth 2025-2030 (%)

12.8 Market opportunity by geography

Market opportunity by geography ($ million)
Data Tables on Market opportunity by geography ($ million)

13. Drivers, Challenges, and Opportunity

13.1 Market drivers

Proliferation of advanced technologies such as immersive reality
Escalating demand for engaging and effective corporate training and skill development
Increasing government initiatives and institutional adoption in education sector

13.2 Market challenges

High initial development costs and resource intensity
Difficulty in quantifying efficacy and return on investment (ROI)
Technical integration complexity and resistance to change

13.3 Impact of drivers and challenges

Impact of drivers and challenges in 2025 and 2030

13.4 Market opportunities

Proliferation of artificial intelligence and adaptive learning engines
Ascendancy of immersive technologies in experiential learning
Expansion into corporate training with focus on soft skills development

14. Competitive Landscape

14.1 Overview

14.2

Overview on criticality of inputs and factors of differentiation

14.3 Landscape disruption

Overview on factors of disruption

14.4 Industry risks

Impact of key risks on business

15. Competitive Analysis

15.1 Companies profiled

Companies covered

15.2 Company ranking index

15.3 Market positioning of companies

Matrix on companies position and classification

15.4 Banzai Labs Inc.

Banzai Labs Inc. - Overview
Banzai Labs Inc. - Product / Service
Banzai Labs Inc. - Key offerings
SWOT

15.5 BI WORLDWIDE

BI WORLDWIDE - Overview
BI WORLDWIDE - Product / Service
BI WORLDWIDE - Key offerings
SWOT

15.6 BrainPOP

BrainPOP - Overview
BrainPOP - Product / Service
BrainPOP - Key offerings
SWOT

15.7 BrainQuake Inc.

BrainQuake Inc. - Overview
BrainQuake Inc. - Product / Service
BrainQuake Inc. - Key offerings
SWOT

15.8 BreakAway Ltd. Inc.

BreakAway Ltd. Inc. - Overview
BreakAway Ltd. Inc. - Product / Service
BreakAway Ltd. Inc. - Key offerings
SWOT

15.9 EliteGamingLIVE

EliteGamingLIVE - Overview
EliteGamingLIVE - Product / Service
EliteGamingLIVE - Key offerings
SWOT

15.10 Filament Games

Filament Games - Overview
Filament Games - Product / Service
Filament Games - Key offerings
SWOT

15.11 Funbrain Holdings LLC

Funbrain Holdings LLC - Overview
Funbrain Holdings LLC - Product / Service
Funbrain Holdings LLC - Key offerings
SWOT

15.12 iCivics Inc.

iCivics Inc. - Overview
iCivics Inc. - Product / Service
iCivics Inc. - Key offerings
SWOT

15.13 LearningWare Inc.

LearningWare Inc. - Overview
LearningWare Inc. - Product / Service
LearningWare Inc. - Key offerings
SWOT

15.14 Lets Nurture Infotech Pvt. Ltd.

Lets Nurture Infotech Pvt. Ltd. - Overview
Lets Nurture Infotech Pvt. Ltd. - Product / Service
Lets Nurture Infotech Pvt. Ltd. - Key offerings
SWOT

15.15 Lumos Labs Inc.

Lumos Labs Inc. - Overview
Lumos Labs Inc. - Product / Service
Lumos Labs Inc. - Key offerings
SWOT

15.16 Microsoft Corp.

Microsoft Corp. - Overview
Microsoft Corp. - Business segments
Microsoft Corp. - Key news
Microsoft Corp. - Key offerings
Microsoft Corp. - Segment focus
SWOT

15.17 PLAYKIDS INTERNET MOVEL SA

PLAYKIDS INTERNET MOVEL SA - Overview
PLAYKIDS INTERNET MOVEL SA - Product / Service
PLAYKIDS INTERNET MOVEL SA - Key offerings
SWOT

15.18 Schell Games LLC

Schell Games LLC - Overview
Schell Games LLC - Product / Service
Schell Games LLC - Key offerings
SWOT

16. Appendix

16.1 Scope of the report

Market definition
Objectives
Notes and caveats

16.2 Inclusions and exclusions checklist

Inclusions checklist
Exclusions checklist

16.3 Currency conversion rates for US$

16.4 Research methodology

16.5 Data procurement

Information sources

16.6 Data validation

16.7 Validation techniques employed for market sizing

16.8 Data synthesis

16.9 360 degree market analysis

16.10 List of abbreviations

Research Methodology

Technavio presents a detailed picture of the market by way of study, synthesis, and summation of data from multiple sources. The analysts have presented the various facets of the market with a particular focus on identifying the key industry influencers. The data thus presented is comprehensive, reliable, and the result of extensive research, both primary and secondary.

INFORMATION SOURCES

Primary sources

  • Manufacturers and suppliers
  • Channel partners
  • Industry experts
  • Strategic decision makers

Secondary sources

  • Industry journals and periodicals
  • Government data
  • Financial reports of key industry players
  • Historical data
  • Press releases

DATA ANALYSIS

Data Synthesis

  • Collation of data
  • Estimation of key figures
  • Analysis of derived insights

Data Validation

  • Triangulation with data models
  • Reference against proprietary databases
  • Corroboration with industry experts

REPORT WRITING

Qualitative

  • Market drivers
  • Market challenges
  • Market trends
  • Five forces analysis

Quantitative

  • Market size and forecast
  • Market segmentation
  • Geographical insights
  • Competitive landscape

Interested in this report?

Get your sample now to see our research methodology and insights!

Download Now

Frequently Asked Questions

Game Based Learning market growth will increase by USD 45144.5 million during 2026-2030 .

The Game Based Learning market is expected to grow at a CAGR of 21.5% during 2026-2030 .

Game Based Learning market is segmented by Component (Solutions, Services) End-user (Academic, Non-academic) Platform (Mobile apps, Web based platforms, Console based learning)

Banzai Labs Inc., BI WORLDWIDE, BrainPOP, BrainQuake Inc., BreakAway Ltd. Inc., Docebo Inc., Duolingo Inc., EliteGamingLIVE, Filament Games, Funbrain Holdings LLC, iCivics Inc., LearningWare Inc., Lets Nurture Infotech Pvt. Ltd., Lumos Labs Inc., Microsoft Corp., PLAYKIDS INTERNET MOVEL SA, Prodigy Education, Roblox Corp., Schell Games LLC are a few of the key vendors in the Game Based Learning market.

North America will register the highest growth rate of 46% among the other regions. Therefore, the Game Based Learning market in North America is expected to garner significant business opportunities for the vendors during the forecast period.

US, Canada, Mexico, Germany, UK, France, Italy, The Netherlands, Spain, China, Japan, India, South Korea, Australia, Indonesia, Saudi Arabia, UAE, South Africa, Israel, Turkey, Brazil, Argentina, Colombia

  • Proliferation of advanced technologies such as immersive reality is the driving factor this market.

The Game Based Learning market vendors should focus on grabbing business opportunities from the Component segment as it accounted for the largest market share in the base year.