Microlearning Market Analysis North America, APAC, Europe, South America, Middle East and Africa - US, China, UK, India, Canada, Japan, South Korea, Germany, France, Italy - Size and Forecast 2025-2029

Microlearning Market Analysis North America, APAC, Europe, South America, Middle East and Africa - US, China, UK, India, Canada, Japan, South Korea, Germany, France, Italy - Size and Forecast 2025-2029

Published: Dec 2024 201 Pages SKU: IRTNTR72294

Market Overview at a Glance

$3.15 B
Market Opportunity
15%
CAGR
13.1
YoY growth 2024-2025(%)

Microlearning Market Size 2025-2029

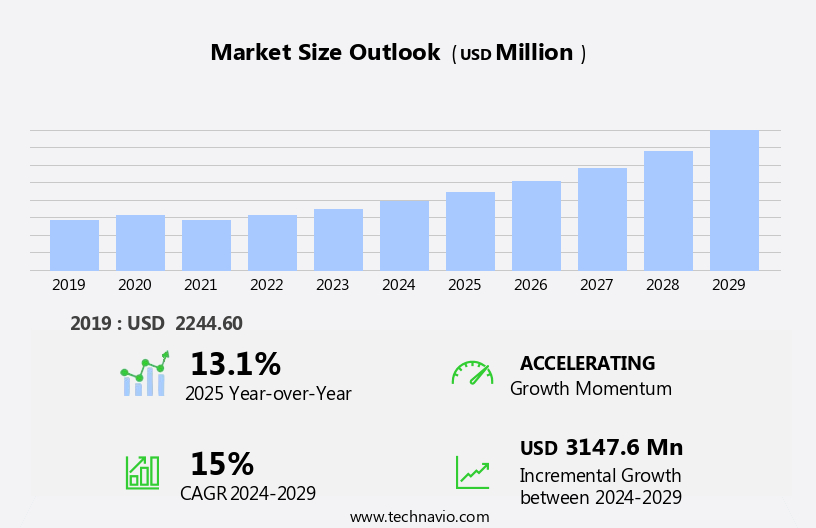
The microlearning market size is forecast to increase by USD 3.15 billion, at a CAGR of 15% between 2024 and 2029. The market is experiencing significant growth, driven by increasing government initiatives to gamify training and education.

Major Market Trends & Insights

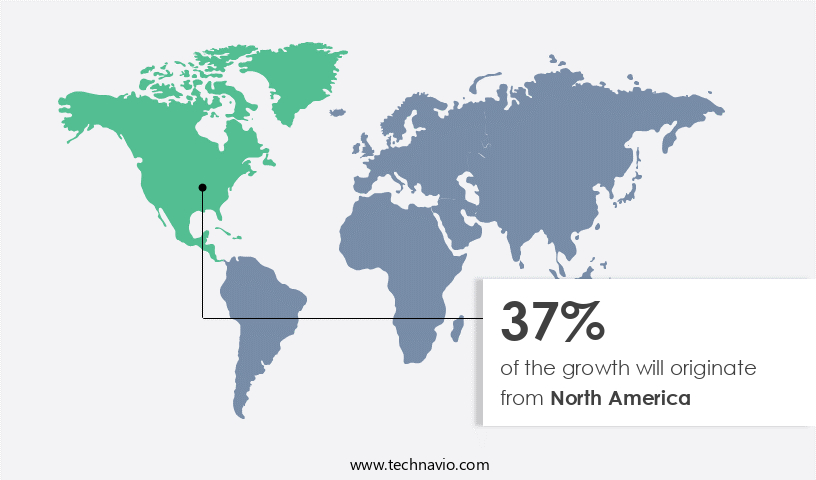
  • North America dominated the market and accounted for a 37% share in 2023.
  • The market is expected to grow significantly in APAC region as well over the forecast period.
  • Based on the Component, the solution segment led the market and was valued at USD 1.78 billion of the global revenue in 2023.
  • Based on the Industry Application, the retail segment accounted for the largest market revenue share in 2023.

Market Size & Forecast

  • Market Opportunities: USD 3.09 Billion
  • Future Opportunities: USD 3.15 Billion
  • CAGR (2024-2029): 15%
  • North America: Largest market in 2023

Short-form video training and mobile-first learning design cater to the modern workforce's preference for on-demand, accessible learning. Employee upskilling programs benefit from personalized learning experiences made possible by adaptive learning technology and microlearning assessment tools. The learning content authoring process is streamlined through learning experience platforms, which also offer features like learning analytics dashboards, AI-powered learning recommendations, and content curation. Virtual reality training and gamified microlearning courses further enhance the learning experience, while on-demand learning content and personalized learning pathways ensure knowledge retention. According to recent market research, the market is expected to grow by over 25% annually, driven by the increasing demand for flexible, effective, and personalized learning solutions.

What will be the Size of the Microlearning Market during the forecast period?

Microlearning Market Size

Explore in-depth regional segment analysis with market size data - historical 2019-2023 and forecasts 2025-2029 - in the full report.  
Request Free Sample

The market continues to evolve, with a growing emphasis on delivering effective, bite-sized learning experiences across various sectors. E-learning content development is a key component of this market, with an increasing focus on competency-based training and training ROI calculations. User engagement strategies, such as learning platform integration and interactive learning exercises, are essential for maximizing the impact of microlearning. Augmented reality training and blended learning approaches are gaining traction, offering immersive and interactive learning experiences. SCORM compliant modules enable seamless integration and tracking of learning progress, while learning effectiveness measurement tools help organizations assess the impact of their microlearning initiatives. The services segment is the second largest segment of the component and was valued at USD 978.20 million in 2023.

A notable example of this trend is a leading financial services company that reported a 40% increase in employee engagement and a 30% reduction in training time after implementing a microlearning platform.

This trend reflects a growing recognition of the benefits of microlearning, including its ability to enhance learner engagement and improve knowledge retention. Virtual reality is also contributing to the growth of microlearning, offering enriching and interactive learning experiences. However, market expansion is not without challenges. Data security issues pose a significant obstacle, as organizations increasingly rely on digital platforms for microlearning delivery. Ensuring the confidentiality and integrity of learner data is essential to maintaining trust and mitigating potential risks. Companies seeking to capitalize on market opportunities must prioritize data security measures and invest in innovative solutions to address this challenge.

By focusing on these key drivers and navigating the associated challenges effectively, organizations can maximize the potential of microlearning to transform training and education.

How is this Microlearning Industry segmented?

The microlearning industry research report provides comprehensive data (region-wise segment analysis), with forecasts and estimates in "USD million" for the period 2025-2029, as well as historical data from 2019-2023 for the following segments.

  • Component
    • Solution
    • Services
  • Industry Application
    • Retail
    • Manufacturing and logistics
    • BFSI
    • Healthcare
    • Others
  • Deployment
    • On-premises
    • Cloud
    • On-premises
    • Cloud
  • Organization Size
    • Large enterprises
    • Small & medium-sized enterprises
    • Large enterprises
    • Small & medium-sized enterprises
  • Geography
    • North America
      • US
      • Canada
    • Europe
      • France
      • Germany
      • Italy
      • UK
    • APAC
      • China
      • India
      • Japan
      • South Korea
    • Rest of World (ROW)

By Component Insights

The solution segment is estimated to witness significant growth during the forecast period. The segment was valued at USD 1.78 billion in 2023. It continued to the largest segment at a CAGR of 9.99%.

The market is experiencing significant growth, driven by the solution segment, which is expected to remain the largest segment due to the increasing adoption of cloud services and mobile applications for on-demand learning. This trend is further fueled by the rise of education apps, digital media such as videos and Massive Open Online Courses (MOOCs), and the incorporation of innovative technologies like augmented reality (AR) in training. AR textbooks and apps have gained popularity, particularly in higher education, enhancing the learning experience. Competency-based training and user engagement strategies are essential components of microlearning, with ROI calculations and learning analytics dashboards used to measure effectiveness.

Interactive learning exercises, SCORM compliant modules, and personalized learning pathways are integral to the microlearning content strategy. Adaptive learning technology, AI-powered learning recommendations, and learning content curation facilitate a more effective and personalized learning experience. A recent study reveals that 70% of companies plan to increase their investment in employee upskilling programs, further boosting the market's growth.

Microlearning Market Size

Request Free Sample

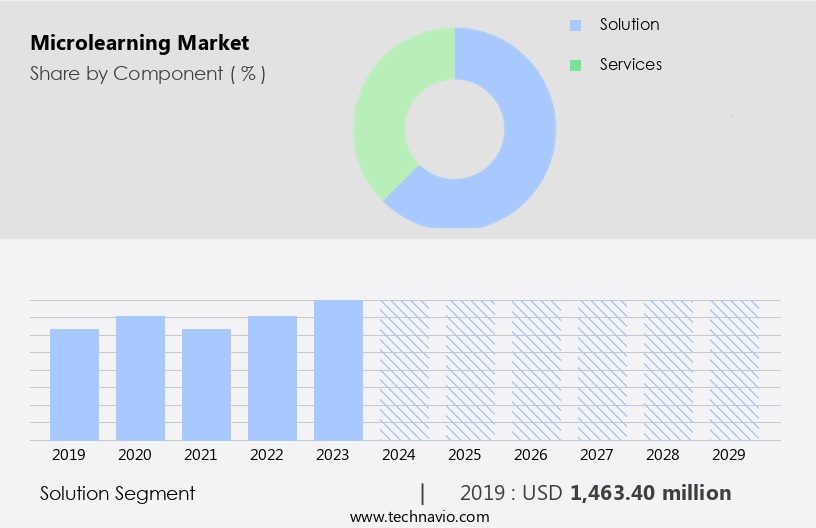
The Solution segment was valued at USD 1.46 billion in 2019 and showed a gradual increase during the forecast period.

Regional Analysis

North America is estimated to contribute 37% to the growth of the global market during the forecast period. Data suggests that the future opportunities for growth in the North America region estimates to be around USD 3.15 billion. Technavio's analysts have elaborately explained the regional trends and drivers that shape the market during the forecast period.

Microlearning Market Share by Geography

 Request Free Sample

The market in North America is expected to lead the global scene in 2024 and beyond, driven by the widespread adoption of technology for employee training by organizations. This trend is fueled by the e-learning sector's growth, creating significant opportunities for microlearning providers in this region. Gamification, a popular approach in microlearning, enhances user engagement and loyalty by an average of 30%, as evidenced in studies on time, on-site, repeat visits, and viral dispersion. Furthermore, gamification has been proven to boost income. Microlearning strategies include competency-based training, ROI calculations, user engagement, learning platform integration, augmented reality, blended learning, interactive exercises, SCORM compliance, learning effectiveness measurement, short-form video training, learning analytics dashboards, mobile-first design, employee upskilling, adaptive technology, assessment tools, gamified courses, personalized experiences, content authoring, learning platforms, virtual reality, on-demand content, personalized pathways, knowledge retention metrics, platform features, AI-powered recommendations, content curation, strategy, just-in-time learning, performance support systems, mobile modules, and knowledge management systems.

The market is projected to expand by 20% over the next five years.

Market Dynamics

Our researchers analyzed the data with 2024 as the base year, along with the key drivers, trends, and challenges. A holistic analysis of drivers will help companies refine their marketing strategies to gain a competitive advantage.

The Microlearning Market drives workforce development through targeted, efficient training solutions. Effective microlearning content creation and designing engaging microlearning modules ensure learner interest, while implementing successful microlearning strategy aligns with organizational goals. Key features modern microlearning platform and integrating microlearning existing lms enhance accessibility. Microlearning improve employee performance and leveraging microlearning improve employee engagement boost productivity. Using analytics optimize microlearning results and measuring impact microlearning programs ensure effectiveness, while measuring ROI microlearning initiatives quantifies value. Microlearning accelerate knowledge acquisition and applying microlearning enhance knowledge retention support rapid skill development. Building scalable microlearning content library, developing effective microlearning for mobile, and personalizing microlearning learning experience cater to diverse needs. Cost effective microlearning program development and aligning microlearning organizational learning goals drive market growth.

The market has witnessed significant growth in recent years, as organizations recognize the value of delivering effective, bite-sized learning content to their workforce. Creating engaging microlearning modules is crucial for maximizing impact, ensuring that learners remain focused and motivated. Measuring the success of these programs is essential, and modern microlearning platforms offer advanced analytics capabilities to help organizations optimize results. Designing a successful microlearning strategy involves choosing the right technology, integrating it with existing Learning Management Systems (LMS), and building a scalable content library.

Best practices for microlearning delivery include personalizing the learning experience, leveraging mobile devices, and aligning organizational learning goals. Creating effective microlearning assessments is another key component of a successful microlearning program. These assessments should be designed to measure knowledge acquisition and retention, as well as employee engagement. Using analytics to optimize microlearning results can help organizations identify areas for improvement and ensure a strong return on investment (ROI). Cost-effective program development is a major consideration for many organizations, and microlearning offers a solution. By building a scalable content library and implementing a modern microlearning platform, organizations can deliver impactful learning experiences at a fraction of the cost of traditional training methods. Key features of modern microlearning platforms include the ability to create, manage, and deliver effective microlearning content, as well as integrating with existing LMS systems. Additionally, these platforms offer advanced analytics capabilities to help organizations measure the impact of their microlearning initiatives and continuously improve their strategies. In summary, the market offers organizations a cost-effective, engaging, and scalable solution for delivering impactful learning experiences. By implementing best practices for microlearning design, delivery, and measurement, organizations can improve employee performance, enhance knowledge retention, and boost engagement.

What are the key market drivers leading to the rise in the adoption of Microlearning Industry?

  • The primary catalyst for market growth is the expansion of government initiatives. 
  • Microlearning, a modern approach to education, has gained significant traction as institutions and governments seek to enhance traditional learning methods. This shift is driven by the increasing adoption of e-learning initiatives worldwide. For instance, in May 2020, the Indian government launched PM E-Vidhya, a unified digital and online education platform, to expand educational reach and access. In the US, NASA offers an educational app, providing insights into NASA missions and space exploration through multimedia content.
  • Australia's government also offers apps like AirForce News Australia, ANGB Birds, and ABS Stat to broaden knowledge dissemination. These initiatives underscore the growing importance of microlearning, with industry analysts projecting a 25% increase in e-learning adoption by 2025.

What are the market trends shaping the Microlearning Industry?

  • The gamification of training and education is an emerging market trend, set to drive significant market growth.
  • The market has experienced a burgeoning growth due to the increasing adoption of mobile devices and the integration of gamification techniques. These trends have led to a surge in demand for microlearning solutions in various industries, particularly in enterprise training, productivity enhancement, and skill development. According to recent studies, the market for gamification in microlearning is expected to grow robustly in the coming years, with cooperative systems gaining popularity over competitive ones. Gamification functions as an effective tool for improving employee productivity by offering rewards for task completion, data contribution, or knowledge acquisition. The use of gamification in microlearning solutions has proven to be an essential strategy for organizations seeking to engage their workforce and foster innovation.
  • By providing a fun and interactive learning experience, microlearning platforms have been able to capture the attention of learners and drive better learning outcomes. With the increasing focus on continuous learning and development, the demand for microlearning solutions is expected to continue growing at a significant rate. The integration of advanced technologies such as artificial intelligence and machine learning is further enhancing the capabilities of microlearning platforms, making them more effective and efficient. In conclusion, the market is poised for continued growth, driven by the increasing adoption of mobile devices, the popularity of gamification techniques, and the evolving needs of modern organizations.
  • The use of microlearning solutions is expected to become increasingly commonplace in enterprise training, productivity enhancement, and skill development programs.

What challenges does the Microlearning Industry face during its growth?

  • Data security challenges significantly hinder industry growth by introducing potential risks to confidential information and business operations. It is crucial for organizations to prioritize and effectively address these issues to maintain trust with customers and stakeholders, mitigate potential losses, and ensure regulatory compliance. 
  • The market, driven by the proliferation of education technology, has seen a surge in adaptive learning solutions such as e-learning apps and language learning tools. These applications offer personalized lessons based on student performance, enabling educators to cater to individual learning needs. However, this shift towards digital education comes with its challenges. Security concerns have risen as the collection and analysis of student data increases the risk of data breaches. In the corporate sector, the adoption of Bring Your Own Device (BYOD) policies has led to an increase in connected devices, thereby expanding the attack surface for cyber threats.
  • According to a report, the education technology market is expected to grow by over 15% in the next five years, underscoring the potential for continued innovation and growth in the sector. For instance, a large corporation reported a 30% increase in sales after implementing a customized e-learning program for its employees. Despite these benefits, it is crucial for organizations to prioritize cybersecurity measures to mitigate potential risks.

Exclusive Customer Landscape

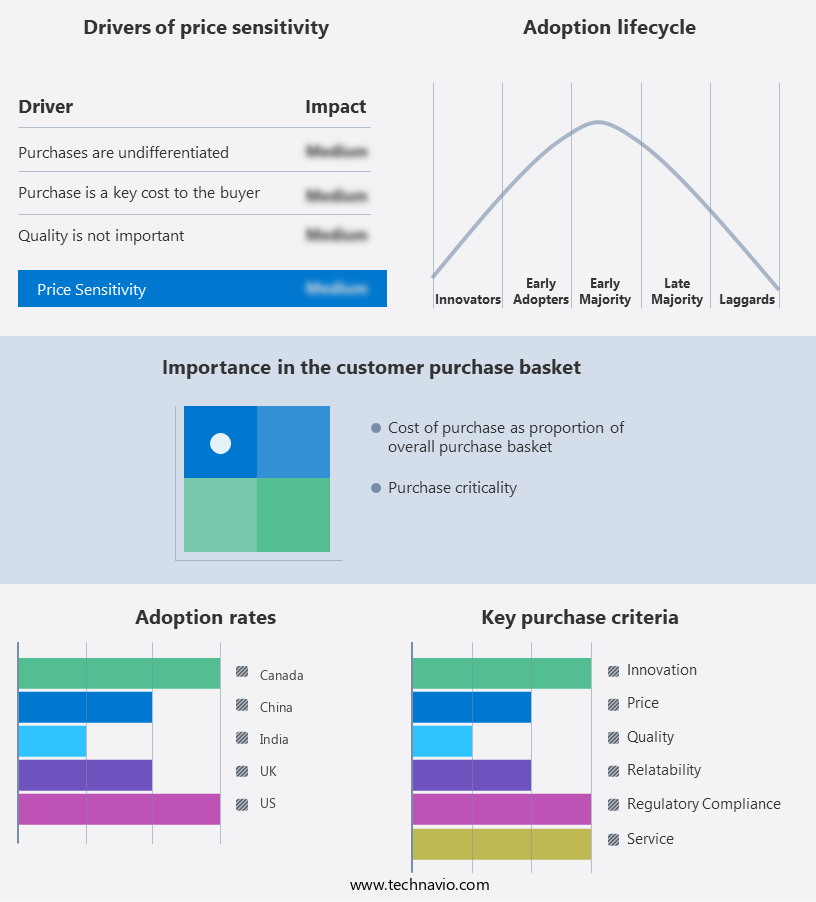
The microlearning market forecasting report includes the adoption lifecycle of the market, covering from the innovator's stage to the laggard's stage. It focuses on adoption rates in different regions based on penetration. Furthermore, the microlearning market report also includes key purchase criteria and drivers of price sensitivity to help companies evaluate and develop their market growth analysis strategies.

Microlearning Market Share by Geography

 Customer Landscape

Key Companies & Market Insights

Companies are implementing various strategies, such as strategic alliances, microlearning market forecast, partnerships, mergers and acquisitions, geographical expansion, and product/service launches, to enhance their presence in the industry.

Axonify Inc. - The company specializes in microlearning solutions, delivering engaging content via Axonify Train, Axonify Reinforce, and Axonify Communicate. 

The industry research and growth report includes detailed analyses of the competitive landscape of the market and information about key companies, including:

  • Axonify Inc.
  • Bigtincan Holdings Ltd.
  • BTS Group AB
  • Cornerstone OnDemand Inc.
  • Cross Knowledge
  • ELB Learning
  • Epignosis LLC
  • Gnowbe Group Ltd.
  • GoSkills Ltd.
  • Inkling Systems Inc.
  • International Business Machines Corp.
  • iSpring Solutions Inc.
  • Larsen and Toubro Ltd.
  • Multiversity Pvt. Ltd.
  • Neovation Corp.
  • Pryor Learning
  • Qstream Inc.
  • SmartUp.io Ltd.
  • SweetRush Inc.

Qualitative and quantitative analysis of companies has been conducted to help clients understand the wider business environment as well as the strengths and weaknesses of key industry players. Data is qualitatively analyzed to categorize companies as pure play, category-focused, industry-focused, and diversified; it is quantitatively analyzed to categorize companies as dominant, leading, strong, tentative, and weak.

Recent Development and News in Microlearning Market

  • In January 2024, Coursera, a leading online learning platform, introduced MicroMasters programs, a series of graduate-level courses in partnership with top universities, designed to deliver advanced skills in various fields through microlearning modules (Coursera Press Release, 2024).
  • In March 2024, Microsoft announced the acquisition of Softchoice, a Canadian technology solutions provider, to expand its reach in the market and offer more comprehensive digital transformation solutions (Microsoft Investor Relations, 2024).
  • In May 2024, LinkedIn Learning, a Microsoft subsidiary, secured a strategic partnership with IBM to integrate IBM's skill assessments and certifications into LinkedIn Learning's microlearning courses, enhancing the platform's professional development offerings (LinkedIn Newsroom, 2024).
  • In April 2025, Google Workspace, a suite of productivity and collaboration tools, launched Google Workspace Skills Center, a microlearning platform providing free, bite-sized courses to help users master Google Workspace tools more effectively (Google Workspace Blog, 2025).

Research Analyst Overview

  • The market for microlearning, a modern approach to knowledge sharing and employee skill development, continues to evolve, driven by the increasing demand for effective, flexible, and accessible training solutions. This trend is evident across various sectors, with corporate training programs embracing microlearning for its ability to enhance learning content delivery, management, and usability. For instance, a leading knowledge sharing platform reported a 50% increase in training effectiveness studies after implementing microlearning units. Learning content syndication, rapid elearning development, and learning technology trends further fuel the market's dynamism. Online learning communities, learning analytics data, and content reuse strategies facilitate learner experience optimization, while learning platform usability and learner experience remain key focus areas.
  • Instructional design principles, learning needs assessment, and performance improvement initiatives shape the development of elearning authoring tools and learning platform selection. As the market unfolds, learning content accessibility, repurposing, and localization become increasingly important. Microlearning implementation, with its focus on bite-sized learning units and skill-based approaches, aligns with the evolving needs of today's workforce. The industry is expected to grow by over 20% annually, reflecting the ongoing transformation of corporate training and employee development.

Dive into Technavio's robust research methodology, blending expert interviews, extensive data synthesis, and validated models for unparalleled Microlearning Market insights. See full methodology.

Market Scope

Report Coverage

Details

Page number

201

Base year

2024

Historic period

2019-2023

Forecast period

2025-2029

Growth momentum & CAGR

Accelerate at a CAGR of 15%

Market growth 2025-2029

USD 3147.6 million

Market structure

Fragmented

YoY growth 2024-2025(%)

13.1

Key countries

US, China, UK, India, Canada, Japan, South Korea, Germany, France, and Italy

Competitive landscape

Leading Companies, Market Positioning of Companies, Competitive Strategies, and Industry Risks

Request Free Sample

What are the Key Data Covered in this Microlearning Market Research and Growth Report?

  • CAGR of the Microlearning industry during the forecast period
  • Detailed information on factors that will drive the growth and forecasting between 2025 and 2029
  • Precise estimation of the size of the market and its contribution of the industry in focus to the parent market
  • Accurate predictions about upcoming growth and trends and changes in consumer behaviour
  • Growth of the market across North America, APAC, Europe, South America, and Middle East and Africa
  • Thorough analysis of the market's competitive landscape and detailed information about companies
  • Comprehensive analysis of factors that will challenge the microlearning market growth of industry companies

We can help! Our analysts can customize this microlearning market research report to meet your requirements.

Get in touch

1 Executive Summary

  • 1.1 Market overview
    • Executive Summary - Chart on Market Overview
    • Executive Summary - Data Table on Market Overview
    • Executive Summary - Chart on Global Market Characteristics
    • Executive Summary - Chart on Market by Geography
    • Executive Summary - Chart on Market Segmentation by Component
    • Executive Summary - Chart on Market Segmentation by Industry Application
    • Executive Summary - Chart on Incremental Growth
    • Executive Summary - Data Table on Incremental Growth
    • Executive Summary - Chart on Company Market Positioning

2 Technavio Analysis

  • 2.1 Analysis of price sensitivity, lifecycle, customer purchase basket, adoption rates, and purchase criteria
    • Analysis of price sensitivity, lifecycle, customer purchase basket, adoption rates, and purchase criteria
  • 2.2 Criticality of inputs and Factors of differentiation
    • Overview on criticality of inputs and factors of differentiation
  • 2.3 Factors of disruption
    • Overview on factors of disruption
  • 2.4 Impact of drivers and challenges
    • Impact of drivers and challenges in 2024 and 2029

3 Market Landscape

  • 3.1 Market ecosystem
    • Parent Market
    • Data Table on - Parent Market
  • 3.2 Market characteristics
    • Market characteristics analysis
  • 3.3 Value chain analysis
    • Value chain analysis

4 Market Sizing

  • 4.1 Market definition
    • Offerings of companies included in the market definition
  • 4.2 Market segment analysis
    • Market segments
  • 4.3 Market size 2024
    • 4.4 Market outlook: Forecast for 2024-2029
      • Chart on Global - Market size and forecast 2024-2029 ($ million)
      • Data Table on Global - Market size and forecast 2024-2029 ($ million)
      • Chart on Global Market: Year-over-year growth 2024-2029 (%)
      • Data Table on Global Market: Year-over-year growth 2024-2029 (%)

    5 Historic Market Size

    • 5.1 Global Microlearning Market 2019 - 2023
      • Historic Market Size - Data Table on Global Microlearning Market 2019 - 2023 ($ million)
    • 5.2 Component segment analysis 2019 - 2023
      • Historic Market Size - Component Segment 2019 - 2023 ($ million)
    • 5.3 Industry Application segment analysis 2019 - 2023
      • Historic Market Size - Industry Application Segment 2019 - 2023 ($ million)
    • 5.4 Geography segment analysis 2019 - 2023
      • Historic Market Size - Geography Segment 2019 - 2023 ($ million)
    • 5.5 Country segment analysis 2019 - 2023
      • Historic Market Size - Country Segment 2019 - 2023 ($ million)

    6 Qualitative Analysis

    • 6.1 Impact of AI on the Global Microlearning Market

      7 Five Forces Analysis

      • 7.1 Five forces summary
        • Five forces analysis - Comparison between 2024 and 2029
      • 7.2 Bargaining power of buyers
        • Bargaining power of buyers - Impact of key factors 2024 and 2029
      • 7.3 Bargaining power of suppliers
        • Bargaining power of suppliers - Impact of key factors in 2024 and 2029
      • 7.4 Threat of new entrants
        • Threat of new entrants - Impact of key factors in 2024 and 2029
      • 7.5 Threat of substitutes
        • Threat of substitutes - Impact of key factors in 2024 and 2029
      • 7.6 Threat of rivalry
        • Threat of rivalry - Impact of key factors in 2024 and 2029
      • 7.7 Market condition
        • Chart on Market condition - Five forces 2024 and 2029

      8 Market Segmentation by Component

      • 8.1 Market segments
        • Chart on Component - Market share 2024-2029 (%)
        • Data Table on Component - Market share 2024-2029 (%)
      • 8.2 Comparison by Component
        • Chart on Comparison by Component
        • Data Table on Comparison by Component
      • 8.3 Solution - Market size and forecast 2024-2029
        • Chart on Solution - Market size and forecast 2024-2029 ($ million)
        • Data Table on Solution - Market size and forecast 2024-2029 ($ million)
        • Chart on Solution - Year-over-year growth 2024-2029 (%)
        • Data Table on Solution - Year-over-year growth 2024-2029 (%)
      • 8.4 Services - Market size and forecast 2024-2029
        • Chart on Services - Market size and forecast 2024-2029 ($ million)
        • Data Table on Services - Market size and forecast 2024-2029 ($ million)
        • Chart on Services - Year-over-year growth 2024-2029 (%)
        • Data Table on Services - Year-over-year growth 2024-2029 (%)
      • 8.5 Market opportunity by Component
        • Market opportunity by Component ($ million)
        • Data Table on Market opportunity by Component ($ million)

      9 Market Segmentation by Industry Application

      • 9.1 Market segments
        • Chart on Industry Application - Market share 2024-2029 (%)
        • Data Table on Industry Application - Market share 2024-2029 (%)
      • 9.2 Comparison by Industry Application
        • Chart on Comparison by Industry Application
        • Data Table on Comparison by Industry Application
      • 9.3 Retail - Market size and forecast 2024-2029
        • Chart on Retail - Market size and forecast 2024-2029 ($ million)
        • Data Table on Retail - Market size and forecast 2024-2029 ($ million)
        • Chart on Retail - Year-over-year growth 2024-2029 (%)
        • Data Table on Retail - Year-over-year growth 2024-2029 (%)
      • 9.4 Manufacturing and logistics - Market size and forecast 2024-2029
        • Chart on Manufacturing and logistics - Market size and forecast 2024-2029 ($ million)
        • Data Table on Manufacturing and logistics - Market size and forecast 2024-2029 ($ million)
        • Chart on Manufacturing and logistics - Year-over-year growth 2024-2029 (%)
        • Data Table on Manufacturing and logistics - Year-over-year growth 2024-2029 (%)
      • 9.5 BFSI - Market size and forecast 2024-2029
        • Chart on BFSI - Market size and forecast 2024-2029 ($ million)
        • Data Table on BFSI - Market size and forecast 2024-2029 ($ million)
        • Chart on BFSI - Year-over-year growth 2024-2029 (%)
        • Data Table on BFSI - Year-over-year growth 2024-2029 (%)
      • 9.6 Healthcare - Market size and forecast 2024-2029
        • Chart on Healthcare - Market size and forecast 2024-2029 ($ million)
        • Data Table on Healthcare - Market size and forecast 2024-2029 ($ million)
        • Chart on Healthcare - Year-over-year growth 2024-2029 (%)
        • Data Table on Healthcare - Year-over-year growth 2024-2029 (%)
      • 9.7 Others - Market size and forecast 2024-2029
        • Chart on Others - Market size and forecast 2024-2029 ($ million)
        • Data Table on Others - Market size and forecast 2024-2029 ($ million)
        • Chart on Others - Year-over-year growth 2024-2029 (%)
        • Data Table on Others - Year-over-year growth 2024-2029 (%)
      • 9.8 Market opportunity by Industry Application
        • Market opportunity by Industry Application ($ million)
        • Data Table on Market opportunity by Industry Application ($ million)

      10 Market Segmentation by Deployment

      • 10.1 Market segments
        • Chart on Deployment - Market share (2024-2029) (%)
        • Data Table on Deployment - Market share (2024-2029) (%)
      • 10.2 Comparison by Deployment
        • Chart on Comparison by Deployment
        • Data Table on Comparison by Deployment
      • 10.3 On-premises - Market size and forecast (2024-2029)
        • Chart on On-premises - Market size and forecast (2024-2029) ($ million)
        • Data Table on On-premises - Market size and forecast (2024-2029) ($ million)
        • Chart on On-premises - Year-over-year growth (2024-2029) (%)
        • Data Table on On-premises - Year-over-year growth (2024-2029) (%)
      • 10.4 Cloud - Market size and forecast (2024-2029)
        • Chart on Cloud - Market size and forecast (2024-2029) ($ million)
        • Data Table on Cloud - Market size and forecast (2024-2029) ($ million)
        • Chart on Cloud - Year-over-year growth (2024-2029) (%)
        • Data Table on Cloud - Year-over-year growth (2024-2029) (%)
      • 10.5 Market opportunity by Deployment
        • Market opportunity by $segment_name ($ million)
        • Data Table on Market opportunity by $segment_name ($ million)

      11 Market Segmentation by Organization Size

      • 11.1 Market segments
        • Chart on Organization Size - Market share (2024-2029) (%)
        • Data Table on Organization Size - Market share (2024-2029) (%)
      • 11.2 Comparison by Organization Size
        • Chart on Comparison by Organization Size
        • Data Table on Comparison by Organization Size
      • 11.3 Large enterprises - Market size and forecast (2024-2029)
        • Chart on Large enterprises - Market size and forecast (2024-2029) ($ million)
        • Data Table on Large enterprises - Market size and forecast (2024-2029) ($ million)
        • Chart on Large enterprises - Year-over-year growth (2024-2029) (%)
        • Data Table on Large enterprises - Year-over-year growth (2024-2029) (%)
      • 11.4 Small & medium-sized enterprises - Market size and forecast (2024-2029)
        • Chart on Small & medium-sized enterprises - Market size and forecast (2024-2029) ($ million)
        • Data Table on Small & medium-sized enterprises - Market size and forecast (2024-2029) ($ million)
        • Chart on Small & medium-sized enterprises - Year-over-year growth (2024-2029) (%)
        • Data Table on Small & medium-sized enterprises - Year-over-year growth (2024-2029) (%)
      • 11.5 Market opportunity by Organization Size
        • Market opportunity by $segment_name ($ million)
        • Data Table on Market opportunity by $segment_name ($ million)

      12 Customer Landscape

      • 12.1 Customer landscape overview
        • Analysis of price sensitivity, lifecycle, customer purchase basket, adoption rates, and purchase criteria

      13 Geographic Landscape

      • 13.1 Geographic segmentation
        • Chart on Market share by geography 2024-2029 (%)
        • Data Table on Market share by geography 2024-2029 (%)
      • 13.2 Geographic comparison
        • Chart on Geographic comparison
        • Data Table on Geographic comparison
      • 13.3 North America - Market size and forecast 2024-2029
        • Chart on North America - Market size and forecast 2024-2029 ($ million)
        • Data Table on North America - Market size and forecast 2024-2029 ($ million)
        • Chart on North America - Year-over-year growth 2024-2029 (%)
        • Data Table on North America - Year-over-year growth 2024-2029 (%)
      • 13.4 APAC - Market size and forecast 2024-2029
        • Chart on APAC - Market size and forecast 2024-2029 ($ million)
        • Data Table on APAC - Market size and forecast 2024-2029 ($ million)
        • Chart on APAC - Year-over-year growth 2024-2029 (%)
        • Data Table on APAC - Year-over-year growth 2024-2029 (%)
      • 13.5 Europe - Market size and forecast 2024-2029
        • Chart on Europe - Market size and forecast 2024-2029 ($ million)
        • Data Table on Europe - Market size and forecast 2024-2029 ($ million)
        • Chart on Europe - Year-over-year growth 2024-2029 (%)
        • Data Table on Europe - Year-over-year growth 2024-2029 (%)
      • 13.6 South America - Market size and forecast 2024-2029
        • Chart on South America - Market size and forecast 2024-2029 ($ million)
        • Data Table on South America - Market size and forecast 2024-2029 ($ million)
        • Chart on South America - Year-over-year growth 2024-2029 (%)
        • Data Table on South America - Year-over-year growth 2024-2029 (%)
      • 13.7 Middle East and Africa - Market size and forecast 2024-2029
        • Chart on Middle East and Africa - Market size and forecast 2024-2029 ($ million)
        • Data Table on Middle East and Africa - Market size and forecast 2024-2029 ($ million)
        • Chart on Middle East and Africa - Year-over-year growth 2024-2029 (%)
        • Data Table on Middle East and Africa - Year-over-year growth 2024-2029 (%)
      • 13.8 US - Market size and forecast 2024-2029
        • Chart on US - Market size and forecast 2024-2029 ($ million)
        • Data Table on US - Market size and forecast 2024-2029 ($ million)
        • Chart on US - Year-over-year growth 2024-2029 (%)
        • Data Table on US - Year-over-year growth 2024-2029 (%)
      • 13.9 China - Market size and forecast 2024-2029
        • Chart on China - Market size and forecast 2024-2029 ($ million)
        • Data Table on China - Market size and forecast 2024-2029 ($ million)
        • Chart on China - Year-over-year growth 2024-2029 (%)
        • Data Table on China - Year-over-year growth 2024-2029 (%)
      • 13.10 UK - Market size and forecast 2024-2029
        • Chart on UK - Market size and forecast 2024-2029 ($ million)
        • Data Table on UK - Market size and forecast 2024-2029 ($ million)
        • Chart on UK - Year-over-year growth 2024-2029 (%)
        • Data Table on UK - Year-over-year growth 2024-2029 (%)
      • 13.11 India - Market size and forecast 2024-2029
        • Chart on India - Market size and forecast 2024-2029 ($ million)
        • Data Table on India - Market size and forecast 2024-2029 ($ million)
        • Chart on India - Year-over-year growth 2024-2029 (%)
        • Data Table on India - Year-over-year growth 2024-2029 (%)
      • 13.12 Canada - Market size and forecast 2024-2029
        • Chart on Canada - Market size and forecast 2024-2029 ($ million)
        • Data Table on Canada - Market size and forecast 2024-2029 ($ million)
        • Chart on Canada - Year-over-year growth 2024-2029 (%)
        • Data Table on Canada - Year-over-year growth 2024-2029 (%)
      • 13.13 Japan - Market size and forecast 2024-2029
        • Chart on Japan - Market size and forecast 2024-2029 ($ million)
        • Data Table on Japan - Market size and forecast 2024-2029 ($ million)
        • Chart on Japan - Year-over-year growth 2024-2029 (%)
        • Data Table on Japan - Year-over-year growth 2024-2029 (%)
      • 13.14 South Korea - Market size and forecast 2024-2029
        • Chart on South Korea - Market size and forecast 2024-2029 ($ million)
        • Data Table on South Korea - Market size and forecast 2024-2029 ($ million)
        • Chart on South Korea - Year-over-year growth 2024-2029 (%)
        • Data Table on South Korea - Year-over-year growth 2024-2029 (%)
      • 13.15 Germany - Market size and forecast 2024-2029
        • Chart on Germany - Market size and forecast 2024-2029 ($ million)
        • Data Table on Germany - Market size and forecast 2024-2029 ($ million)
        • Chart on Germany - Year-over-year growth 2024-2029 (%)
        • Data Table on Germany - Year-over-year growth 2024-2029 (%)
      • 13.16 France - Market size and forecast 2024-2029
        • Chart on France - Market size and forecast 2024-2029 ($ million)
        • Data Table on France - Market size and forecast 2024-2029 ($ million)
        • Chart on France - Year-over-year growth 2024-2029 (%)
        • Data Table on France - Year-over-year growth 2024-2029 (%)
      • 13.17 Italy - Market size and forecast 2024-2029
        • Chart on Italy - Market size and forecast 2024-2029 ($ million)
        • Data Table on Italy - Market size and forecast 2024-2029 ($ million)
        • Chart on Italy - Year-over-year growth 2024-2029 (%)
        • Data Table on Italy - Year-over-year growth 2024-2029 (%)
      • 13.18 Market opportunity by geography
        • Market opportunity by geography ($ million)
        • Data Tables on Market opportunity by geography ($ million)

      14 Drivers, Challenges, and Opportunity/Restraints

      • 14.1 Market drivers
        • 14.2 Market challenges
          • 14.3 Impact of drivers and challenges
            • Impact of drivers and challenges in 2024 and 2029
          • 14.4 Market opportunities/restraints

            15 Competitive Landscape

            • 15.1 Overview
              • 15.2 Competitive Landscape
                • Overview on criticality of inputs and factors of differentiation
              • 15.3 Landscape disruption
                • Overview on factors of disruption
              • 15.4 Industry risks
                • Impact of key risks on business

              16 Competitive Analysis

              • 16.1 Companies profiled
                • Companies covered
              • 16.2 Company ranking index
                • Company ranking index
              • 16.3 Market positioning of companies
                • Matrix on companies position and classification
              • 16.4 Axonify Inc.
                • Axonify Inc. - Overview
                • Axonify Inc. - Product / Service
                • Axonify Inc. - Key news
                • Axonify Inc. - Key offerings
                • SWOT
              • 16.5 Bigtincan Holdings Ltd.
                • Bigtincan Holdings Ltd. - Overview
                • Bigtincan Holdings Ltd. - Product / Service
                • Bigtincan Holdings Ltd. - Key offerings
                • SWOT
              • 16.6 BTS Group AB
                • BTS Group AB - Overview
                • BTS Group AB - Business segments
                • BTS Group AB - Key offerings
                • BTS Group AB - Segment focus
                • SWOT
              • 16.7 Cornerstone OnDemand Inc.
                • Cornerstone OnDemand Inc. - Overview
                • Cornerstone OnDemand Inc. - Product / Service
                • Cornerstone OnDemand Inc. - Key news
                • Cornerstone OnDemand Inc. - Key offerings
                • SWOT
              • 16.8 Cross Knowledge
                • Cross Knowledge - Overview
                • Cross Knowledge - Product / Service
                • Cross Knowledge - Key offerings
                • SWOT
              • 16.9 ELB Learning
                • ELB Learning - Overview
                • ELB Learning - Product / Service
                • ELB Learning - Key offerings
                • SWOT
              • 16.10 Epignosis LLC
                • Epignosis LLC - Overview
                • Epignosis LLC - Product / Service
                • Epignosis LLC - Key offerings
                • SWOT
              • 16.11 Gnowbe Group Ltd.
                • Gnowbe Group Ltd. - Overview
                • Gnowbe Group Ltd. - Product / Service
                • Gnowbe Group Ltd. - Key offerings
                • SWOT
              • 16.12 GoSkills Ltd.
                • GoSkills Ltd. - Overview
                • GoSkills Ltd. - Product / Service
                • GoSkills Ltd. - Key offerings
                • SWOT
              • 16.13 International Business Machines Corp.
                • International Business Machines Corp. - Overview
                • International Business Machines Corp. - Business segments
                • International Business Machines Corp. - Key news
                • International Business Machines Corp. - Key offerings
                • International Business Machines Corp. - Segment focus
                • SWOT
              • 16.14 iSpring Solutions Inc.
                • iSpring Solutions Inc. - Overview
                • iSpring Solutions Inc. - Product / Service
                • iSpring Solutions Inc. - Key offerings
                • SWOT
              • 16.15 Larsen and Toubro Ltd.
                • Larsen and Toubro Ltd. - Overview
                • Larsen and Toubro Ltd. - Business segments
                • Larsen and Toubro Ltd. - Key news
                • Larsen and Toubro Ltd. - Key offerings
                • Larsen and Toubro Ltd. - Segment focus
                • SWOT
              • 16.16 Multiversity Pvt. Ltd.
                • Multiversity Pvt. Ltd. - Overview
                • Multiversity Pvt. Ltd. - Product / Service
                • Multiversity Pvt. Ltd. - Key offerings
                • SWOT
              • 16.17 Neovation Corp.
                • Neovation Corp. - Overview
                • Neovation Corp. - Product / Service
                • Neovation Corp. - Key offerings
                • SWOT
              • 16.18 Qstream Inc.
                • Qstream Inc. - Overview
                • Qstream Inc. - Product / Service
                • Qstream Inc. - Key offerings
                • SWOT

              17 Appendix

              • 17.1 Scope of the report
                • 17.2 Inclusions and exclusions checklist
                  • Inclusions checklist
                  • Exclusions checklist
                • 17.3 Currency conversion rates for US$
                  • Currency conversion rates for US$
                • 17.4 Research methodology
                  • Research methodology
                • 17.5 Data procurement
                  • Information sources
                • 17.6 Data validation
                  • Data validation
                • 17.7 Validation techniques employed for market sizing
                  • Validation techniques employed for market sizing
                • 17.8 Data synthesis
                  • Data synthesis
                • 17.9 360 degree market analysis
                  • 360 degree market analysis
                • 17.10 List of abbreviations
                  • List of abbreviations

                Research Methodology

                Technavio presents a detailed picture of the market by way of study, synthesis, and summation of data from multiple sources. The analysts have presented the various facets of the market with a particular focus on identifying the key industry influencers. The data thus presented is comprehensive, reliable, and the result of extensive research, both primary and secondary.

                INFORMATION SOURCES

                Primary sources

                • Manufacturers and suppliers
                • Channel partners
                • Industry experts
                • Strategic decision makers

                Secondary sources

                • Industry journals and periodicals
                • Government data
                • Financial reports of key industry players
                • Historical data
                • Press releases

                DATA ANALYSIS

                Data Synthesis

                • Collation of data
                • Estimation of key figures
                • Analysis of derived insights

                Data Validation

                • Triangulation with data models
                • Reference against proprietary databases
                • Corroboration with industry experts

                REPORT WRITING

                Qualitative

                • Market drivers
                • Market challenges
                • Market trends
                • Five forces analysis

                Quantitative

                • Market size and forecast
                • Market segmentation
                • Geographical insights
                • Competitive landscape

                Interested in this report?

                Get your sample now to see our research methodology and insights!

                Download Now

                Frequently Asked Questions

                Microlearning market growth will increase by $ 3147.6 mn during 2025-2029.

                The Microlearning market is expected to grow at a CAGR of 15% during 2025-2029.

                Microlearning market is segmented by Component( Solution, Services, BFSI, Healthcare, Others) Industry Application( Retail, Manufacturing and logistics, BFSI, Healthcare, Others)

                Axonify Inc., Bigtincan Holdings Ltd., BTS Group AB, Cornerstone OnDemand Inc., Cross Knowledge, ELB Learning, Epignosis LLC, Gnowbe Group Ltd., GoSkills Ltd., Inkling Systems Inc., International Business Machines Corp., iSpring Solutions Inc., Larsen and Toubro Ltd., Multiversity Pvt. Ltd., Neovation Corp., Pryor Learning, Qstream Inc., SmartUp.io Ltd., SweetRush Inc. are a few of the key vendors in the Microlearning market.

                North America will register the highest growth rate of 37% among the other regions. Therefore, the Microlearning market in North America is expected to garner significant business opportunities for the vendors during the forecast period.

                US, China, UK, India, Canada, Japan, South Korea, Germany, France, Italy

                • Growing government initiativesThe emergence of microlearning has helped educational institutions transform conventional learning methods. Governments globally have taken initiatives to promote e-learning to improve education services. For instance is the driving factor this market.
                • in May 2020 is the driving factor this market.
                • the Government of India launched PM E-Vidhya is the driving factor this market.
                • which is a comprehensive program to unify digital and online education with education programs for better reach and access to e-learning. The US government has the NASA App to educate learners about NASA missions and space is the driving factor this market.
                • among others. The app has an interface of videos is the driving factor this market.
                • images is the driving factor this market.
                • and audio. Similarly is the driving factor this market.
                • in Australia is the driving factor this market.
                • apps such as AirForce News Australia is the driving factor this market.
                • ANGB Birds is the driving factor this market.
                • and ABS Stat have been launched by the government to increase knowledge reach. In addition is the driving factor this market.
                • the governments of countries such as Thailand is the driving factor this market.
                • China is the driving factor this market.
                • and Hong Kong are offering tablets to aid in education. Furthermore is the driving factor this market.
                • some regional governments are increasing the funding for various initiatives to boost microlearning platforms. Education is the driving factor this market.
                • in particular is the driving factor this market.
                • has changed in the post-Covid age is the driving factor this market.
                • making technology-based learning - whether online or blended - essential for Indias educational systems. The Union Budget 2022 of India emphasized deeper penetration of digital education across the country and promoting upskilling. Thus is the driving factor this market.
                • the emphasis of governments on microlearning in different regions will further drive the growth of the global microlearning market during the forecast period. is the driving factor this market.

                The Microlearning market vendors should focus on grabbing business opportunities from the Solution segment as it accounted for the largest market share in the base year.