
Gas Sensors Market Size 2026-2030
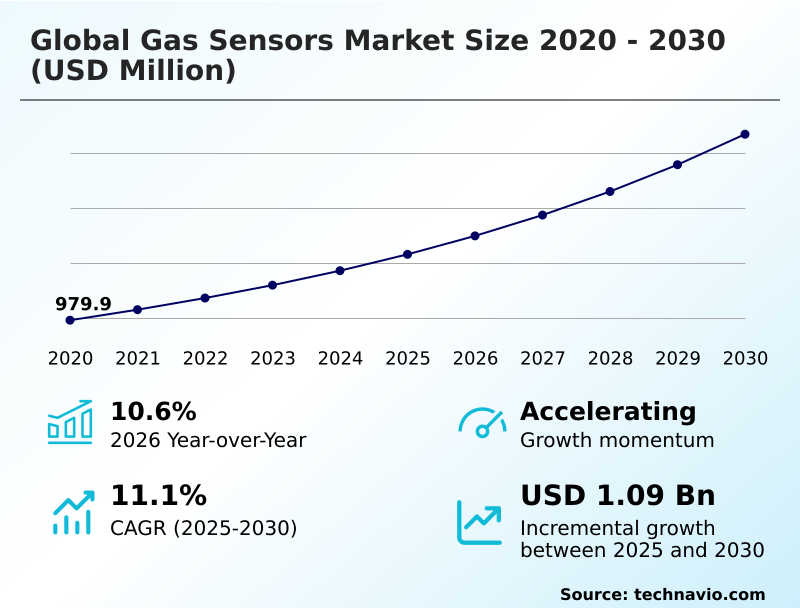
The gas sensors market size is valued to increase by USD 1.09 billion, at a CAGR of 11.1% from 2025 to 2030. Regulatory requirements for environmental protection and emissions control will drive the gas sensors market.
Major Market Trends & Insights
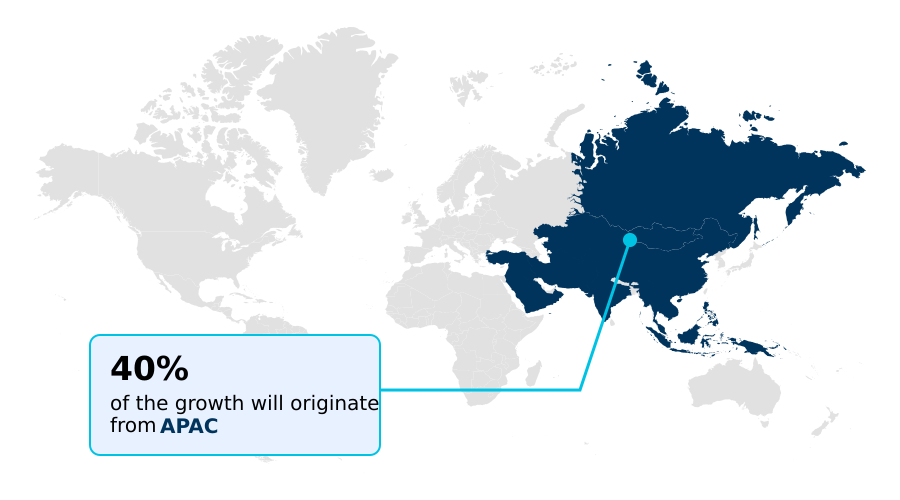
- APAC dominated the market and accounted for a 39.5% growth during the forecast period.
- By Type - Wired segment was valued at USD 937.2 million in 2024
- By End-user - Industrial segment accounted for the largest market revenue share in 2024
Market Size & Forecast
- Market Opportunities: USD 1.69 billion
- Market Future Opportunities: USD 1.09 billion
- CAGR from 2025 to 2030 : 11.1%
Market Summary
- The gas sensors market is defined by its critical role in industrial safety applications and environmental monitoring systems. Devices operating on principles like electrochemical sensing technologies and photoacoustic technologies are essential for detecting hazardous substances across manufacturing, energy, and transportation sectors.
- Growth is fueled by stringent regulations for automotive emission control and indoor air quality monitoring, alongside a heightened focus on workplace safety. A key trend involves integrating sensors with IoT platforms for predictive maintenance analytics, enabling proactive risk management.
- For instance, a petrochemical facility can leverage real-time data from a network of sensors for methane emissions monitoring, analyzing patterns to predict potential equipment failures and schedule maintenance, thus preventing leaks and ensuring compliance.
- However, the market faces challenges from technical limitations like calibration drift and the high costs of implementing sophisticated smart building systems, which can temper adoption rates in price-sensitive segments.
What will be the Size of the Gas Sensors Market during the forecast period?
Get Key Insights on Market Forecast (PDF) Get Free Sample
How is the Gas Sensors Market Segmented?
The gas sensors industry research report provides comprehensive data (region-wise segment analysis), with forecasts and estimates in "USD million" for the period 2026-2030, as well as historical data from 2020-2024 for the following segments.
- Type
- Wired
- Wireless
- End-user
- Industrial
- Petrochemical
- Building automation and domestic appliances
- Automotive
- Others
- Product type
- Carbon dioxide
- Carbon monoxide
- Oxygen
- Methane
- Others
- Geography
- APAC
- China
- Japan
- India
- North America
- US
- Canada
- Mexico
- Europe
- Germany
- UK
- France
- South America
- Brazil
- Argentina
- Middle East and Africa
- Saudi Arabia
- UAE
- South Africa
- Rest of World (ROW)
- APAC
By Type Insights
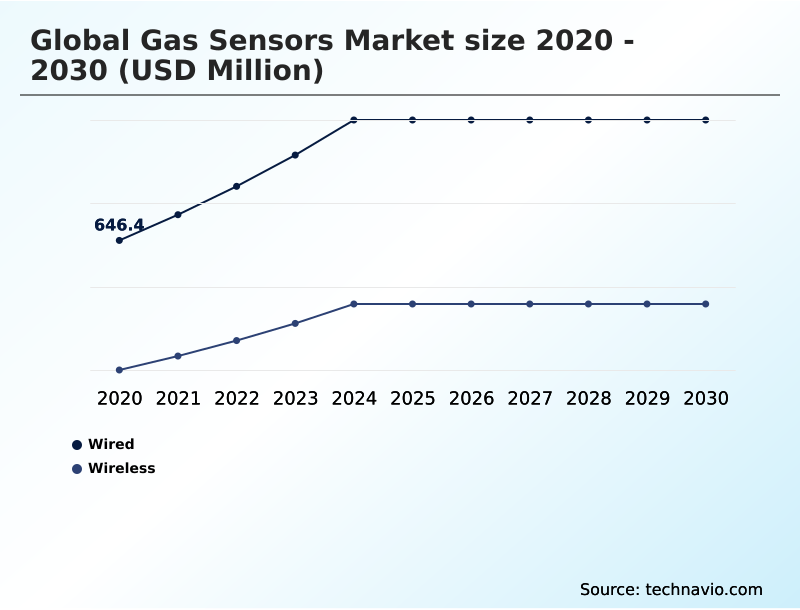
The wired segment is estimated to witness significant growth during the forecast period.
Wired systems remain integral to industrial safety applications, where uninterrupted real-time data transmission is critical for asset integrity management and process control optimization.
These configurations, built on established electrochemical sensing technologies and infrared sensing technologies, provide the backbone for hazardous gas monitoring. Their physical connection ensures reliable detection of both toxic gas and combustible gas, enabling immediate system integration with emergency controls.
This reliability is paramount for upholding workplace safety protocols and achieving regulatory compliance monitoring, especially in large-scale facilities.
By forming the core of connected safety platforms, wired networks support operational continuity, with new designs reducing false alarms by over 90%, thereby enhancing both safety and efficiency in high-risk environments.
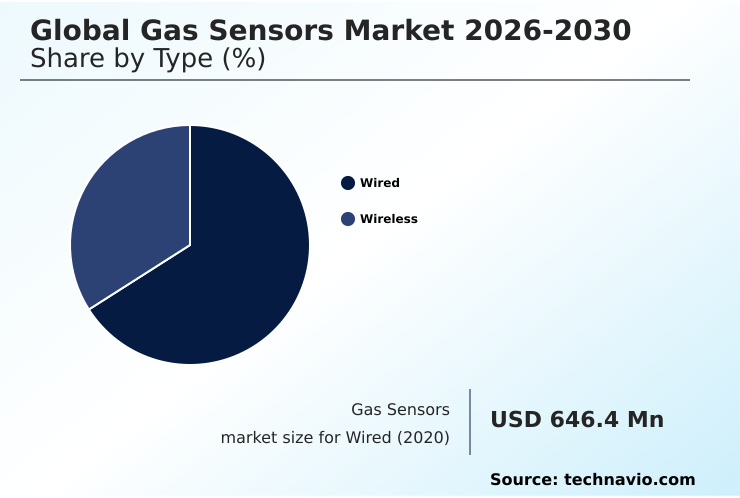
The Wired segment was valued at USD 937.2 million in 2024 and showed a gradual increase during the forecast period.
Regional Analysis
APAC is estimated to contribute 39.5% to the growth of the global market during the forecast period.Technavio’s analysts have elaborately explained the regional trends and drivers that shape the market during the forecast period.
See How Gas Sensors Market Demand is Rising in APAC Get Free Sample
The geographic landscape of the market is characterized by diverse regional dynamics, with APAC set to contribute 39.5% of the market's incremental growth, driven by rapid industrialization.
This region, along with North America, demonstrates strong adoption of technologies for flammable gas detection and carbon dioxide sensing, fueled by stringent environmental policies.
In Europe, the focus on indoor air quality monitoring and environmental stewardship propels demand for sensors in smart infrastructure. Growth in North America is projected to be robust, with a regional growth rate of 11.3%, slightly trailing APAC's 11.7%.
The use of remote monitoring capabilities and automated alert systems is expanding globally, supporting applications in ammonia detection and nitrogen oxide sensors.
These integrated solutions, leveraging cloud-based analytics for leak detection and repair, are critical for maintaining fuel cell safety and meeting compliance standards worldwide.
Market Dynamics
Our researchers analyzed the data with 2025 as the base year, along with the key drivers, trends, and challenges. A holistic analysis of drivers will help companies refine their marketing strategies to gain a competitive advantage.
- Navigating the complexities of the gas sensors market requires balancing the cost of electrochemical vs infrared sensors with specific application needs. The increasing trend of gas sensor integration in smart homes and the use of ndir co2 sensor for hvac systems highlight the shift toward consumer-facing applications.
- In industrial settings, the core challenge remains improving selectivity in multi-gas environments, which directly impacts the maintenance cycles for industrial gas detectors. While challenges in wireless gas sensor networks persist, advancements in low power sensors for iot applications are providing new solutions.
- The development of a specialized hydrogen sensor for fuel cell vehicles and effective methane monitoring in oil and gas are critical for the energy transition. For workplace safety, portable voc monitors for workplace safety are becoming standard. This is governed by regulatory standards for emissions monitoring sensors, which also drive innovation in ai algorithms for reducing false alarms.
- Key technical hurdles include cross-sensitivity issues in toxic gas detection and strict calibration requirements for compliance-grade sensors, which can reduce maintenance cycles by half compared to legacy systems. Emerging applications include gas sensors for agricultural process control, breath analysis with medical gas sensors, and leveraging real-time data for emergency response systems.
- Miniaturization trends in wearable gas detectors and designing sensor networks for smart city air quality further underscore the market's evolution, though the impact of humidity on sensor accuracy remains a persistent issue to address.
What are the key market drivers leading to the rise in the adoption of Gas Sensors Industry?
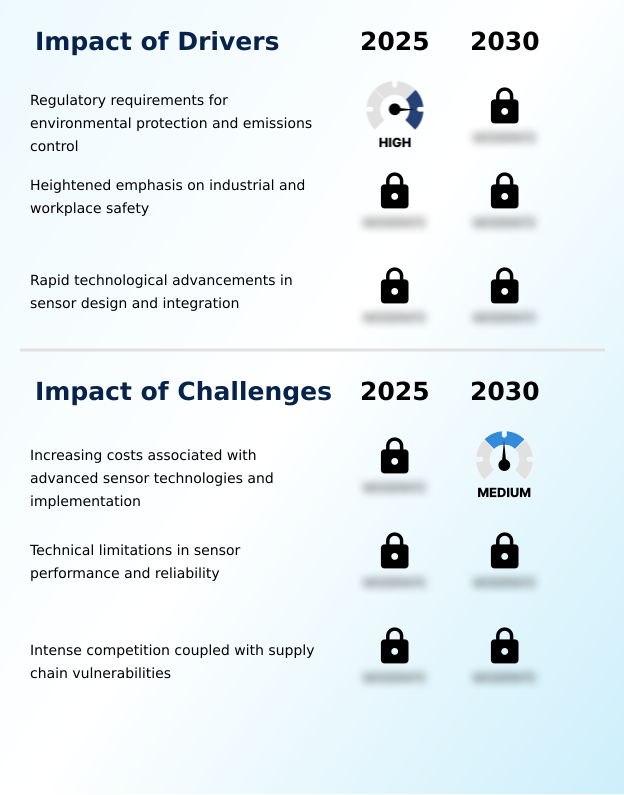
- Regulatory requirements for environmental protection and emissions control are a key driver for the market, compelling industries to adopt advanced gas detection technologies.
- Market growth is fundamentally driven by stringent regulatory frameworks mandating advanced environmental monitoring systems and automotive emission control. The need to comply with emissions reporting standards has spurred innovation in digital sensing solutions and advanced sensor materials.
- These technologies provide precise data for air quality indexing, enabling more effective data-driven decision-making.
- In industrial settings, the emphasis on safety has accelerated the adoption of catalytic sensing technologies and non-dispersive infrared sensors for methane emissions monitoring, contributing to significant operational efficiency gains.
- For instance, implementation in smart building systems has demonstrated an ability to reduce energy costs by up to 10%. Enhanced sensor accuracy, now exceeding 95% in many applications, is critical for ensuring workplace safety and public health.
What are the market trends shaping the Gas Sensors Industry?
- The increasing integration of IoT and connectivity features is transforming gas sensing solutions into intelligent, networked devices. This trend enhances remote monitoring and data-driven decision-making across industries.
- Key market trends are reshaping sensor utility, led by advancements in miniaturized sensor design and low-power operation. These developments enable sophisticated wearable safety devices and expand applications in space-constrained environments. The integration of wireless communication protocols with sensor data analytics facilitates predictive maintenance analytics, with some industrial users reporting a 25% reduction in unplanned downtime.
- This connectivity supports proactive risk management through continuous emissions tracking. Furthermore, the focus on clean energy is driving demand for specialized hydrogen leak detection and trace gas detection capabilities. The use of photoacoustic technologies and AI-enabled sensing is improving accuracy, with smart ventilation control systems showing a 15% improvement in energy efficiency by optimizing air quality based on real-time data.
What challenges does the Gas Sensors Industry face during its growth?
- The high costs associated with the development, implementation, and maintenance of advanced sensor technologies present a key challenge to market growth.
- The market faces significant hurdles, primarily the high cost and complexity of implementing advanced multi-gas detection systems. The initial investment in metal oxide semiconductor sensors and associated portable gas analyzers, combined with ongoing calibration drift management, can increase total ownership costs by up to 40%.
- Technical performance limits, such as cross-sensitivity reduction and the need for sophisticated sensor fusion techniques, present ongoing R&D challenges. In complex industrial settings, these issues can lead to false alarm rates of 10% without advanced algorithms. Furthermore, supply chain resilience is a growing concern, impacting the availability of critical components and affecting hazardous area classification timelines.
- Addressing battery health monitoring and energy consumption reduction in wireless devices adds another layer of complexity to design and deployment.
Exclusive Technavio Analysis on Customer Landscape
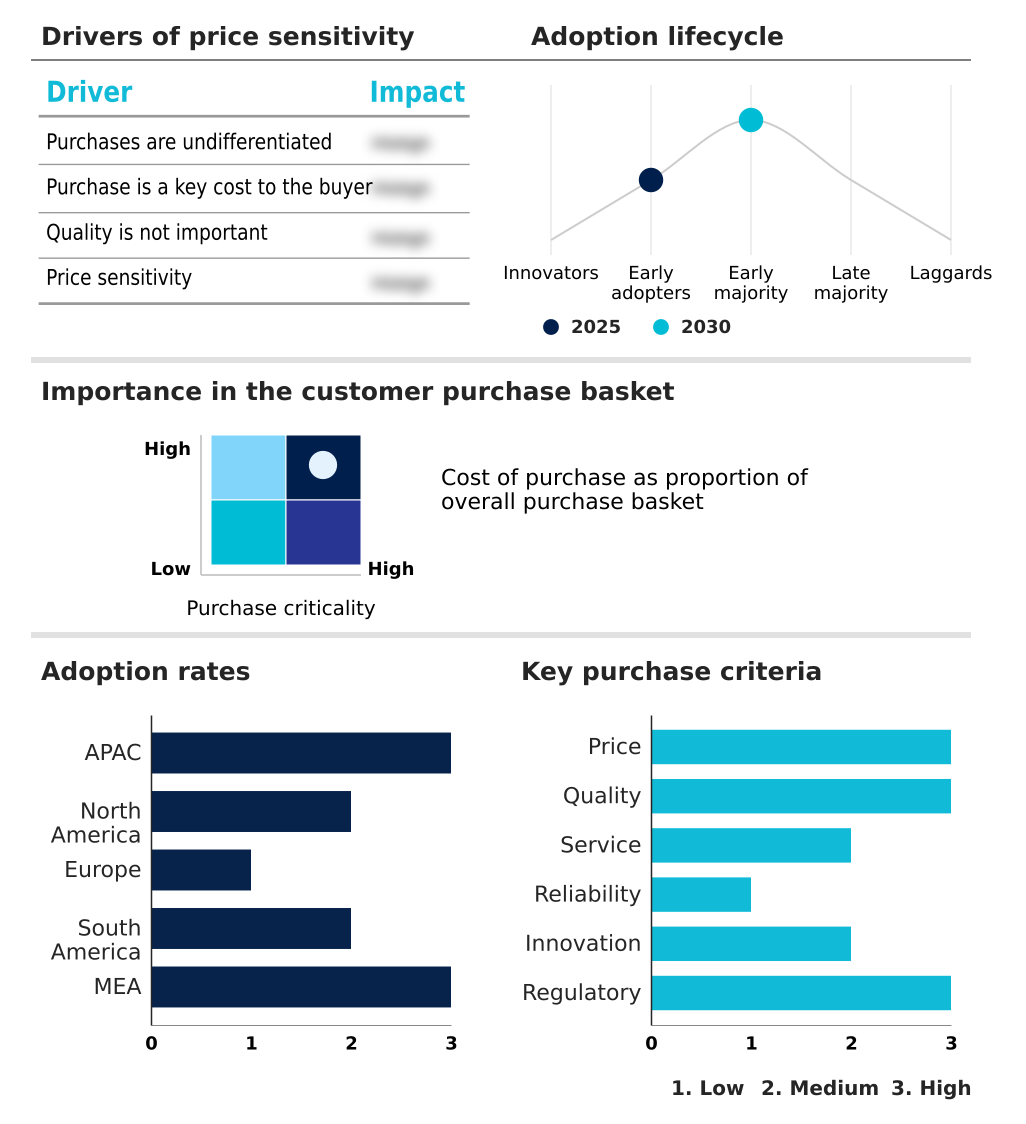
The gas sensors market forecasting report includes the adoption lifecycle of the market, covering from the innovator’s stage to the laggard’s stage. It focuses on adoption rates in different regions based on penetration. Furthermore, the gas sensors market report also includes key purchase criteria and drivers of price sensitivity to help companies evaluate and develop their market growth analysis strategies.
Customer Landscape of Gas Sensors Industry
Competitive Landscape
Companies are implementing various strategies, such as strategic alliances, gas sensors market forecast, partnerships, mergers and acquisitions, geographical expansion, and product/service launches, to enhance their presence in the industry.
ABB Ltd. - Offerings include analytical gas measurement systems for leak detection and process monitoring, leveraging optical and laser-based technologies for various industrial gases in energy and manufacturing environments.
The industry research and growth report includes detailed analyses of the competitive landscape of the market and information about key companies, including:
- ABB Ltd.
- AMETEK Inc.
- Amphenol Corp.
- ams OSRAM AG
- Angst Pfister Group
- Bosch Sensortec GmbH
- DENSO Corp.
- Dragerwerk AG and Co. KGaA
- eLichens
- Figaro Engineering Inc.
- GASTEC Corp.
- Honeywell International Inc.
- Industrial Scientific Corp.
- Membrapor AG
- Nemoto and Co. Ltd.
- Niterra Co. Ltd.
- Senseair AB
- Sensirion AG
- Siemens AG
Qualitative and quantitative analysis of companies has been conducted to help clients understand the wider business environment as well as the strengths and weaknesses of key industry players. Data is qualitatively analyzed to categorize companies as pure play, category-focused, industry-focused, and diversified; it is quantitatively analyzed to categorize companies as dominant, leading, strong, tentative, and weak.
Recent Development and News in Gas sensors market
- In May 2025, Honeywell International Inc. introduced its Hydrogen Leak Detector solution, designed to identify microscopic hydrogen leaks in real-time to enhance safety in the growing hydrogen economy.
- In March 2025, Honeywell International Inc. launched a multirange residential smart gas meter to enhance safety for customers and utilities through automation and remote operation.
- In January 2025, MSA Safety Incorporated introduced the SENTRY io Controller, a gas and flame monitoring system that leverages data analytics to lower operational costs and maintenance for detectors.
- In January 2025, Sensirion Connected Solutions announced its acquisition of Kuva Systems, expanding its capabilities in methane emissions monitoring with advanced detection technologies.
Dive into Technavio’s robust research methodology, blending expert interviews, extensive data synthesis, and validated models for unparalleled Gas Sensors Market insights. See full methodology.
| Market Scope | |
|---|---|
| Page number | 313 |
| Base year | 2025 |
| Historic period | 2020-2024 |
| Forecast period | 2026-2030 |
| Growth momentum & CAGR | Accelerate at a CAGR of 11.1% |
| Market growth 2026-2030 | USD 1091.8 million |
| Market structure | Fragmented |
| YoY growth 2025-2026(%) | 10.6% |
| Key countries | China, Japan, India, South Korea, Australia, Indonesia, US, Canada, Mexico, Germany, UK, France, Italy, Spain, The Netherlands, Brazil, Argentina, Chile, Saudi Arabia, UAE, South Africa, Israel and Turkey |
| Competitive landscape | Leading Companies, Market Positioning of Companies, Competitive Strategies, and Industry Risks |
Research Analyst Overview
- The gas sensors market is undergoing a significant transformation, driven by the convergence of multiple sensing principles, including electrochemical sensing technologies, infrared sensing technologies, and catalytic sensing technologies. The integration of photoacoustic technologies and non-dispersive infrared sensors is enhancing precision in critical industrial safety applications.
- We are seeing a push toward miniaturized sensor design using microelectromechanical systems, enabling advancements in portable gas analyzers and wearable safety devices. These systems are crucial for hazardous gas monitoring, including toxic gas detection, combustible gas detection, and flammable gas detection.
- Boardroom decisions are increasingly influenced by the need for robust methane emissions monitoring and hydrogen leak detection to meet sustainability goals. Innovations in thermal-mass technology and gas mixing technology are improving multi-gas detection capabilities. As a result of these advancements, firms are achieving up to a 30% reduction in incident response times.
- This evolution makes sensors for carbon dioxide sensing, oxygen level monitoring, ammonia detection, and nitrogen oxide sensors integral to modern environmental monitoring systems, automotive emission control, and smart building systems, all supported by predictive maintenance analytics and wireless communication protocols.
What are the Key Data Covered in this Gas Sensors Market Research and Growth Report?
-
What is the expected growth of the Gas Sensors Market between 2026 and 2030?
-
USD 1.09 billion, at a CAGR of 11.1%
-
-
What segmentation does the market report cover?
-
The report is segmented by Type (Wired, and Wireless), End-user (Industrial, Petrochemical, Building automation and domestic appliances, Automotive, and Others), Product Type (Carbon dioxide, Carbon monoxide, Oxygen, Methane, and Others) and Geography (APAC, North America, Europe, South America, Middle East and Africa)
-
-
Which regions are analyzed in the report?
-
APAC, North America, Europe, South America and Middle East and Africa
-
-
What are the key growth drivers and market challenges?
-
Regulatory requirements for environmental protection and emissions control, Increasing costs associated with advanced sensor technologies and implementation
-
-
Who are the major players in the Gas Sensors Market?
-
ABB Ltd., AMETEK Inc., Amphenol Corp., ams OSRAM AG, Angst Pfister Group, Bosch Sensortec GmbH, DENSO Corp., Dragerwerk AG and Co. KGaA, eLichens, Figaro Engineering Inc., GASTEC Corp., Honeywell International Inc., Industrial Scientific Corp., Membrapor AG, Nemoto and Co. Ltd., Niterra Co. Ltd., Senseair AB, Sensirion AG and Siemens AG
-
Market Research Insights
- The market's momentum is shaped by the adoption of digital sensing solutions and connected safety platforms, which enable superior proactive risk management and regulatory compliance monitoring. Through remote monitoring capabilities and automated alert systems, organizations achieve significant operational efficiency gains. Integrating advanced sensor materials with AI-enabled sensing and cloud-based analytics facilitates real-time gas measurement and continuous emissions tracking.
- This data-driven decision-making, supported by robust sensor data analytics, improves asset integrity management and process control optimization. For example, implementing smart ventilation control based on air quality indexing can lead to energy consumption reduction of up to 15%.
- Furthermore, these technologies enhance supply chain resilience and fuel cell safety, underpinning a comprehensive approach to environmental stewardship and workplace safety protocols that can increase compliance rates by 20%.
We can help! Our analysts can customize this gas sensors market research report to meet your requirements.
 RIA -
RIA - 
