Gems and Jewelry Market Analysis APAC, North America, Europe, Middle East and Africa, South America - China, US, India, Canada, UK - Size and Forecast 2024-2028

Gems and Jewelry Market Analysis APAC, North America, Europe, Middle East and Africa, South America - China, US, India, Canada, UK - Size and Forecast 2024-2028

Published: Aug 2024 182 Pages SKU: IRTNTR71696

Market Overview at a Glance

$172.6 B
Market Opportunity
8.62%
CAGR
6.23
YoY growth 2023-2024(%)

Gems and Jewelry Market Size 2024-2028

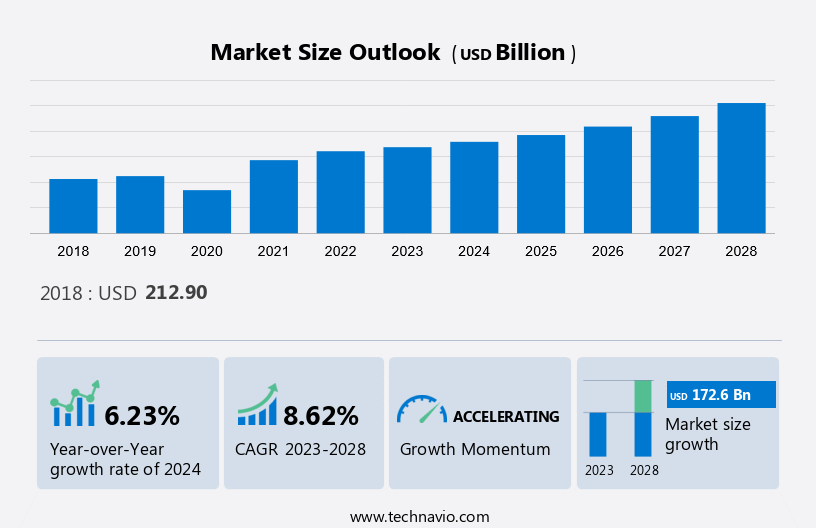
The gems and jewelry market size is estimated to grow USD 172.6 billion, at a CAGR of 8.62% between 2023 and 2028.

  • The market growth is driven by escalating demand for wedding jewelry, particularly in nations like India, where cultural significance is profound and the jewelry market is thriving. Bridal collections, encompassing necklaces, wedding bands, and engagement rings, and bridal wear are coveted globally for their elegance and symbolism. The rings segment in particular holds a substantial share in the market. India's growing middle-class populace and heightened disposable income propel amplified investments in bridal assortments, establishing it as a pivotal market within the global gems and jewelry landscape.
  • The gems and jewelry market is experiencing growth driven by sustainability and ethical sourcing trends, with lab-grown diamonds gaining popularity. Customization and personalization are increasingly important in the industry, reflecting consumer demand. The online jewelry retail growth supports this trend, while the luxury jewelry market continues to expand. Additionally, the resurgence of gold jewelry and emerging gems and jewelry trends are shaping the future of the market, as highlighted in recent growth analysis reports.

What will be the Gems and Jewelry Market Size During the Forecast Period?

Gems And Jewelry Market Size

To learn more about this market report, View Sample PDF

How is the Gems and Jewelry Market Segmented?

The market research report provides comprehensive data (region wise segment analysis), with forecasts and estimates in "USD billion" for the period 2024 to 2028, as well as historical data from 2018 to 2022 for the following segments.

  • Distribution Channel Outlook 
    • Offline
    • Online
  • Type Outlook 
    • Gold
    • Platinum
    • Silver
    • Diamond
    • Gemstones
  • Region Outlook 
    • North America
      • The U.S.
      • Canada
    • Europe
      • The U.K.
      • Germany
      • France
      • Rest of Europe
    • APAC
      • China
      • India
    • South America
      • Chile
      • Argentina
      • Brazil
    • Middle East & Africa
      • Saudi Arabia
      • South Africa
      • Rest of the Middle East & Africa

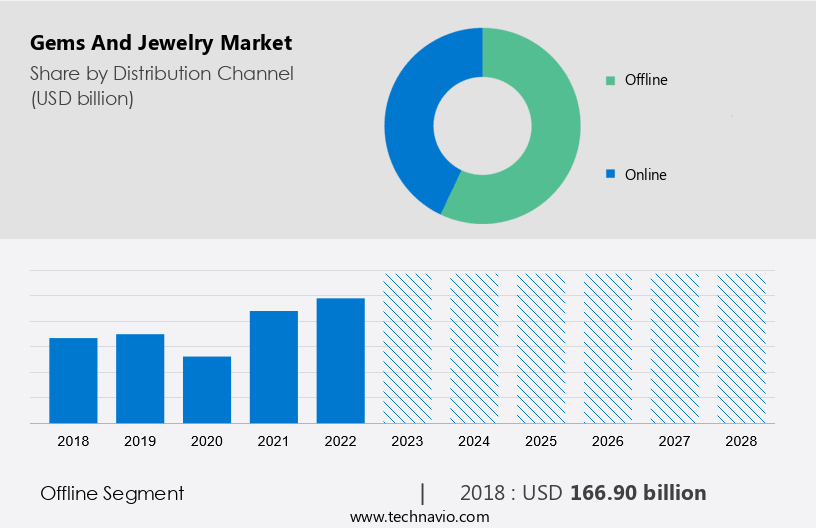
By Distribution Channel

  • The market share growth by the offline segment will be significant during the forecast period. The revenue of the offline distribution channel comes from the sales of products through speciality stores (including exclusive brand stores, multi-brand stores, and premium fashion stores); hypermarkets, supermarkets, and clubhouse stores; and department stores. Over the years, the revenue of the offline distribution channel has witnessed a gradual decline due to the shift in consumer preference toward online jewelry. To fuel sales through offline channels, players are managing their sales through store expansions in the local and regional markets, which will increase the growth of the segment during the forecast period.

Gems And Jewelry Market Size

Get a glance at the market contribution of various segments. View Sample PDF

  • The offline segment was valued at USD 166.90 billion in 2018 and continued to grow by 2022. In this segment, companies are also accelerating their offline sales by widening their store operations at different geographic locations. This helped the company generate and sell products efficiently and cater to every consumer category in large geographic areas. This not only raises the sales of jewelry products but also fuels the sales of the market. The huge growth in retail channels in different cities and regions will drive customer familiarization with different types of gems and jewelry. It will also increase the value sales of the market during the forecast period. Although the offline distribution channel is losing its market and popularity to the online channel, extensive and innovative marketing will drive sales through the channel at a steady rate.

Regional Analysis

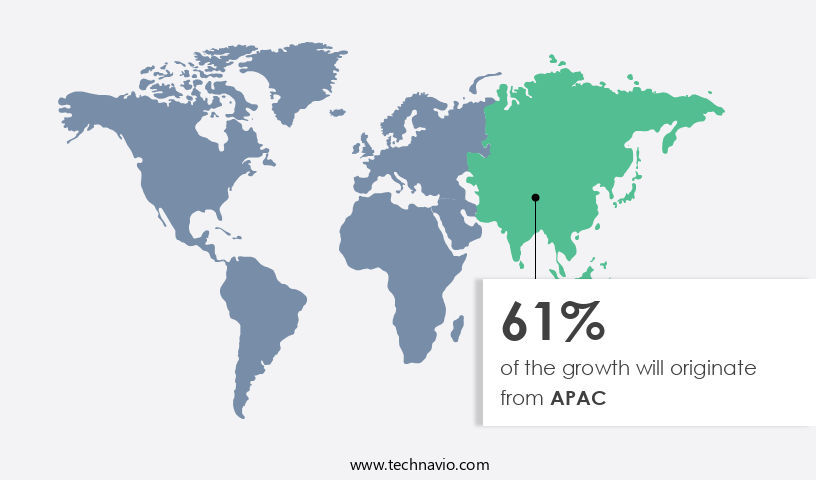
  • APAC is estimated to contribute 61% to the growth of the global market during the forecast period. Technavio's analysts have elaborately explained the regional trends and drivers that shape the market during the forecast period. In 2022, the market in APAC was the largest segment of the market and is expected to grow at a significant rate as compared to other regions. The growth of the market in APAC is attributable to the rising economic growth, expanding middle-class population base, and a growing number of players operating in the region. The key leading countries in the region are China, India, and Japan. The strong contribution from China and India to the market was majorly due to the great demand (especially those that are made of gold). Such factors will stimulate gems and jewelry market growth during the forecast period.

Gems And Jewelry Market Share by Geography

For more insights on the market share of various regions, View the Sample PDF now!

  • Countries such as India, China, Australia, Malaysia, and Japan were severely affected by the COVID-19 pandemic, especially in 2020. However, the lockdown restrictions were lifted in the second half of 2020 owing to large-scale vaccination drives across APAC. This has led to the reopening of jewelry malls and shops in the first half of 2021. Moreover, the growing trend of renting men's accessories for various social events and the increase in disposable incomes are expected to recover and stabilize the growth of the market in the region during the forecast period. Moreover, companies adopt several strategies, such as the expansion of the business to increase their market reach. Such initiatives taken by companies are expected to drive the growth of the market in APAC during the forecast period.

What are the Gems and Jewelry Market Dynamics Shaping Growth?

  • The market sparkles with a blend of tradition, fashion trend, and consumer preferences, offering a dazzling array of ornaments and accessories. From single-stone stud earrings to intricate pendants and rings, the industry caters to diverse tastes and spending powers. Embracing luxury metals like gold, silver, and platinum, along with exquisite gemstones and diamonds, it reflects different cultures and gift exchange practices worldwide. With a focus on authenticity, purity, and ethical practices, consumers, including the middle-class group, seek customized pieces through online retail channels. Designers leverage technology to create timeless treasures, destined for export to luxury markets across the globe.
  • The gems and jewelry market is evolving with a focus on sustainability and ethical sourcing, alongside the rise of lab-grown diamonds. Customization and personalization are key drivers of consumer interest, complemented by the growth of online jewelry retail. The luxury jewelry market is expanding, while gold jewelry sees a resurgence. Emerging gems and jewelry trends, analyzed in the latest industry reports, further contribute to the market's growth and development.

Our researchers analyzed the data with 2022 as the base year and the key drivers, trends, and challenges. A holistic analysis of drivers will help companies refine their marketing strategies to gain a competitive advantage.

Key Market Drivers

  • Wedding celebrations play a significant role in driving the demand for jewelry, which is primarily seen as an occasional product. The market is further fueled by the growing expenditure on bridal collections. India stands out as a major market for wedding jewelry, with increasing budgets allocated to wedding functions.
  • Moreover, the expanding middle-class population and rising disposable income contribute to the growth of the market as individuals save more for their own weddings and those of their family members. This increased savings translate into higher spending power on wedding functions and related products, including bridal jewelry. Hence, such factors are driving gems and jewelry market growth during the forecast period.

Significant Market Trends

  • The introduction of AR in the market is the primary trend driving market growth. Augmented reality is driving demand in the global market, particularly in the online segment. To enable customers to try on jewelry virtually before purchasing, e-commerce players are developing platforms based on augmented reality technology. Customers can use the camera on their device to see how different products look on them and choose the perfect match.
  • Riddles Jewelry, a US-based player, has already launched an application for Android and iOS platforms to provide this feature. The introduction of such features will not only support informed decision-making by customers but also drive gems and jewelry market growth during the forecast period.

Major Market Challenges

  • The global market is facing a major challenge with the decline in demand for gold jewelry as an investment option. Gold jewelry has traditionally been popular not only for personal adornment but also as a favoured investment choice, particularly in countries like India. Its high resale value and significance in gifting during weddings have contributed to its appeal. However, the market has witnessed a shift towards alternative investment options and intricate fashion jewelry in recent years, resulting in a decreased demand for gold jewelry. To address this, the Indian government introduced gold bonds as a measure to reduce reliance on gold as an investment avenue.
  • This decline in demand for gold jewelry poses a significant challenge to the overall growth of the global market, given that it is the largest segment. Companies operating in the online jewelry retailing sector have been particularly affected by this trend, impacting their revenue. Weak consumer demand and the upward trend in gold prices are expected to further impact gems and jewelry market growth during the forecast period.

Who are the Major Gems and Jewelry Market Players?

Companies are implementing various strategies, such as strategic alliances, partnerships, mergers and acquisitions, geographical expansion, and product/service launches, to enhance their presence in the market. One of the major companies in the market include:

Kalyanje Wellers.- The company offers gems and jewelry such as gemstone jewelry. The company designs manufactures, and sells various gold, studded, and other jewelry products

The gems and jewelry market forecasting report also includes detailed analyses of the competitive landscape of the market and information about 15 market companies, including:

  • Aurum designer jewellers
  • CHANEL Ltd.
  • Chow Tai Fook Jewellery Group Ltd.
  • Compagnie Financiere Richemont SA
  • Emperor Watch and Jewelry Ltd
  • Graff Diamonds Ltd.
  • Hstern Jewellery Ltd.
  • Kalyan Jewellers India Ltd.
  • Kering SA
  • LVMH Moet Hennessy Louis Vuitton SE
  • Malabar Gold and Diamonds
  • Pandora AS
  • PC Jeweller Ltd.
  • Rajesh Exports Ltd.
  • Riddles Group Inc.
  • Signet Jewelers Ltd.
  • Stuller Inc.
  • Swarovski AG
  • Tata Sons Pvt. Ltd.
  • The Swatch Group Ltd.

Qualitative and quantitative analysis of companies has been conducted to help clients understand the wider business environment as well as the strengths and weaknesses of key market players. Data is qualitatively analyzed to categorize companies as pure play, category-focused, industry-focused, and diversified. Furthermore, it is also quantitatively analyzed to categorize companies as dominant, leading, strong, tentative, and weak.

What are the Latest Market Developments and News?

  • In December 2024, Tiffany & Co. launched a new high-end jewelry collection featuring ethically sourced gemstones, aiming to cater to the growing demand for sustainable luxury items. The collection includes diamonds and colored stones, with a focus on transparency and traceability throughout the supply chain.

  • In November 2024, De Beers introduced a new line of lab-grown diamonds, offering consumers an eco-friendly alternative to mined diamonds. The diamonds are produced using innovative technology and are designed to appeal to environmentally conscious buyers in the global jewelry market.

  • In October 2024, Pandora unveiled an expansion of its gemstone jewelry collection, incorporating rare and exotic stones like sapphires and emeralds. The collection is designed to attract consumers seeking premium and unique pieces, aligning with the increasing trend of personalized and bespoke jewelry.

  • In September 2024, Cartier launched a new range of luxury watches and jewelry that features colored gemstones and diamonds, blending classic designs with modern trends. The launch targets affluent customers who are seeking high-quality, statement pieces for special occasions.

Will Consumer Demand Drive Market Growth?

  • In the dynamic world of fashion, the market stands as a beacon of sophistication and elegance. From classic single-stone stud earrings to ornate pendants, it caters to diverse tastes and occasions. With a focus on luxury goods, the industry bridges different cultures through exquisite ornaments and traditional gift exchange practices. Consumer preferences, especially among the middle-class group, drive demand, emphasizing the importance of authenticity and purity. Ethical practices are increasingly prioritized in sourcing and production, reflecting the values of both designers and consumers. Leveraging online retail platforms, the market expands its reach to export destinations, shaping the global landscape of precious metals and luxury gems.
  • Moreover, the market epitomizes the ever-evolving landscape of luxury and style, influenced by prevailing fashion trends and driven by the middle-class group of consumers seeking both elegance and affordability. With a rich history, the industry encompasses both the gold and diamond sectors, offering a diverse array of luxury metals and gems including white gold and rose gold. Catering to modern lifestyles, especially among working women embracing a Western lifestyle, branded jewelers leverage computer-aided design (CAD) and rapid prototyping (RP) for innovative designs, while e-commerce platforms provide convenient access. Both offline retail stores and online retail stores play pivotal roles in this vibrant Gem and Jewellery Industry, supported by initiatives like the Gold Monetization Scheme and Special Economic Zones (SEZs).
  • In addition, the market encompasses various sectors, including gold and diamond jewelry, each contributing to the rich tapestry of luxury adornments. Within the market, the real jewelry segment thrives, offering an array of exquisite pieces ranging from bracelets to chains & pendants crafted with meticulous attention to detail. Innovations like 3D printing have revolutionized manufacturing processes, allowing for intricate designs and customization. Additionally, the gem and jewelry industry benefits from infrastructure such as common facility centers (CFCs), facilitating production and fostering collaboration. Together, these elements shape a dynamic market catering to diverse consumer preferences and demands.

Market Scope

Report Coverage

Details

Base year

2023

Historic period

2018 - 2022

Forecast period

2024-2028

Growth momentum & CAGR

Accelerate at a CAGR of 8.62%

Market growth 2024-2028

USD 172.6 billion

Market structure

Fragmented

YoY growth 2023-2024(%)

6.23

Regional analysis

APAC, North America, Europe, Middle East and Africa, and South America

Performing market contribution

APAC at 61%

Key countries

China, US, India, Canada, and UK

Competitive landscape

Leading Companies, Market Positioning of Companies, Competitive Strategies, and Industry Risks

Key companies profiled

Aurum designer jewellers, Chanel Ltd., Chow Tai Fook Jewellery Group Limited, Compagnie Financiere Richemont SA, Emperor Watch and Jewelry Ltd, Graff Diamonds Ltd., Hstern Jewellery Ltd., Kalyan Jewellers India Ltd., Kering SA, LVMH Group., Malabar Gold and Diamonds, Pandora AS, PC Jeweller Ltd., Rajesh Exports Ltd., Riddles Group Inc., Signet Jewelers Ltd., Stuller Inc., Swarovski AG, Tata Sons Pvt. Ltd., and The Swatch Group Ltd.

Market dynamics

Parent market analysis, Market forecasting , market report , Market growth inducers and obstacles, Fast-growing and slow-growing segment analysis, Market growth and Forecasting, COVID 19 impact and recovery analysis and future consumer dynamics, Market condition analysis for forecast period

Customization purview

If our report has not included the data that you are looking for, you can reach out to our analysts and get segments customized.

View Sample PDF

What are the Key Data Covered in this Gems and Jewelry Market Forecast Report?

  • CAGR of the market during the forecast period
  • Detailed information on factors that will drive the market growth and forecasting of the market between 2023 and 2028.
  • Precise estimation of the market size and its contribution to the parent market
  • Accurate predictions about upcoming market trends and analysis and changes in consumer behavior
  • Growth of the market across Europe, North America, APAC, South America, and Middle East and Africa
  • Thorough market growth analysis of the market's competitive landscape and detailed information about companies
  • Comprehensive market analysis and report on the factors that will challenge the market research and growth of market companies

We can help! Our analysts can customize this gems and jewelry market research report to meet your requirements. Get in touch

1 Executive Summary

  • 1.1 Market overview
    • Executive Summary - Chart on Market Overview
    • Executive Summary - Data Table on Market Overview
    • Executive Summary - Chart on Global Market Characteristics
    • Executive Summary - Chart on Market by Geography
    • Executive Summary - Chart on Market Segmentation by Distribution Channel
    • Executive Summary - Chart on Market Segmentation by Type
    • Executive Summary - Chart on Incremental Growth
    • Executive Summary - Data Table on Incremental Growth
    • Executive Summary - Chart on Company Market Positioning

2 Market Landscape

  • 2.1 Market ecosystem
    • Parent Market
    • Data Table on - Parent Market
  • 2.2 Market characteristics
    • Market characteristics analysis
  • 2.3 Value chain analysis
    • Value Chain Analysis

3 Market Sizing

  • 3.1 Market definition
    • Offerings of companies included in the market definition
  • 3.2 Market segment analysis
    • Market segments
  • 3.3 Market size 2023
    • 3.4 Market outlook: Forecast for 2023-2028
      • Chart on Global - Market size and forecast 2023-2028 ($ billion)
      • Data Table on Global - Market size and forecast 2023-2028 ($ billion)
      • Chart on Global Market: Year-over-year growth 2023-2028 (%)
      • Data Table on Global Market: Year-over-year growth 2023-2028 (%)

    4 Historic Market Size

    • 4.1 Global Gems And Jewelry Market 2018 - 2022
      • Historic Market Size - Data Table on Global Gems And Jewelry Market 2018 - 2022 ($ billion)
    • 4.2 Distribution Channel segment analysis 2018 - 2022
      • Historic Market Size - Distribution Channel Segment 2018 - 2022 ($ billion)
    • 4.3 Type segment analysis 2018 - 2022
      • Historic Market Size - Type Segment 2018 - 2022 ($ billion)
    • 4.4 Geography segment analysis 2018 - 2022
      • Historic Market Size - Geography Segment 2018 - 2022 ($ billion)
    • 4.5 Country segment analysis 2018 - 2022
      • Historic Market Size - Country Segment 2018 - 2022 ($ billion)

    5 Five Forces Analysis

    • 5.1 Five forces summary
      • Five forces analysis - Comparison between 2023 and 2028
    • 5.2 Bargaining power of buyers
      • Bargaining power of buyers - Impact of key factors 2023 and 2028
    • 5.3 Bargaining power of suppliers
      • Bargaining power of suppliers - Impact of key factors in 2023 and 2028
    • 5.4 Threat of new entrants
      • Threat of new entrants - Impact of key factors in 2023 and 2028
    • 5.5 Threat of substitutes
      • Threat of substitutes - Impact of key factors in 2023 and 2028
    • 5.6 Threat of rivalry
      • Threat of rivalry - Impact of key factors in 2023 and 2028
    • 5.7 Market condition
      • Chart on Market condition - Five forces 2023 and 2028

    6 Market Segmentation by Distribution Channel

    • 6.1 Market segments
      • Chart on Distribution Channel - Market share 2023-2028 (%)
      • Data Table on Distribution Channel - Market share 2023-2028 (%)
    • 6.2 Comparison by Distribution Channel
      • Chart on Comparison by Distribution Channel
      • Data Table on Comparison by Distribution Channel
    • 6.3 Offline - Market size and forecast 2023-2028
      • Chart on Offline - Market size and forecast 2023-2028 ($ billion)
      • Data Table on Offline - Market size and forecast 2023-2028 ($ billion)
      • Chart on Offline - Year-over-year growth 2023-2028 (%)
      • Data Table on Offline - Year-over-year growth 2023-2028 (%)
    • 6.4 Online - Market size and forecast 2023-2028
      • Chart on Online - Market size and forecast 2023-2028 ($ billion)
      • Data Table on Online - Market size and forecast 2023-2028 ($ billion)
      • Chart on Online - Year-over-year growth 2023-2028 (%)
      • Data Table on Online - Year-over-year growth 2023-2028 (%)
    • 6.5 Market opportunity by Distribution Channel
      • Market opportunity by Distribution Channel ($ billion)
      • Data Table on Market opportunity by Distribution Channel ($ billion)

    7 Market Segmentation by Type

    • 7.1 Market segments
      • Chart on Type - Market share 2023-2028 (%)
      • Data Table on Type - Market share 2023-2028 (%)
    • 7.2 Comparison by Type
      • Chart on Comparison by Type
      • Data Table on Comparison by Type
    • 7.3 Gold - Market size and forecast 2023-2028
      • Chart on Gold - Market size and forecast 2023-2028 ($ billion)
      • Data Table on Gold - Market size and forecast 2023-2028 ($ billion)
      • Chart on Gold - Year-over-year growth 2023-2028 (%)
      • Data Table on Gold - Year-over-year growth 2023-2028 (%)
    • 7.4 Platinum - Market size and forecast 2023-2028
      • Chart on Platinum - Market size and forecast 2023-2028 ($ billion)
      • Data Table on Platinum - Market size and forecast 2023-2028 ($ billion)
      • Chart on Platinum - Year-over-year growth 2023-2028 (%)
      • Data Table on Platinum - Year-over-year growth 2023-2028 (%)
    • 7.5 Silver - Market size and forecast 2023-2028
      • Chart on Silver - Market size and forecast 2023-2028 ($ billion)
      • Data Table on Silver - Market size and forecast 2023-2028 ($ billion)
      • Chart on Silver - Year-over-year growth 2023-2028 (%)
      • Data Table on Silver - Year-over-year growth 2023-2028 (%)
    • 7.6 Diamond - Market size and forecast 2023-2028
      • Chart on Diamond - Market size and forecast 2023-2028 ($ billion)
      • Data Table on Diamond - Market size and forecast 2023-2028 ($ billion)
      • Chart on Diamond - Year-over-year growth 2023-2028 (%)
      • Data Table on Diamond - Year-over-year growth 2023-2028 (%)
    • 7.7 Gemstones - Market size and forecast 2023-2028
      • Chart on Gemstones - Market size and forecast 2023-2028 ($ billion)
      • Data Table on Gemstones - Market size and forecast 2023-2028 ($ billion)
      • Chart on Gemstones - Year-over-year growth 2023-2028 (%)
      • Data Table on Gemstones - Year-over-year growth 2023-2028 (%)
    • 7.8 Market opportunity by Type
      • Market opportunity by Type ($ billion)
      • Data Table on Market opportunity by Type ($ billion)

    8 Customer Landscape

    • 8.1 Customer landscape overview
      • Analysis of price sensitivity, lifecycle, customer purchase basket, adoption rates, and purchase criteria

    9 Geographic Landscape

    • 9.1 Geographic segmentation
      • Chart on Market share by geography 2023-2028 (%)
      • Data Table on Market share by geography 2023-2028 (%)
    • 9.2 Geographic comparison
      • Chart on Geographic comparison
      • Data Table on Geographic comparison
    • 9.3 APAC - Market size and forecast 2023-2028
      • Chart on APAC - Market size and forecast 2023-2028 ($ billion)
      • Data Table on APAC - Market size and forecast 2023-2028 ($ billion)
      • Chart on APAC - Year-over-year growth 2023-2028 (%)
      • Data Table on APAC - Year-over-year growth 2023-2028 (%)
    • 9.4 North America - Market size and forecast 2023-2028
      • Chart on North America - Market size and forecast 2023-2028 ($ billion)
      • Data Table on North America - Market size and forecast 2023-2028 ($ billion)
      • Chart on North America - Year-over-year growth 2023-2028 (%)
      • Data Table on North America - Year-over-year growth 2023-2028 (%)
    • 9.5 Europe - Market size and forecast 2023-2028
      • Chart on Europe - Market size and forecast 2023-2028 ($ billion)
      • Data Table on Europe - Market size and forecast 2023-2028 ($ billion)
      • Chart on Europe - Year-over-year growth 2023-2028 (%)
      • Data Table on Europe - Year-over-year growth 2023-2028 (%)
    • 9.6 Middle East and Africa - Market size and forecast 2023-2028
      • Chart on Middle East and Africa - Market size and forecast 2023-2028 ($ billion)
      • Data Table on Middle East and Africa - Market size and forecast 2023-2028 ($ billion)
      • Chart on Middle East and Africa - Year-over-year growth 2023-2028 (%)
      • Data Table on Middle East and Africa - Year-over-year growth 2023-2028 (%)
    • 9.7 South America - Market size and forecast 2023-2028
      • Chart on South America - Market size and forecast 2023-2028 ($ billion)
      • Data Table on South America - Market size and forecast 2023-2028 ($ billion)
      • Chart on South America - Year-over-year growth 2023-2028 (%)
      • Data Table on South America - Year-over-year growth 2023-2028 (%)
    • 9.8 China - Market size and forecast 2023-2028
      • Chart on China - Market size and forecast 2023-2028 ($ billion)
      • Data Table on China - Market size and forecast 2023-2028 ($ billion)
      • Chart on China - Year-over-year growth 2023-2028 (%)
      • Data Table on China - Year-over-year growth 2023-2028 (%)
    • 9.9 US - Market size and forecast 2023-2028
      • Chart on US - Market size and forecast 2023-2028 ($ billion)
      • Data Table on US - Market size and forecast 2023-2028 ($ billion)
      • Chart on US - Year-over-year growth 2023-2028 (%)
      • Data Table on US - Year-over-year growth 2023-2028 (%)
    • 9.10 India - Market size and forecast 2023-2028
      • Chart on India - Market size and forecast 2023-2028 ($ billion)
      • Data Table on India - Market size and forecast 2023-2028 ($ billion)
      • Chart on India - Year-over-year growth 2023-2028 (%)
      • Data Table on India - Year-over-year growth 2023-2028 (%)
    • 9.11 Canada - Market size and forecast 2023-2028
      • Chart on Canada - Market size and forecast 2023-2028 ($ billion)
      • Data Table on Canada - Market size and forecast 2023-2028 ($ billion)
      • Chart on Canada - Year-over-year growth 2023-2028 (%)
      • Data Table on Canada - Year-over-year growth 2023-2028 (%)
    • 9.12 UK - Market size and forecast 2023-2028
      • Chart on UK - Market size and forecast 2023-2028 ($ billion)
      • Data Table on UK - Market size and forecast 2023-2028 ($ billion)
      • Chart on UK - Year-over-year growth 2023-2028 (%)
      • Data Table on UK - Year-over-year growth 2023-2028 (%)
    • 9.13 Market opportunity by geography
      • Market opportunity by geography ($ billion)
      • Data Tables on Market opportunity by geography ($ billion)
    • 9.14 China - Market size and forecast (2023-2028)
      • Chart on China - Market size and forecast (2023-2028) ($ million)
      • Data Table on China - Market size and forecast (2023-2028) ($ million)
      • Chart on China - Year-over-year growth (2023-2028) (%)
      • Data Table on China - Year-over-year growth (2023-2028) (%)
    • 9.15 US - Market size and forecast (2023-2028)
      • Chart on US - Market size and forecast (2023-2028) ($ million)
      • Data Table on US - Market size and forecast (2023-2028) ($ million)
      • Chart on US - Year-over-year growth (2023-2028) (%)
      • Data Table on US - Year-over-year growth (2023-2028) (%)
    • 9.16 India - Market size and forecast (2023-2028)
      • Chart on India - Market size and forecast (2023-2028) ($ million)
      • Data Table on India - Market size and forecast (2023-2028) ($ million)
      • Chart on India - Year-over-year growth (2023-2028) (%)
      • Data Table on India - Year-over-year growth (2023-2028) (%)
    • 9.17 Canada - Market size and forecast (2023-2028)
      • Chart on Canada - Market size and forecast (2023-2028) ($ million)
      • Data Table on Canada - Market size and forecast (2023-2028) ($ million)
      • Chart on Canada - Year-over-year growth (2023-2028) (%)
      • Data Table on Canada - Year-over-year growth (2023-2028) (%)
    • 9.18 UK - Market size and forecast (2023-2028)
      • Chart on UK - Market size and forecast (2023-2028) ($ million)
      • Data Table on UK - Market size and forecast (2023-2028) ($ million)
      • Chart on UK - Year-over-year growth (2023-2028) (%)
      • Data Table on UK - Year-over-year growth (2023-2028) (%)

    10 Drivers, Challenges, and Opportunity/Restraints

    • 10.1 Market drivers
      • 10.2 Market challenges
        • 10.3 Impact of drivers and challenges
          • Impact of drivers and challenges in 2023 and 2028
        • 10.4 Market opportunities/restraints

          11 Competitive Landscape

          • 11.1 Overview
            • 11.2 Competitive Landscape
              • Overview on criticality of inputs and factors of differentiation
            • 11.3 Landscape disruption
              • Overview on factors of disruption
            • 11.4 Industry risks
              • Impact of key risks on business

            12 Competitive Analysis

            • 12.1 Companies profiled
              • Companies covered
            • 12.2 Market positioning of companies
              • Matrix on companies position and classification
            • 12.3 Chanel Ltd.
              • Chanel Ltd. - Overview
              • Chanel Ltd. - Product / Service
              • Chanel Ltd. - Key offerings
            • 12.4 Chow Tai Fook Jewellery Group Limited
              • Chow Tai Fook Jewellery Group Limited - Overview
              • Chow Tai Fook Jewellery Group Limited - Business segments
              • Chow Tai Fook Jewellery Group Limited - Key offerings
              • Chow Tai Fook Jewellery Group Limited - Segment focus
            • 12.5 Compagnie Financiere Richemont SA
              • Compagnie Financiere Richemont SA - Overview
              • Compagnie Financiere Richemont SA - Business segments
              • Compagnie Financiere Richemont SA - Key news
              • Compagnie Financiere Richemont SA - Key offerings
              • Compagnie Financiere Richemont SA - Segment focus
            • 12.6 Emperor Watch and Jewelry Ltd
              • Emperor Watch and Jewelry Ltd - Overview
              • Emperor Watch and Jewelry Ltd - Product / Service
              • Emperor Watch and Jewelry Ltd - Key offerings
            • 12.7 Kalyan Jewellers India Ltd.
              • Kalyan Jewellers India Ltd. - Overview
              • Kalyan Jewellers India Ltd. - Product / Service
              • Kalyan Jewellers India Ltd. - Key offerings
            • 12.8 Kering SA
              • Kering SA - Overview
              • Kering SA - Business segments
              • Kering SA - Key news
              • Kering SA - Key offerings
              • Kering SA - Segment focus
            • 12.9 LVMH Group.
              • LVMH Group. - Overview
              • LVMH Group. - Business segments
              • LVMH Group. - Key news
              • LVMH Group. - Key offerings
              • LVMH Group. - Segment focus
            • 12.10 Malabar Gold and Diamonds
              • Malabar Gold and Diamonds - Overview
              • Malabar Gold and Diamonds - Product / Service
              • Malabar Gold and Diamonds - Key offerings
            • 12.11 Pandora AS
              • Pandora AS - Overview
              • Pandora AS - Business segments
              • Pandora AS - Key offerings
              • Pandora AS - Segment focus
            • 12.12 PC Jeweller Ltd.
              • PC Jeweller Ltd. - Overview
              • PC Jeweller Ltd. - Business segments
              • PC Jeweller Ltd. - Key offerings
              • PC Jeweller Ltd. - Segment focus
            • 12.13 Rajesh Exports Ltd.
              • Rajesh Exports Ltd. - Overview
              • Rajesh Exports Ltd. - Product / Service
              • Rajesh Exports Ltd. - Key offerings
            • 12.14 Signet Jewelers Ltd.
              • Signet Jewelers Ltd. - Overview
              • Signet Jewelers Ltd. - Business segments
              • Signet Jewelers Ltd. - Key offerings
              • Signet Jewelers Ltd. - Segment focus
            • 12.15 Swarovski AG
              • Swarovski AG - Overview
              • Swarovski AG - Product / Service
              • Swarovski AG - Key offerings
            • 12.16 Tata Sons Pvt. Ltd.
              • Tata Sons Pvt. Ltd. - Overview
              • Tata Sons Pvt. Ltd. - Product / Service
              • Tata Sons Pvt. Ltd. - Key news
              • Tata Sons Pvt. Ltd. - Key offerings
            • 12.17 The Swatch Group Ltd.
              • The Swatch Group Ltd. - Overview
              • The Swatch Group Ltd. - Business segments
              • The Swatch Group Ltd. - Key offerings
              • The Swatch Group Ltd. - Segment focus

            13 Appendix

            • 13.1 Scope of the report
              • 13.2 Inclusions and exclusions checklist
                • Inclusions checklist
                • Exclusions checklist
              • 13.3 Currency conversion rates for US$
                • Currency conversion rates for US$
              • 13.4 Research methodology
                • Research methodology
              • 13.5 Data procurement
                • Information sources
              • 13.6 Data validation
                • Data validation
              • 13.7 Validation techniques employed for market sizing
                • Validation techniques employed for market sizing
              • 13.8 Data synthesis
                • Data synthesis
              • 13.9 360 degree market analysis
                • 360 degree market analysis
              • 13.10 List of abbreviations
                • List of abbreviations

              Research Methodology

              Technavio presents a detailed picture of the market by way of study, synthesis, and summation of data from multiple sources. The analysts have presented the various facets of the market with a particular focus on identifying the key industry influencers. The data thus presented is comprehensive, reliable, and the result of extensive research, both primary and secondary.

              INFORMATION SOURCES

              Primary sources

              • Manufacturers and suppliers
              • Channel partners
              • Industry experts
              • Strategic decision makers

              Secondary sources

              • Industry journals and periodicals
              • Government data
              • Financial reports of key industry players
              • Historical data
              • Press releases

              DATA ANALYSIS

              Data Synthesis

              • Collation of data
              • Estimation of key figures
              • Analysis of derived insights

              Data Validation

              • Triangulation with data models
              • Reference against proprietary databases
              • Corroboration with industry experts

              REPORT WRITING

              Qualitative

              • Market drivers
              • Market challenges
              • Market trends
              • Five forces analysis

              Quantitative

              • Market size and forecast
              • Market segmentation
              • Geographical insights
              • Competitive landscape

              Interested in this report?

              Get your sample now to see our research methodology and insights!

              Download Now

              Frequently Asked Questions

              Gems And Jewelry market growth will increase by $ 172.6 bn during 2024-2028.

              The Gems And Jewelry market is expected to grow at a CAGR of 8.62% during 2024-2028.

              Gems And Jewelry market is segmented by Distribution Channel( Offline, Online) Type( Gold, ?Platinum, Silver, Diamond, Gemstones)

              Aurum designer jewellers, Chanel Ltd., Chow Tai Fook Jewellery Group Limited, Compagnie Financiere Richemont SA, Emperor Watch and Jewelry Ltd, Graff Diamonds Ltd., Hstern Jewellery Ltd., Kalyan Jewellers India Ltd., Kering SA, LVMH Group., Malabar Gold and Diamonds, Pandora AS, PC Jeweller Ltd., Rajesh Exports Ltd., Riddles Group Inc., Signet Jewelers Ltd., Stuller Inc., Swarovski AG, Tata Sons Pvt. Ltd., The Swatch Group Ltd. are a few of the key vendors in the Gems And Jewelry market.

              APAC will register the highest growth rate of 61% among the other regions. Therefore, the Gems And Jewelry market in APAC is expected to garner significant business opportunities for the vendors during the forecast period.

              China, US, India, Canada, The U.K., Germany, France, , Rest of Europe, Japan, South Korea, Chile, Argentina, Brazil

              • Innovation in jewelry designFactors such as the changing tastes and preferences of customers and increasing awareness of different trending styles and designs have encouraged people to try out new designs. Also is the driving factor this market.
              • changing the tastes and preferences of customers has encouraged manufacturers to focus on offering a wide variety of designs in their jewelry collections. Unique jewelry designs is the driving factor this market.
              • along with the purity of precious metals and authenticity of valuable gemstones is the driving factor this market.
              • are significant factors that enable a company to differentiate itself from competing brands. The demand for innovative jewelry designs is high among consumers who are willing to pay a premium price for such jewelry is the driving factor this market.
              • which is also attributable to increasing fashion consciousness among consumers. Also is the driving factor this market.
              • the constant demand for new designs makes the jewelry market highly competitive. Vendors that offer exquisitely unique creations drive the demand for new designs. For instance is the driving factor this market.
              • Chow Tai Fook Jewellery Co. Ltd. offers the Disney Classics Collection is the driving factor this market.
              • which is a curated selection of Mickey Mouse and Minnie Mouse jewelry pieces.Computer-aided design (CAD) is one of the major technologies used in jewelry designing is the driving factor this market.
              • which enables 3D printing on jewelry. Thus is the driving factor this market.
              • the use of advanced technologies has accelerated sales in the jewelry market is the driving factor this market.
              • especially in the personalized jewelry segment.The demand for personalized jewelry is growing among consumers. The process of personalization allows consumers to select their desired designs and further customize their jewelry by adding gemstones and other precious stones. These requirements are fulfilled by using advanced technology such as laser technology and induction technology. For instance is the driving factor this market.
              • LaserStar Technologies is the driving factor this market.
              • a US-based company is the driving factor this market.
              • provides laser technology solutions for welding and cutting precious metals for jewelry manufacturers. Various designers also use innovative 3D printers that use Rapid Prototyping (RP) technology. The designers operating in the market also use 3D printers to review the design concepts is the driving factor this market.
              • which helps them understand the requirements and complexity in the manufacturing of any jewelry design. Thus is the driving factor this market.
              • the adoption of advanced technologies is likely to drive the growth of the global gems and jewelry market during the forecast period. is the driving factor this market.

              The Gems And Jewelry market vendors should focus on grabbing business opportunities from the Offline segment as it accounted for the largest market share in the base year.