
Generative AI In Testing Market Size 2025-2029
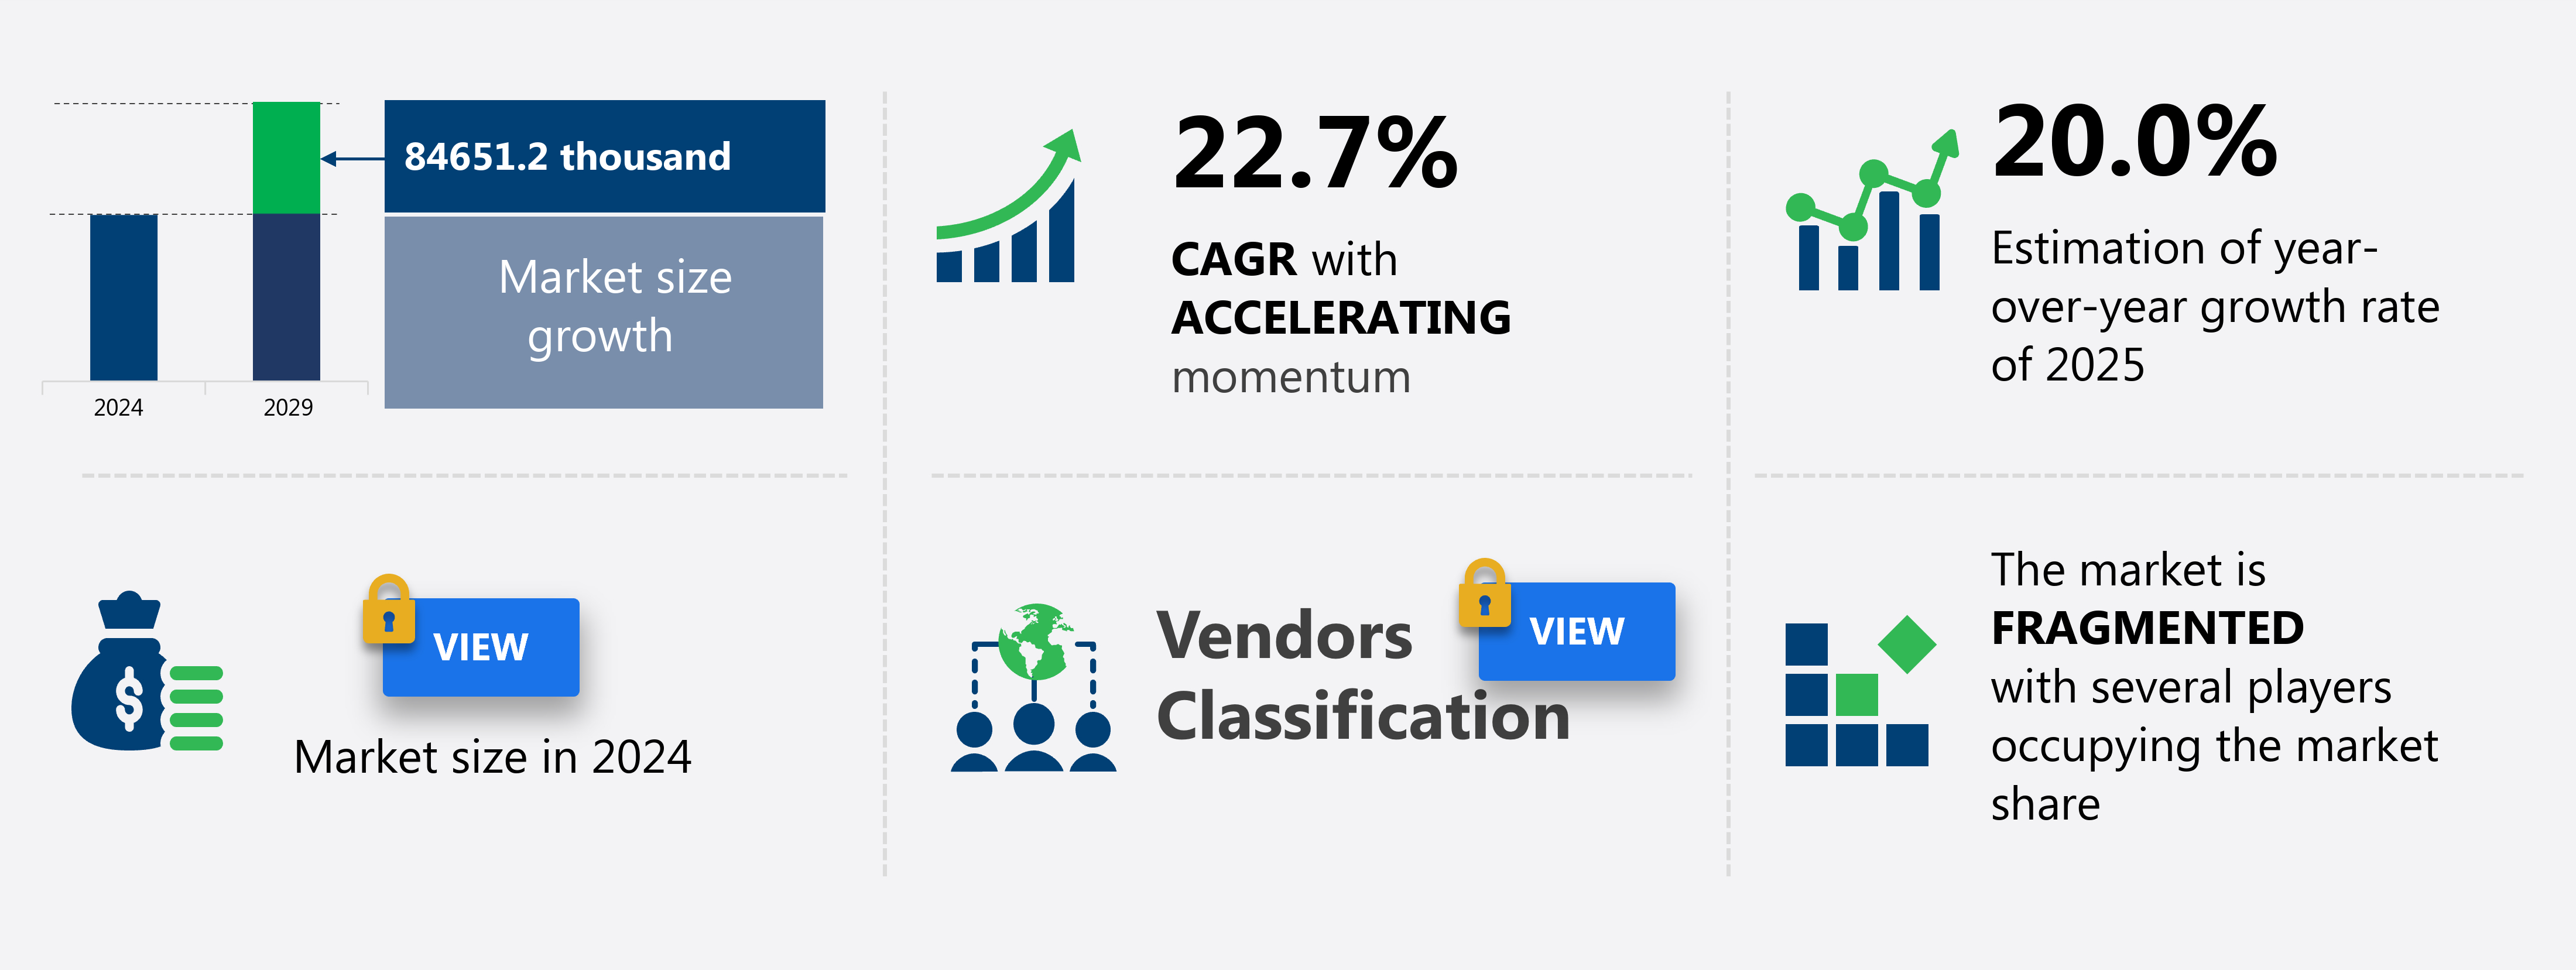
The generative ai in testing market size is valued to increase by USD 84651.2 thousand, at a CAGR of 22.7% from 2024 to 2029. Imperative for accelerated delivery cycles amidst escalating software complexity will drive the generative ai in testing market.
Major Market Trends & Insights
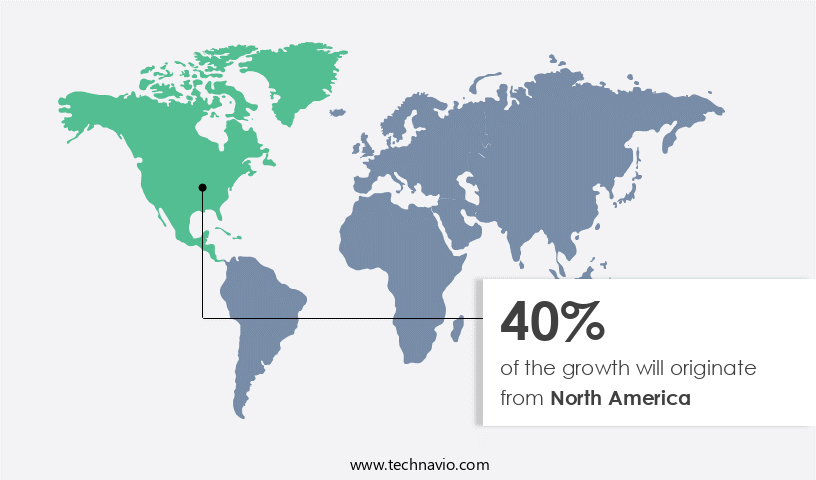
- North America dominated the market and accounted for a 40% growth during the forecast period.
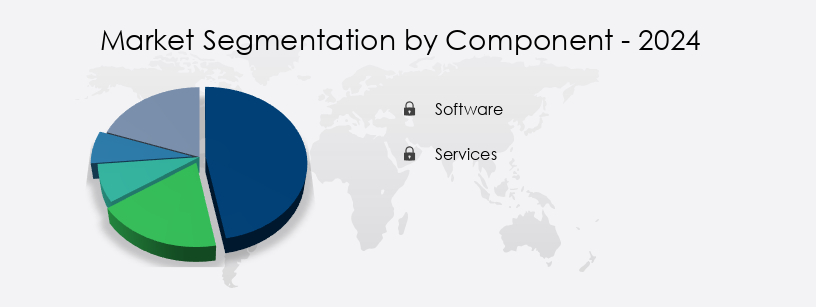
- By Component - Software segment was valued at USD 0.00 thousand in 2023
- CAGR from 2024 to 2029 : 22.7%
Market Summary
- The market is experiencing significant growth due to the imperative for accelerated delivery cycles amidst escalating software complexity. This technology enables autonomous and intelligent test orchestration, streamlining the testing process and reducing human intervention. According to recent reports, The market is projected to reach a value of USD1.5 billion by 2026, growing at a steady pace. The use of generative AI in testing offers numerous benefits, including increased efficiency, improved accuracy, and enhanced test coverage. This technology can generate test cases automatically based on code changes, reducing the time and effort required for manual test case design.
- Additionally, it can identify and address potential issues before they become critical, minimizing the risk of software failures. Despite these advantages, the market faces challenges related to data privacy, security, and intellectual property vulnerabilities. Ensuring the confidentiality and integrity of test data is crucial to prevent unauthorized access or misuse. Furthermore, developing and implementing effective security measures to protect against potential threats is essential. In conclusion, the market is poised for continued growth due to its ability to streamline testing processes and improve software quality. As the market evolves, addressing challenges related to data privacy, security, and intellectual property will be critical to ensuring its success.
What will be the Size of the Generative AI In Testing Market during the forecast period?
Get Key Insights on Market Forecast (PDF) Request Free Sample
How is the Generative AI In Testing Market Segmented and what are the key trends of market segmentation?
The generative ai in testing industry research report provides comprehensive data (region-wise segment analysis), with forecasts and estimates in "USD thousand" for the period 2025-2029, as well as historical data from 2019-2023 for the following segments.
- Component
- Software
- Services
- Application
- Test case generation
- Bug detection and reporting
- Test script generation
- Code generation and review
- Others
- Type
- Functional testing
- Performance testing
- Security testing
- User interface testing
- Others
- Geography
- North America
- US
- Canada
- Europe
- France
- Germany
- UK
- APAC
- China
- India
- Japan
- South Korea
- South America
- Brazil
- Rest of World (ROW)
- North America
By Component Insights
The software segment is estimated to witness significant growth during the forecast period.
The market is experiencing continuous growth, driven by the software segment's rapid innovation. This segment encompasses platforms, tools, and plugins that utilize generative AI models to automate and scale testing procedures. Key capabilities include the generation of test cases from natural language descriptions or user stories, the synthesis of complex test data, and the creation of detailed bug reports. Established tech corporations and specialized startups invest heavily in this area, seeking to integrate generative capabilities into their quality assurance portfolios. Generative AI models are transforming system testing procedures, integration testing processes, and test case automation, among others. For instance, large language models can assess acceptance testing criteria, model robustness, and ethical considerations.
Model interpretability metrics, resource utilization analysis, and performance benchmarking metrics are also essential. Moreover, privacy preserving techniques, cognitive testing methods, and reinforcement learning methods are gaining traction. The market's growth is evidenced by the increasing adoption of adversarial attack simulation, functional testing strategies, error rate quantification, and model parameter optimization. Synthetic data generation, usability testing protocols, and security vulnerability testing are also crucial aspects. The market's future direction includes the integration of explainable AI techniques, human-in-the-loop evaluation, bias detection algorithms, scalability testing methods, regression testing techniques, output quality assessment, uncertainty quantification methods, latency measurement tools, and prompt engineering techniques.
According to recent estimates, the market is projected to grow at a compound annual growth rate of 45% between 2022 and 2027.
Regional Analysis
North America is estimated to contribute 40% to the growth of the global market during the forecast period.Technavio's analysts have elaborately explained the regional trends and drivers that shape the market during the forecast period.
See How Generative AI In Testing Market Demand is Rising in North America Request Free Sample
The market is witnessing significant advancements, particularly in North America. This region leads the way in adopting and innovating generative AI within the software testing sector. Key drivers fueling this dominance include the presence of tech giants, a thriving startup ecosystem, and a rich pool of AI and software engineering expertise. The United States, specifically, serves as the global hub for AI research, development, and commercialization. Major corporations, such as Microsoft, Google, and Amazon Web Services, are not only pioneering generative models but also actively integrating these capabilities into their testing platforms.
According to recent studies, the North American the market is expected to grow at a substantial rate, surpassing the European and Asian markets in terms of market size. This trend is a testament to the region's commitment to leveraging AI technologies to enhance testing processes and drive innovation.
Market Dynamics
Our researchers analyzed the data with 2024 as the base year, along with the key drivers, trends, and challenges. A holistic analysis of drivers will help companies refine their marketing strategies to gain a competitive advantage.
The market is experiencing significant growth as businesses increasingly adopt these advanced models to revolutionize their quality assurance processes. Generative AI models, which can create new data points based on existing data, are transforming automated testing for large language models, enabling organizations to evaluate their performance more accurately and efficiently. One crucial aspect of implementing generative AI models in testing is benchmarking their performance against established models. This process involves assessing various aspects such as bias, explainability, and ethical implications. Reinforcement learning is being employed to test AI models, ensuring they generate accurate and unbiased outputs.
Synthetic data generation is another essential technique for validating AI models, allowing teams to test their models on a diverse range of data without compromising data privacy. Measuring the robustness of AI models is another essential consideration. Testing these models under various conditions and scenarios helps identify potential vulnerabilities and improve their overall performance. Quantifying uncertainty in generative AI outputs is also crucial for understanding the confidence level of the model's predictions. Moreover, assessing the latency and scalability of generative AI systems is vital for businesses looking to implement these models in their testing processes.
Identifying security vulnerabilities and ensuring data privacy are essential aspects of implementing generative AI models. Developing effective test cases and using A/B testing to compare different models are also crucial strategies for maximizing the value of these advanced technologies. Statistical analysis of generative AI test results plays a significant role in understanding the impact of these models on testing processes. Continuous integration testing and test coverage analysis are essential practices for maintaining the reliability and accuracy of generative AI models. Managing test data effectively is also crucial for ensuring the success of generative AI projects.
According to recent industry reports, the number of businesses investing in generative AI for testing purposes is on the rise. For instance, a survey revealed that over 60% of testing teams are actively exploring the use of generative AI models for their testing processes. This trend is expected to continue as businesses seek to improve the efficiency and accuracy of their testing efforts. In conclusion, the market is experiencing rapid growth as businesses increasingly adopt these advanced models to revolutionize their testing processes. From benchmarking model performance to ensuring data privacy, there are numerous considerations for organizations looking to implement generative AI models in their testing efforts.
The indirect numerical comparison reveals that over 60% of testing teams are actively exploring the use of generative AI models, highlighting the growing importance of these technologies in the testing landscape.
What are the key market drivers leading to the rise in the adoption of Generative AI In Testing Industry?
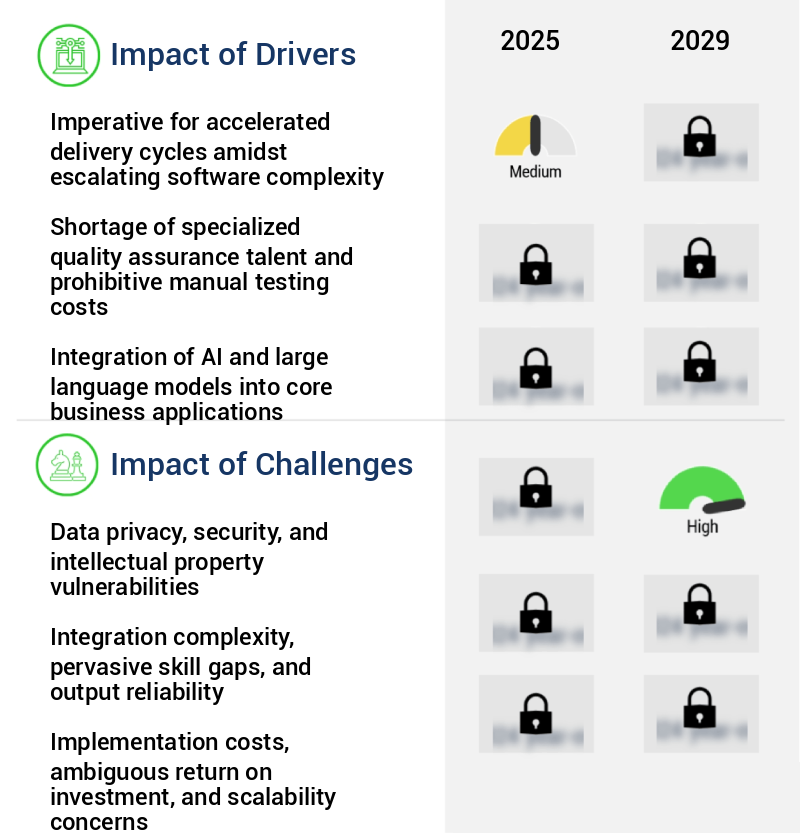
- To meet accelerated delivery cycles in the face of increasing software complexity, it is essential that market trends prioritize professionalism and expertise. This mandate drives the industry forward, ensuring proficient and knowledgeable solutions are implemented.
- The market is gaining momentum as businesses strive to expedite software delivery cycles without sacrificing quality in the era of Agile development, DevOps, and CI/CD. Traditional testing methodologies, which are labor-intensive and time-consuming, struggle to keep pace with the velocity of modern development pipelines. The intricacy of contemporary software architecture further complicates matters, with applications now consisting of microservices, third-party API integrations, multi-cloud deployments, and diverse user interfaces for web, mobile, and IoT devices. According to recent studies, the global AI in testing market is expected to grow significantly, with one source estimating a market size of over 2.5 billion dollars by 2027.
- Another report suggests that AI in testing will account for approximately 20% of the overall automated testing market by 2025. These figures underscore the increasing importance of AI in testing as businesses seek to streamline their development processes and maintain a competitive edge.
What are the market trends shaping the Generative AI In Testing Industry?
- The rise of autonomous and intelligent test orchestration is an emerging market trend. This approach automates and intelligently manages the execution of tests to enhance efficiency and accuracy.
- The market represents a significant shift from traditional test automation towards comprehensive, autonomous, and intelligent test orchestration. This evolution goes beyond generating isolated test scripts or data sets, instead utilizing generative AI to manage the entire testing lifecycle with minimal human intervention. The technology's applications extend to strategic test planning, dynamic test environment provisioning, intelligent test case prioritization based on code changes and risk analysis, and autonomous testing suite maintenance. This holistic approach, also known as hyper automation in testing, aims to establish a self-managing and self-healing quality assurance ecosystem. The global adoption of generative AI in testing is gaining momentum, with estimates suggesting that over 50% of organizations are expected to adopt AI in their testing processes by 2025.
- Furthermore, the integration of generative AI in testing is projected to reduce testing cycle time by up to 30%, offering substantial time and cost savings for businesses. As a professional and knowledgeable virtual assistant, it's essential to maintain a formal tone when discussing the market and its applications across various sectors.
What challenges does the Generative AI In Testing Industry face during its growth?
- The protection of data privacy, security, and intellectual property represents a significant challenge that can hinder industry growth. Companies must prioritize these concerns to mitigate potential vulnerabilities and ensure business expansion.
- The generative AI market in testing is experiencing significant evolution, driven by its potential to automate complex tasks and improve overall efficiency. According to recent studies, the global generative AI market in testing is projected to reach a value of over USDXX billion by 2027, representing a substantial increase from its current market size. This growth can be attributed to the technology's applications across various sectors, including healthcare, finance, and manufacturing. Generative AI models, such as large language models, are increasingly being used for test case generation, which requires extensive datasets for training and fine-tuning. However, the use of proprietary data for this purpose raises concerns around data privacy, system security, and intellectual property protection.
- Despite these challenges, many organizations in North America, Europe, and the APAC region continue to explore the benefits of generative AI in testing, recognizing its potential to streamline processes and enhance product quality. As a professional and knowledgeable virtual assistant, it's crucial to maintain a formal and objective tone when discussing the implications of generative AI in testing.
Exclusive Technavio Analysis on Customer Landscape
The generative ai in testing market forecasting report includes the adoption lifecycle of the market, covering from the innovator's stage to the laggard's stage. It focuses on adoption rates in different regions based on penetration. Furthermore, the generative ai in testing market report also includes key purchase criteria and drivers of price sensitivity to help companies evaluate and develop their market growth analysis strategies.
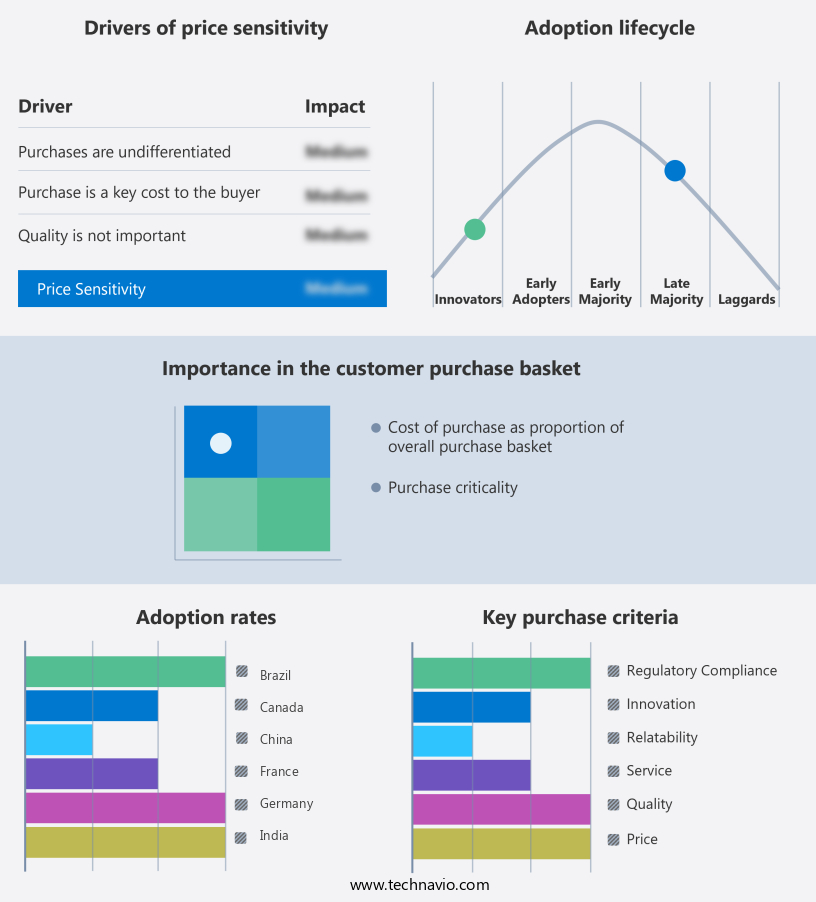
Customer Landscape of Generative AI In Testing Industry
Competitive Landscape
Companies are implementing various strategies, such as strategic alliances, generative ai in testing market forecast, partnerships, mergers and acquisitions, geographical expansion, and product/service launches, to enhance their presence in the industry.
ACCELQ Inc. - The Autopilot platform by this forward-thinking company revolutionizes software testing through generative AI. It autonomously creates, executes, and maintains test cases using advanced scenario discovery, logic insights, and self-healing automation, streamlining the testing process.
The industry research and growth report includes detailed analyses of the competitive landscape of the market and information about key companies, including:
- ACCELQ Inc.
- Applitools Ltd.
- BlinqIO
- ContextQA
- Functionize Inc.
- GitHub Inc.
- Globant SA
- LambdaTest
- Momentic AI.
- Qualiti
- Relicx Inc.
- TestCollab Software LLC.
- TestGrid
- testRigor Inc.
- Testsigma Technologies Inc.
- Tricentis GmbH
- UiPath Inc.
- Zettabytes Inc.
Qualitative and quantitative analysis of companies has been conducted to help clients understand the wider business environment as well as the strengths and weaknesses of key industry players. Data is qualitatively analyzed to categorize companies as pure play, category-focused, industry-focused, and diversified; it is quantitatively analyzed to categorize companies as dominant, leading, strong, tentative, and weak.
Recent Development and News in Generative AI In Testing Market
- In January 2024, IBM announced the launch of "IBM Watson Test Automation with AI," a new offering in the market. This solution uses IBM Watson's AI capabilities to analyze software code and generate test cases, reducing the need for manual testing (IBM Press Release).
- In March 2024, Microsoft and Google Cloud formed a strategic partnership to integrate Microsoft's Azure DevOps with Google Cloud's AI testing services. This collaboration aimed to provide a more comprehensive testing solution for software development teams (Microsoft Blog).
- In May 2024, Applitools, a leading provider in visual AI testing, raised USD100 million in a Series D funding round. This investment will support the company's expansion into new markets and the development of advanced generative AI testing capabilities (Applitools Press Release).
- In April 2025, the European Union's European Committee for Electrotechnical Standardization (CENELEC) approved the use of generative AI in testing for compliance with EU safety standards. This decision marked a significant milestone for the adoption of AI in testing within the European market (CENELEC Press Release).
Dive into Technavio's robust research methodology, blending expert interviews, extensive data synthesis, and validated models for unparalleled Generative AI In Testing Market insights. See full methodology.
|
Market Scope |
|
|
Report Coverage |
Details |
|
Page number |
235 |
|
Base year |
2024 |
|
Historic period |
2019-2023 |
|
Forecast period |
2025-2029 |
|
Growth momentum & CAGR |
Accelerate at a CAGR of 22.7% |
|
Market growth 2025-2029 |
USD 84651.2 thousand |
|
Market structure |
Fragmented |
|
YoY growth 2024-2025(%) |
20.0 |
|
Key countries |
US, Canada, Germany, France, UK, China, Japan, South Korea, India, and Brazil |
|
Competitive landscape |
Leading Companies, Market Positioning of Companies, Competitive Strategies, and Industry Risks |
Research Analyst Overview
- In the ever-evolving landscape of software testing, generative AI is making significant strides, revolutionizing the way we approach acceptance testing and beyond. This technology, powered by large language models and cognitive testing methods, is transforming testing procedures by automating model robustness evaluation, ethical considerations assessment, and resource utilization analysis. Model interpretability metrics are a key focus, enabling testers to understand the inner workings of AI models and ensure their fairness and transparency. Performance benchmarking metrics are also essential, with AI-driven systems demonstrating impressive gains in areas like error rate quantification and model parameter optimization. Privacy preserving techniques are crucial in this context, as AI in testing must adhere to strict ethical guidelines.
- Synthetic data generation is a valuable tool in this regard, allowing for the creation of realistic test data while maintaining confidentiality. The integration of reinforcement learning methods and test case automation is streamlining testing processes, enabling faster and more efficient testing cycles. Security vulnerability testing is another critical application, with AI models effectively simulating adversarial attacks to identify weaknesses and improve overall system security. Functional testing strategies are being enhanced through the use of AI, with output quality assessment and uncertainty quantification methods ensuring the accuracy and reliability of test results. Latency measurement tools and prompt engineering techniques further optimize testing performance, making the AI-driven testing market a force to be reckoned with.
- Among the various testing methods, acceptance testing criteria have seen a notable shift, with AI models increasingly being employed to evaluate model robustness and interpretability. This trend is expected to continue, as the market continues to evolve and adapt to the ever-changing needs of the software development industry. A recent study reveals that AI in testing is projected to account for over 30% of the total testing market by 2025, underscoring its growing importance and impact. This data point underscores the significant role AI is playing and will continue to play in shaping the future of software testing.
What are the Key Data Covered in this Generative AI In Testing Market Research and Growth Report?
-
What is the expected growth of the Generative AI In Testing Market between 2025 and 2029?
-
USD 84651.2 thousand, at a CAGR of 22.7%
-
-
What segmentation does the market report cover?
-
The report segmented by Component (Software and Services), Application (Test case generation, Bug detection and reporting, Test script generation, Code generation and review, and Others), Type (Functional testing, Performance testing, Security testing, User interface testing, and Others), and Geography (North America, Europe, APAC, South America, and Middle East and Africa)
-
-
Which regions are analyzed in the report?
-
North America, Europe, APAC, South America, and Middle East and Africa
-
-
What are the key growth drivers and market challenges?
-
Imperative for accelerated delivery cycles amidst escalating software complexity, Data privacy, security, and intellectual property vulnerabilities
-
-
Who are the major players in the Generative AI In Testing Market?
-
Key Companies ACCELQ Inc., Applitools Ltd., BlinqIO, ContextQA, Functionize Inc., GitHub Inc., Globant SA, LambdaTest, Momentic AI., Qualiti, Relicx Inc., TestCollab Software LLC., TestGrid, testRigor Inc., Testsigma Technologies Inc., Tricentis GmbH, UiPath Inc., and Zettabytes Inc.
-
Market Research Insights
- In the dynamic the market, two key areas of focus are model accuracy evaluation and test data management. According to industry estimates, the use of generative AI models in testing is projected to increase by 30% annually, with over 60% of organizations implementing these models for anomaly detection and hypothesis testing procedures. Model accuracy evaluation is crucial, with F1-score calculation being a popular method for assessing model performance. For instance, a generative AI model may achieve an F1-score of 0.85 for defect detection, outperforming traditional automated testing tools with a score of 0.75. Test data management, on the other hand, is equally essential for maintaining data quality metrics.
- Effective test data management can reduce the risk of adversarial robustness assessment failures by up to 25%. This is significant considering that 40% of AI model validation efforts are spent on data preparation and management. These statistics underscore the importance of both model accuracy evaluation and test data management in the market. Other essential aspects include hypothesis testing procedures, anomaly detection testing, AI model validation, confidence interval estimation, test environment management, and statistical significance testing. Additionally, version control systems, AUC-ROC curve analysis, software testing lifecycle, model explainability methods, model deployment strategies, continuous integration processes, and test reporting tools are integral components of this evolving market.
We can help! Our analysts can customize this generative ai in testing market research report to meet your requirements.
 RIA -
RIA - 
