
Test Data Management Market Size 2025-2029
The test data management market size is forecast to increase by USD 727.3 million, at a CAGR of 10.5% between 2024 and 2029.
- The market is experiencing significant growth, driven by the increasing adoption of automation by enterprises to streamline their testing processes. The automation trend is fueled by the growing consumer spending on technological solutions, as businesses seek to improve efficiency and reduce costs. However, the market faces challenges, including the lack of awareness and standardization in test data management practices. This obstacle hinders the effective implementation of test data management solutions, requiring companies to invest in education and training to ensure successful integration. To capitalize on market opportunities and navigate challenges effectively, businesses must stay informed about emerging trends and best practices in test data management.
- By doing so, they can optimize their testing processes, reduce risks, and enhance overall quality.
What will be the Size of the Test Data Management Market during the forecast period?

Explore in-depth regional segment analysis with market size data - historical 2019-2023 and forecasts 2025-2029 - in the full report.
Request Free Sample
The market continues to evolve, driven by the ever-increasing volume and complexity of data. Data exploration and analysis are at the forefront of this dynamic landscape, with data ethics and governance frameworks ensuring data transparency and integrity. Data masking, cleansing, and validation are crucial components of data management, enabling data warehousing, orchestration, and pipeline development. Data security and privacy remain paramount, with encryption, access control, and anonymization key strategies. Data governance, lineage, and cataloging facilitate data management software automation and reporting. Hybrid data management solutions, including artificial intelligence and machine learning, are transforming data insights and analytics.
Data regulations and compliance are shaping the market, driving the need for data accountability and stewardship. Data visualization, mining, and reporting provide valuable insights, while data quality management, archiving, and backup ensure data availability and recovery. Data modeling, data integrity, and data transformation are essential for data warehousing and data lake implementations. Data management platforms are seamlessly integrated into these evolving patterns, enabling organizations to effectively manage their data assets and gain valuable insights. Data management services, cloud and on-premise, are essential for organizations to adapt to the continuous changes in the market and effectively leverage their data resources.
How is this Test Data Management Industry segmented?
The test data management industry research report provides comprehensive data (region-wise segment analysis), with forecasts and estimates in "USD million" for the period 2025-2029, as well as historical data from 2019-2023 for the following segments.
- Application
- On-premises
- Cloud-based
- Component
- Solutions
- Services
- End-user
- Information technology
- Telecom
- BFSI
- Healthcare and life sciences
- Others
- Sector
- Large enterprise
- SMEs
- Geography
- North America
- US
- Canada
- Europe
- France
- Germany
- Italy
- UK
- APAC
- Australia
- China
- India
- Japan
- Rest of World (ROW)
- North America
By Application Insights
The on-premises segment is estimated to witness significant growth during the forecast period.
In the realm of data management, on-premises testing represents a popular approach for businesses seeking control over their infrastructure and testing process. This approach involves establishing testing facilities within an office or data center, necessitating a dedicated team with the necessary skills. The benefits of on-premises testing extend beyond control, as it enables organizations to upgrade and configure hardware and software at their discretion, providing opportunities for exploration testing. Furthermore, data security is a significant concern for many businesses, and on-premises testing alleviates the risk of compromising sensitive information to third-party companies. Data exploration, a crucial aspect of data analysis, can be carried out more effectively with on-premises testing, ensuring data integrity and security.
Data masking, cleansing, and validation are essential data preparation techniques that can be executed efficiently in an on-premises environment. Data warehousing, data pipelines, and data orchestration are integral components of data management, and on-premises testing allows for seamless integration and management of these elements. Data governance frameworks, lineage, catalogs, and metadata are essential for maintaining data transparency and compliance. Data security, encryption, and access control are paramount, and on-premises testing offers greater control over these aspects. Data reporting, visualization, and insights are key outcomes of data analysis, and on-premises testing ensures data accuracy and reliability in these areas.
Big data, machine learning, and artificial intelligence are transforming data management, and on-premises testing provides a robust platform for implementing these technologies while maintaining data privacy and stewardship.
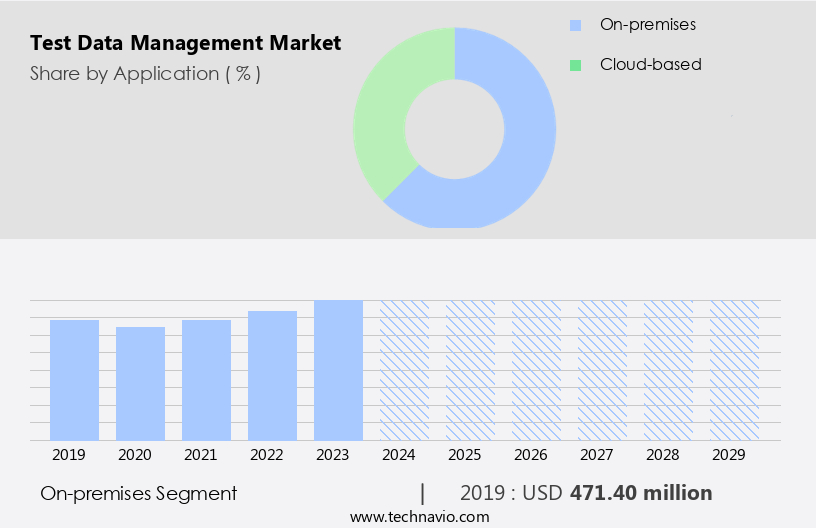
The On-premises segment was valued at USD 471.40 million in 2019 and showed a gradual increase during the forecast period.
Regional Analysis
APAC is estimated to contribute 39% to the growth of the global market during the forecast period.Technavio’s analysts have elaborately explained the regional trends and drivers that shape the market during the forecast period.

The North American the market is experiencing notable growth in 2024, fueled by the increasing adoption of automation and cloud technologies. The United States dominates this region due to a strong focus on regulatory compliance, data privacy, and security. Organizations are investing in test data management solutions to boost software testing efficiency, handle large data volumes, and accommodate agile and DevOps methodologies. The integration of artificial intelligence and machine learning into these solutions is becoming increasingly common, providing advanced simulation capabilities and minimizing human error in testing processes. Key players in the market include IBM, Informatica, Delphix, Oracle, and Broadcom, offering solutions such as data masking, data subsetting, and synthetic data generation.
Data exploration and data ethics are crucial components of test data management, ensuring data integrity and security during the testing process. Data warehousing, data orchestration, data backup, data modeling, and data governance framework are essential for effective test data management. Data lineage, data catalog, data management software, data automation, data transparency, data recovery, data access control, data pipelines, and data reporting facilitate streamlined testing processes. Data lake, data integrity, data security, data validation, data compliance, data visualization, data glossary, data mining, hybrid data management, and data science are integral to comprehensive test data management strategies. Regulations like GDPR and HIPAA necessitate robust data privacy and security measures, driving the market's growth.
Data stewardship, data transformation, and machine learning are emerging trends in test data management, enabling organizations to gain valuable data insights and maintain data quality.
Market Dynamics
Our researchers analyzed the data with 2024 as the base year, along with the key drivers, trends, and challenges. A holistic analysis of drivers will help companies refine their marketing strategies to gain a competitive advantage.
What are the key market drivers leading to the rise in the adoption of Test Data Management Industry?
- The increasing implementation of automation technologies by enterprises serves as the primary catalyst for market growth.
- Test data management involves various processes such as scripting, data masking, cloning, provisioning, and data transformation. These activities can be automated, enhancing efficiency and ensuring the accuracy of test results during the development and testing phase. Automation tools can verify that data are provided in the correct format at all times, integrating seamlessly with automation frameworks. Artificial intelligence and data mining technologies are increasingly being integrated into test data management solutions, enabling the extraction of valuable insights from data metadata. Hybrid data management approaches, combining relational databases and data virtualization, offer flexibility and scalability in managing both structured and big data.
- Data privacy and security regulations, such as GDPR and HIPAA, necessitate stringent data stewardship and compliance measures. Automated test data management solutions can help organizations meet these requirements, ensuring data privacy and protection while maintaining data integrity. Data transformation and data mining play a crucial role in gaining valuable insights from test data, contributing to continuous improvement and innovation. By automating test data management, organizations can focus on gaining data insights and driving business growth while ensuring the accuracy and reliability of their testing processes.
What are the market trends shaping the Test Data Management Industry?
- The increasing preference for technological solutions among consumers represents a significant market trend. This trend is driven by the growing demand for convenience, efficiency, and connectivity in daily life.
- Test data management systems are gaining significant traction in businesses due to the increasing demand for advanced technologies such as cloud deployment models and enhanced data analytics. These solutions offer numerous benefits, including increased efficiency in data maintenance and retrieval, cost savings, faster deployments, and process automation. The integration of technologies like the Internet of Things (IoT), machine learning, and artificial intelligence (AI) is projected to further enhance the capabilities and performance of test data management solutions. This technological evolution is expected to create lucrative opportunities in the near future. Cloud technology integration enables businesses to interact with various cloud platforms, ensuring data accessibility and flexibility.
- Machine learning and data science applications enable more accurate and efficient data analysis, while NoSQL databases and data encryption ensure data security and integrity. Data integration, data anonymization, data quality management, data archiving, and data accountability are essential aspects of test data management, ensuring data accuracy, security, and compliance with regulations. Data management services providers offer customized solutions to cater to specific business needs, ensuring seamless data management and optimization. In conclusion, the market is poised for growth due to the increasing adoption of advanced technologies and the need for efficient, secure, and compliant data management solutions.
What challenges does the Test Data Management Industry face during its growth?
- The absence of awareness and standardization poses a significant challenge to the industry's growth, hindering progress and limiting advancements.
- Test data management is a crucial aspect of ensuring the quality and accuracy of software testing. The importance of effective test data management has come to light with studies indicating that approximately 10% of production issues can be traced back to inadequate test data. Traditional approaches to test data management often involve only team leaders being responsible for its maintenance. However, it is essential that all team members understand the processes and tools involved in test data management to prevent errors.
- Neglecting test data management can lead to significant consequences for a company. By implementing a robust test data management platform, organizations can ensure that adequate, accurate, and consistent data is available for testing, ultimately reducing production issues and improving overall software quality.
Exclusive Customer Landscape
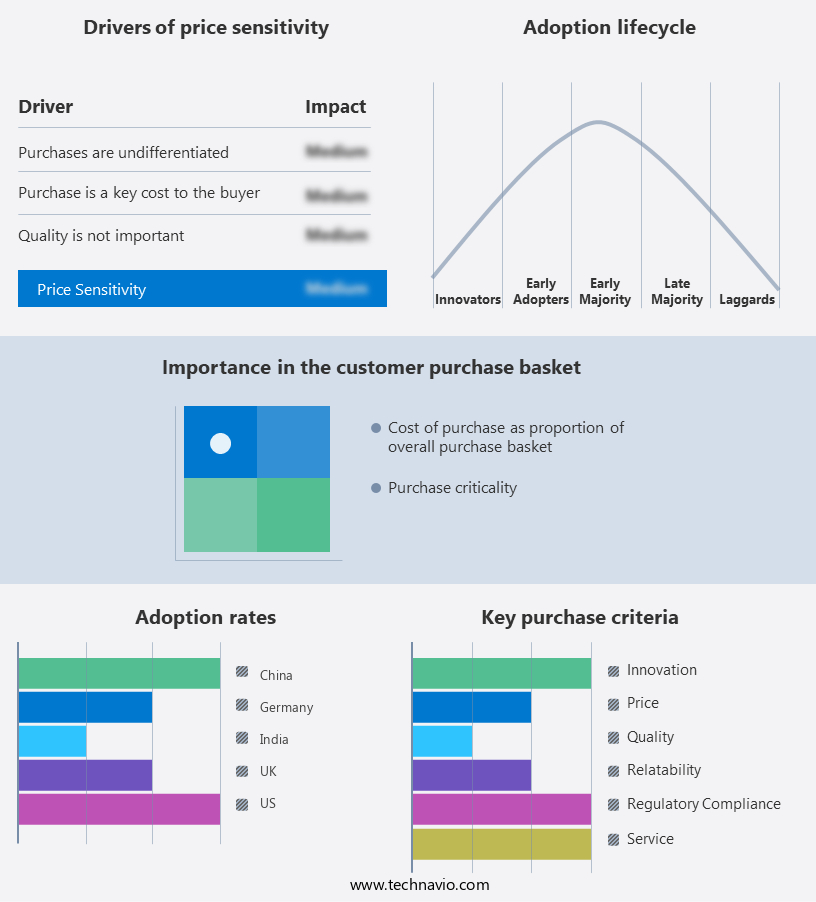
The test data management market forecasting report includes the adoption lifecycle of the market, covering from the innovator’s stage to the laggard’s stage. It focuses on adoption rates in different regions based on penetration. Furthermore, the test data management market report also includes key purchase criteria and drivers of price sensitivity to help companies evaluate and develop their market growth analysis strategies.
Customer Landscape
Key Companies & Market Insights
Companies are implementing various strategies, such as strategic alliances, test data management market forecast, partnerships, mergers and acquisitions, geographical expansion, and product/service launches, to enhance their presence in the industry.
ANSYS Inc. - This company specializes in managing test data through capture and traceability, ensuring accurate analysis for design and simulation stages. By employing advanced techniques, we maintain full accountability for test data, enabling efficient and effective research processes. Our solution supports comprehensive data management, enhancing overall project success.
The industry research and growth report includes detailed analyses of the competitive landscape of the market and information about key companies, including:
- ANSYS Inc.
- BMC Software Inc.
- Broadcom Inc.
- Cigniti Technologies Ltd.
- Dassault Systemes SE
- DATPROF
- Delphix Corp.
- Ekobit d.o.o
- ESCO Technologies Inc.
- GenRocket Inc.
- Hexagon AB
- Informatica Inc.
- Infosys Ltd.
- International Business Machines Corp.
- Mage Inc.
- Oracle Corp.
- Original Software Group Ltd.
- Parasoft Corp.
- Siemens AG
- Solix Technologies Inc.
Qualitative and quantitative analysis of companies has been conducted to help clients understand the wider business environment as well as the strengths and weaknesses of key industry players. Data is qualitatively analyzed to categorize companies as pure play, category-focused, industry-focused, and diversified; it is quantitatively analyzed to categorize companies as dominant, leading, strong, tentative, and weak.
Recent Development and News in Test Data Management Market
- In February 2024, IBM announced the launch of its new Test Data Management solution, IBM Test Data Management 3.0, which integrates AI and automation to help organizations manage and secure test data more efficiently (IBM Press Release, 2024). In May 2024, Infosys and Hewlett Packard Enterprise (HPE) entered into a strategic partnership to offer a comprehensive Test Data Management solution, combining Infosys' testing services with HPE's non-production data services (Infosys Press Release, 2024).
- In January 2025, Capgemini Engineering acquired TestPlant, a leading provider of automated test design and execution solutions, to expand its Test Data Management capabilities and strengthen its position in the market (Capgemini Engineering Press Release, 2025). In March 2025, Microsoft announced the general availability of Azure Data Masking, a cloud-based test data management solution that uses machine learning to automatically discover and protect sensitive data in test environments (Microsoft Press Release, 2025).
- These developments reflect significant advancements in the market, with companies focusing on AI and automation integration, strategic partnerships, acquisitions, and cloud-based solutions to enhance their offerings and cater to the evolving needs of organizations in managing test data more effectively and securely. (Sources: IBM Press Release, 2024; Infosys Press Release, 2024; Capgemini Engineering Press Release, 2025; Microsoft Press Release, 2025)
Research Analyst Overview
- The market is witnessing significant activity and trends as businesses prioritize data reliability and accuracy in their operations. Data insights generation is a key focus, with data visualization tools and data modeling languages enabling effective data exploration and analysis. Data security controls, including data encryption algorithms and data masking techniques, are essential for safeguarding sensitive information. Artificial intelligence applications and nosql database technologies are revolutionizing data management, enabling real-time data processing and analysis. Data redaction and data de-identification are crucial for maintaining data privacy policies and ensuring data compliance audits. Data transformation techniques, such as data modeling and data lineage tracking, facilitate data consistency and accuracy.
- Data governance policies and data validity are essential for maintaining data quality metrics and ensuring data integrity. Data reporting tools and big data analytics enable businesses to gain valuable insights from their data, while data backup strategies and data recovery procedures ensure business continuity. Data virtualization techniques and data metadata management streamline data access and management. Data security controls, including data encryption algorithms and data masking techniques, are essential for safeguarding sensitive information. Data privacy policies and data compliance audits require data de-identification and data obfuscation to protect personal information. Data modeling languages, data transformation techniques, and data orchestration platforms enable efficient data processing and analysis.
- Data lineage tracking and data simulation facilitate data accuracy and data exploration methods. Data catalog management and data stewardship programs ensure data accountability and data transparency initiatives. Data consistency, data accuracy, and data quality metrics are essential for effective data management. Data tokenization and data metadata management facilitate data subsetting and data backup strategies. Data warehousing architecture and data lake implementation enable scalable data management and analysis. Overall, the market is evolving rapidly, with a focus on data security, data privacy, and data accuracy. Businesses must adopt effective data management strategies to stay competitive and maintain data integrity.
Dive into Technavio’s robust research methodology, blending expert interviews, extensive data synthesis, and validated models for unparalleled Test Data Management Market insights. See full methodology.
|
Market Scope |
|
|
Report Coverage |
Details |
|
Page number |
225 |
|
Base year |
2024 |
|
Historic period |
2019-2023 |
|
Forecast period |
2025-2029 |
|
Growth momentum & CAGR |
Accelerate at a CAGR of 10.5% |
|
Market growth 2025-2029 |
USD 727.3 million |
|
Market structure |
Fragmented |
|
YoY growth 2024-2025(%) |
9.4 |
|
Key countries |
US, China, India, Canada, UK, Germany, Japan, Australia, France, and Italy |
|
Competitive landscape |
Leading Companies, Market Positioning of Companies, Competitive Strategies, and Industry Risks |
What are the Key Data Covered in this Test Data Management Market Research and Growth Report?
- CAGR of the Test Data Management industry during the forecast period
- Detailed information on factors that will drive the growth and forecasting between 2025 and 2029
- Precise estimation of the size of the market and its contribution of the industry in focus to the parent market
- Accurate predictions about upcoming growth and trends and changes in consumer behaviour
- Growth of the market across North America, APAC, Europe, Middle East and Africa, and South America
- Thorough analysis of the market’s competitive landscape and detailed information about companies
- Comprehensive analysis of factors that will challenge the test data management market growth of industry companies
We can help! Our analysts can customize this test data management market research report to meet your requirements.
 RIA -
RIA - 
