
US GIS In Utility Industry Market Size 2026-2030
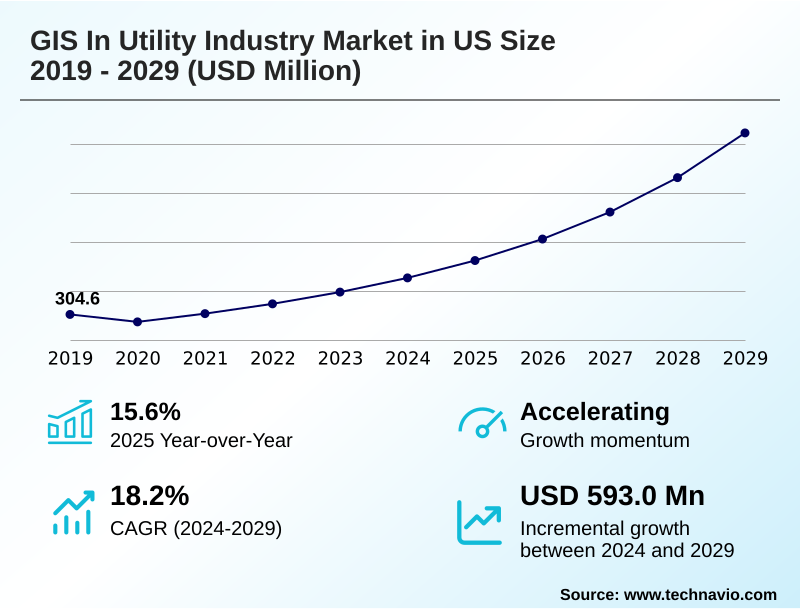
The us gis in utility industry market size is valued to increase by USD 735.6 million, at a CAGR of 19.1% from 2025 to 2030. Imperative for grid modernization and renewable energy integration will drive the us gis in utility industry market.
Major Market Trends & Insights
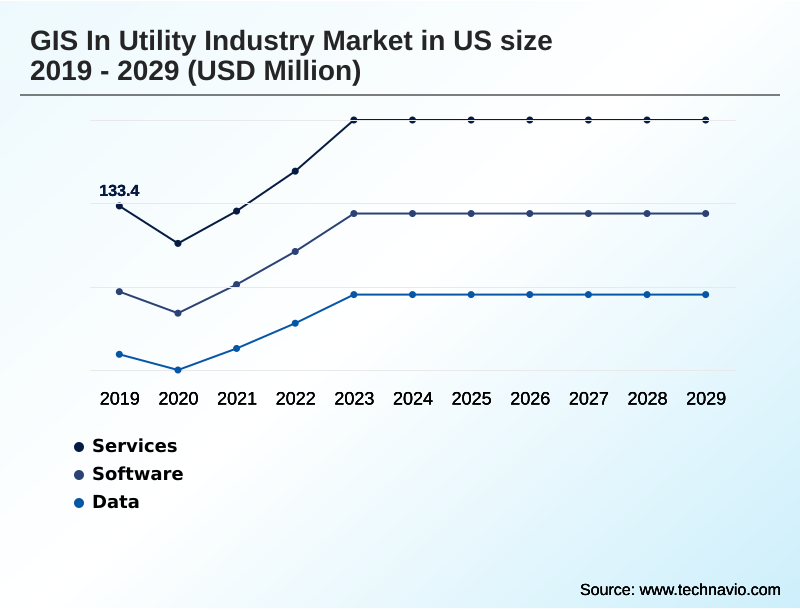
- By Product - Services segment was valued at USD 195.2 million in 2024
- By Deployment - On-premises segment accounted for the largest market revenue share in 2024
Market Size & Forecast
- Market Opportunities: USD 986.6 million
- Market Future Opportunities: USD 735.6 million
- CAGR from 2025 to 2030 : 19.1%
Market Summary
- The gis in utility industry market in us is undergoing a significant transformation, moving from static mapping to dynamic, intelligent infrastructure management. This evolution is driven by the need for enhanced grid modernization and the integration of decentralized energy sources, which demand sophisticated spatial analysis and predictive analytics.
- The adoption of digital twin technology allows operators to create virtual replicas of their networks for simulation and predictive maintenance, improving asset performance. For instance, a utility can simulate the impact of a storm on its electric grid management, optimizing crew deployment for outage management and significantly reducing downtime.
- Geospatial artificial intelligence is key, processing vast amounts of geospatial data from remote sensing and LiDAR data sources to automate vegetation management and ensure pipeline integrity.
- While cybersecurity vulnerabilities and data fragmentation pose challenges, the push for greater operational resilience and regulatory compliance continues to accelerate the adoption of these advanced spatial technologies, fundamentally reshaping how utilities monitor and maintain their critical assets across the country.
What will be the Size of the US GIS In Utility Industry Market during the forecast period?
Get Key Insights on Market Forecast (PDF) Get Free Sample
How is the US GIS In Utility Industry Market Segmented?
The us gis in utility industry industry research report provides comprehensive data (region-wise segment analysis), with forecasts and estimates in "USD million" for the period 2026-2030, as well as historical data from 2020-2024 for the following segments.
- Product
- Services
- Software
- Data
- Deployment
- On-premises
- Cloud
- Product type
- Electric power utilities
- Water and wastewater utilities
- Gas utilities
- Telecommunication utilities
- Type
- Investor-owned
- Public-owned
- Cooperatives
- Geography
- North America
- US
- North America
By Product Insights
The services segment is estimated to witness significant growth during the forecast period.
The services segment is integral to the successful implementation of spatial technologies, providing consulting, system integration, and data migration to align systems with utility needs.
Professional services are essential for transitioning from legacy records to modern digital databases that support high-fidelity geospatial data.
As utilities adopt sophisticated spatial analysis and real-time monitoring, the demand for managed services grows, aiding in data governance, SCADA integration, and cybersecurity. Service providers guide the management of the entire infrastructure lifecycle, ensuring network connectivity is accurately modeled.
Effective deployment of cloud-native geospatial environments and mobile workforce management tools, often supported by services, has shown to improve field data accuracy with real-time kinematics by over 30%, optimizing operations and asset management.
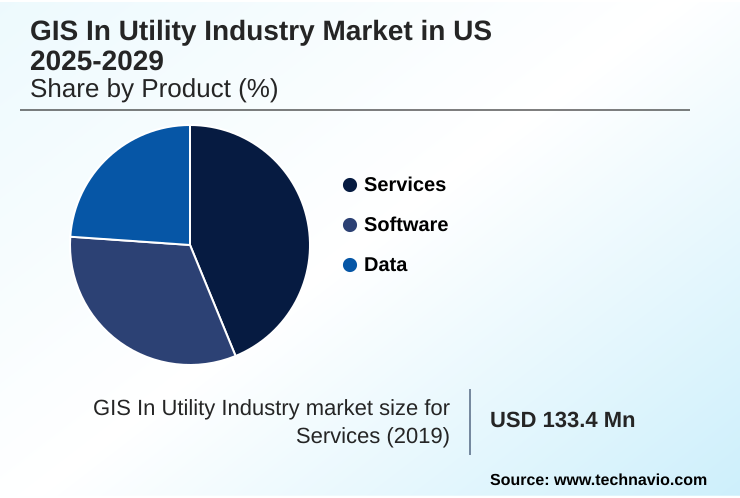
The Services segment was valued at USD 195.2 million in 2024 and showed a gradual increase during the forecast period.
Market Dynamics
Our researchers analyzed the data with 2025 as the base year, along with the key drivers, trends, and challenges. A holistic analysis of drivers will help companies refine their marketing strategies to gain a competitive advantage.
- The market is advancing beyond foundational mapping, embracing sophisticated strategies like gis for renewable energy integration to manage the complexities of a decentralized grid. This includes mapping distributed energy resources (der) and using network data models for smart grids.
- A key focus is on proactive risk mitigation, where satellite imagery for fire risk monitoring and enhancing vegetation management programs are critical for asset protection. This feeds into gis-enabled predictive maintenance strategies, which are core to modern operations.
- The development of a digital twin for transmission networks is a major goal, with utilities leveraging cloud-based utility mapping solutions for this purpose. These digital replicas, built with 3d visualization of underground utility networks and data from integrating gis with scada systems, allow for unprecedented analysis.
- For instance, spatial analysis for pipeline leak detection is becoming more accurate, improving water distribution system efficiency. The focus is also on empowering field crews through mobile gis for field crew dispatch and optimizing asset inspection with gis, often using drone data for infrastructure assessment.
- Effectively managing subterranean utility data accurately remains a core challenge, but successful implementations of utility asset lifecycle management software and gis tools for regulatory compliance reporting demonstrate significant progress. Projects utilizing geospatial platform for grid resilience for real-time outage management mapping are completing planning phases nearly twice as fast as those relying on older, siloed methods.
What are the key market drivers leading to the rise in the adoption of US GIS In Utility Industry Industry?
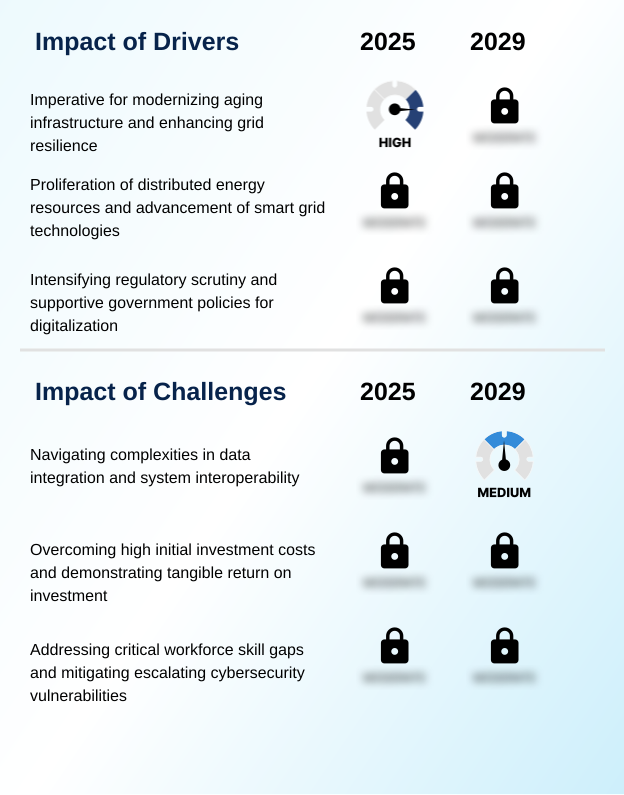
- The critical need for grid modernization and seamless integration of renewable energy sources is a primary driver of market growth.
- The market is primarily driven by the imperative for grid modernization and enhanced climate resilience.
- Utilities are leveraging satellite imagery analysis for comprehensive electric grid management and to mitigate risks from vegetation encroachment, which has reduced environment-related outages by up to 25% in some areas.
- The need for strict regulatory compliance is accelerating the adoption of advanced utility asset management platforms that improve data accuracy and reporting. This investment in smart grid infrastructure not only boosts asset performance but also ensures grid stability.
- Enhanced geospatial data systems are crucial for integrating renewables and managing a more complex energy landscape, with implementation leading to a 15% improvement in grid balancing efficiency.
What are the market trends shaping the US GIS In Utility Industry Industry?
- The integration of artificial intelligence and machine learning is a transformative trend, enabling predictive analytics for enhanced operational foresight and proactive asset management.
- Key trends are reshaping utility operations through advanced technology. The integration of geospatial artificial intelligence and predictive analytics enables proactive strategies, moving beyond traditional maintenance schedules. This is exemplified by the use of remote sensing data for load forecasting and managing DER integration more effectively.
- The creation of real-time digital twins using digital twin technology and sophisticated 3D modeling provides a dynamic, virtual view of the entire network. This allows for complex simulations and supports advanced distribution management, with some utilities improving forecast accuracy by over 15%.
- This shift toward intelligent, automated systems is enhancing decision-making and optimizing resource allocation, leading to efficiency gains of up to 20% in operational planning.
What challenges does the US GIS In Utility Industry Industry face during its growth?
- Data fragmentation and the complexities of integrating legacy infrastructure present significant challenges to market advancement.
- Significant challenges persist, primarily around data integration and security. The creation of a cohesive spatial data infrastructure is often hindered by siloed geospatial data and the difficulty of accurate subterranean asset location. Integrating new platforms with legacy systems requires complex ERP integration and robust utility network management protocols.
- This fragmentation impacts the integrity of the network model and complicates pipeline integrity assessments. Furthermore, cybersecurity vulnerabilities are a growing concern as more systems become interconnected, with attacks on asset data repositories increasing by 40% in the last year. Effective asset data collection and harmonization remain critical hurdles to unlocking the full potential of advanced analytics.
Exclusive Technavio Analysis on Customer Landscape
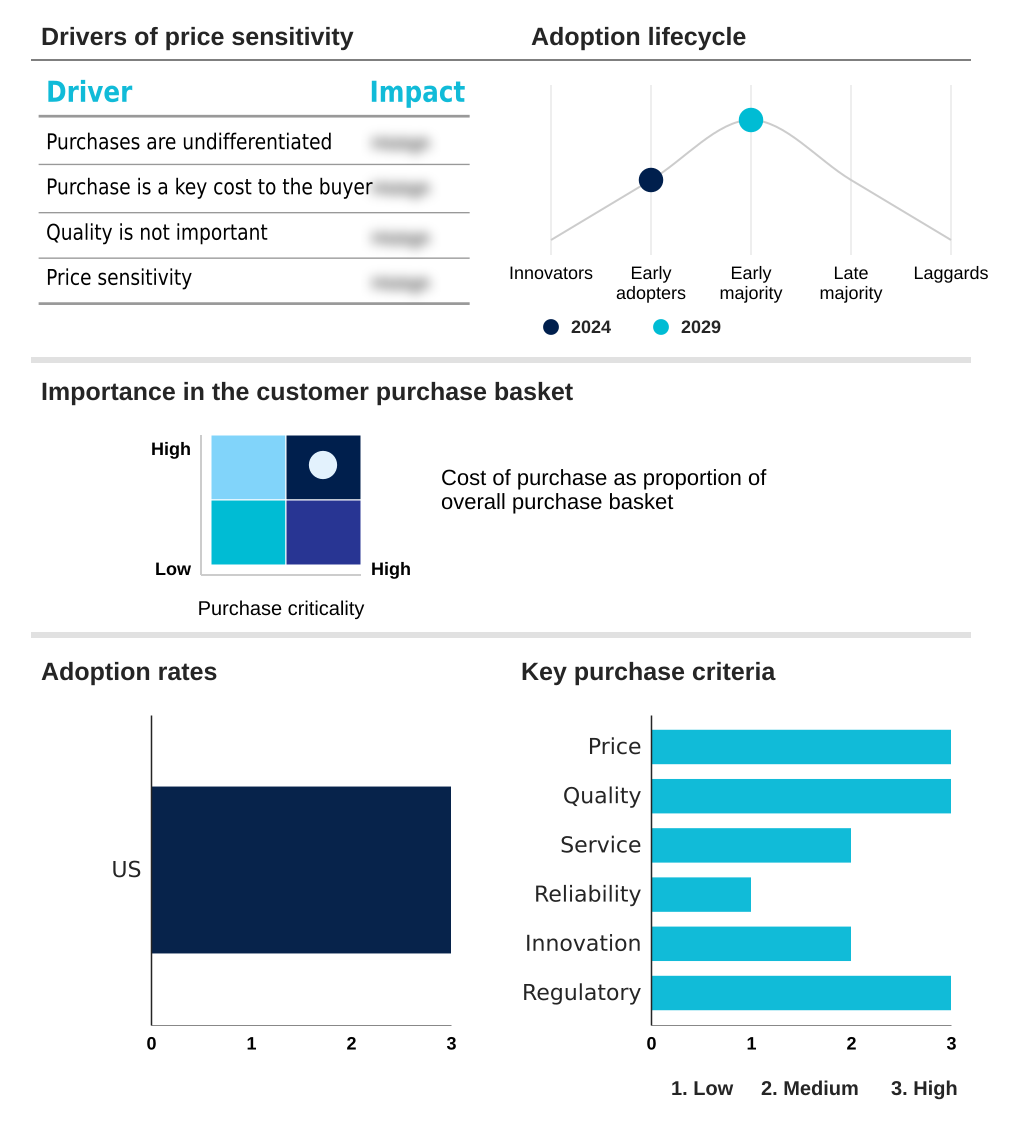
The us gis in utility industry market forecasting report includes the adoption lifecycle of the market, covering from the innovator’s stage to the laggard’s stage. It focuses on adoption rates in different regions based on penetration. Furthermore, the us gis in utility industry market report also includes key purchase criteria and drivers of price sensitivity to help companies evaluate and develop their market growth analysis strategies.
Customer Landscape of US GIS In Utility Industry Industry
Competitive Landscape
Companies are implementing various strategies, such as strategic alliances, us gis in utility industry market forecast, partnerships, mergers and acquisitions, geographical expansion, and product/service launches, to enhance their presence in the industry.
Autodesk Inc. - Delivers enterprise-grade geospatial platforms enabling advanced utility network management, spatial analysis, and cloud-based data visualization for critical infrastructure operations.
The industry research and growth report includes detailed analyses of the competitive landscape of the market and information about key companies, including:
- Autodesk Inc.
- Bentley Systems Inc.
- Caliper Corp.
- CartoDB Inc.
- Epoch Solutions Group Inc
- Esri Inc.
- Futura Systems Inc
- GE Vernova Inc.
- GeoConcept SAS
- HERE Technologies
- Hexagon AB
- L3Harris Technologies Inc.
- Latapult Inc
- Mapbox Inc.
- mPower Innovations Ltd
- Pitney Bowes Inc.
- Precisely
- TomTom NV
- Trimble Inc.
- VertiGIS Ltd.
Qualitative and quantitative analysis of companies has been conducted to help clients understand the wider business environment as well as the strengths and weaknesses of key industry players. Data is qualitatively analyzed to categorize companies as pure play, category-focused, industry-focused, and diversified; it is quantitatively analyzed to categorize companies as dominant, leading, strong, tentative, and weak.
Recent Development and News in Us gis in utility industry market
- In February 2025, Duke Energy initiated a significant expansion of its geospatial analytics platform in collaboration with Esri to better manage the integration of five gigawatts of new solar capacity across the Carolinas.
- In March 2025, Pacific Gas and Electric Company deployed a new satellite-based geospatial monitoring system provided by Planet Labs to monitor forest health and fire risks along thousands of miles of transmission lines in California.
- In April 2025, Southern Company announced a partnership with Bentley Systems to develop a comprehensive digital twin of the utility's transmission network using high-fidelity geospatial data to improve maintenance scheduling and regulatory reporting.
- In May 2025, American Water partnered with Trimble to deploy high-precision mobile mapping units to its entire field service workforce to improve the accuracy of subterranean asset location data.
Dive into Technavio’s robust research methodology, blending expert interviews, extensive data synthesis, and validated models for unparalleled US GIS In Utility Industry Market insights. See full methodology.
| Market Scope | |
|---|---|
| Page number | 208 |
| Base year | 2025 |
| Historic period | 2020-2024 |
| Forecast period | 2026-2030 |
| Growth momentum & CAGR | Accelerate at a CAGR of 19.1% |
| Market growth 2026-2030 | USD 735.6 million |
| Market structure | Fragmented |
| YoY growth 2025-2026(%) | 16.6% |
| Key countries | US |
| Competitive landscape | Leading Companies, Market Positioning of Companies, Competitive Strategies, and Industry Risks |
Research Analyst Overview
- The gis in utility industry market in us reflects a strategic pivot toward data-centric resilience and operational intelligence. Boardroom decisions increasingly rely on geospatial data and spatial analysis to navigate grid modernization and ensure robust utility asset management. The focus has shifted from reactive outage management to proactive strategies using predictive analytics and geospatial artificial intelligence.
- Technologies like digital twin technology are becoming central to managing the infrastructure lifecycle, offering deep insights into asset performance. For instance, utilities leveraging LiDAR data and satellite imagery analysis for vegetation management have achieved a 30% reduction in related power disruptions.
- The ability to perform detailed water network analysis or ensure pipeline integrity through a comprehensive network model is now a competitive differentiator.
- This evolution is supported by enhanced mobile workforce management tools using real-time kinematics from drone surveying, which improves the accuracy of subterranean asset location and high-fidelity geospatial data collection, providing critical situational awareness for electric grid management across a unified spatial data infrastructure.
What are the Key Data Covered in this US GIS In Utility Industry Market Research and Growth Report?
-
What is the expected growth of the US GIS In Utility Industry Market between 2026 and 2030?
-
USD 735.6 million, at a CAGR of 19.1%
-
-
What segmentation does the market report cover?
-
The report is segmented by Product (Services, Software, and Data), Deployment (On-premises, and Cloud), Product Type (Electric power utilities, Water and wastewater utilities, Gas utilities, and Telecommunication utilities), Type (Investor-owned, Public-owned, and Cooperatives) and Geography (North America)
-
-
Which regions are analyzed in the report?
-
North America
-
-
What are the key growth drivers and market challenges?
-
Imperative for grid modernization and renewable energy integration, Fragmentation of data and legacy infrastructure integration
-
-
Who are the major players in the US GIS In Utility Industry Market?
-
Autodesk Inc., Bentley Systems Inc., Caliper Corp., CartoDB Inc., Epoch Solutions Group Inc, Esri Inc., Futura Systems Inc, GE Vernova Inc., GeoConcept SAS, HERE Technologies, Hexagon AB, L3Harris Technologies Inc., Latapult Inc, Mapbox Inc., mPower Innovations Ltd, Pitney Bowes Inc., Precisely, TomTom NV, Trimble Inc. and VertiGIS Ltd.
-
Market Research Insights
- Market dynamics are increasingly shaped by the push for operational efficiency and data-driven decision-making. The adoption of cloud-native geospatial environments allows for scalable processing of geospatial data, with some utilities reporting a 30% reduction in data processing time compared to legacy on-premise systems.
- The implementation of real-time digital twins for 3D modeling of complex infrastructure provides a holistic view of asset health, improving load forecasting accuracy by up to 20%. This shift enables superior disaster response planning and climate resilience.
- Furthermore, ERP integration ensures that spatial insights from utility network management systems are available across the enterprise, breaking down information silos and enhancing strategic alignment. The focus on smart grid infrastructure and DER integration further underscores the market's momentum toward interconnected, intelligent systems.
We can help! Our analysts can customize this us gis in utility industry market research report to meet your requirements.
 RIA -
RIA - 
