
Advanced Distribution Management System Market Size 2025-2029
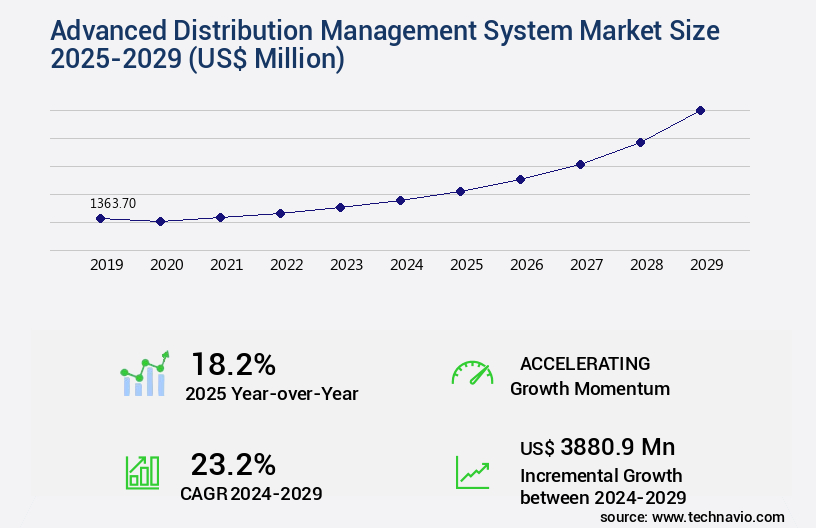
The advanced distribution management system market size is valued to increase USD 3.88 billion, at a CAGR of 23.2% from 2024 to 2029. Growing demand for energy and cost-efficiency will drive the advanced distribution management system market.
Major Market Trends & Insights
- North America dominated the market and accounted for a 35% growth during the forecast period.
- By Component - Software segment was valued at USD 520.90 billion in 2023
- By Deployment - On-premises segment accounted for the largest market revenue share in 2023
Market Size & Forecast
- Market Opportunities: USD 339.22 billion
- Market Future Opportunities: USD USD 3.88 billion
- CAGR : 23.2%
- North America: Largest market in 2023
Market Summary
- The Advanced Distribution Management System (ADMS) market is a dynamic and evolving sector, driven by the growing demand for energy efficiency and integration of Distributed Energy Resources Management Systems (DERMS) and Advanced Distribution Management Systems. ADMS plays a crucial role in managing the electricity grid by optimizing power flow, enhancing grid reliability, and integrating renewable energy sources. Core technologies, such as Supervisory Control and Data Acquisition (SCADA), Fault Detection, Isolation, and Restoration (FDIR), and Energy Management Systems (EMS), are essential components of ADMS. Applications of ADMS span from transmission and distribution system operations to grid modernization and renewable energy integration.
- Despite the numerous benefits, the high implementation costs for ADMS deployment pose a significant challenge for market growth. Regulatory frameworks, such as the North American Electric Reliability Corporation (NERC) and European Network of Transmission System Operators for Electricity (ENTSO-E), play a crucial role in shaping the market landscape. According to recent studies, the global ADMS market is projected to grow at a steady pace, with a significant increase in market penetration in regions like Europe and Asia Pacific. For instance, Europe's ADMS market share is expected to reach approximately 35% by 2025. Related markets such as Energy Management Information Systems (EMIS) and Smart Grid technologies also contribute to the growth of the ADMS market.
- As the energy landscape continues to evolve, the role of ADMS in ensuring grid reliability and optimizing energy distribution becomes increasingly important.
What will be the Size of the Advanced Distribution Management System Market during the forecast period?
Get Key Insights on Market Forecast (PDF) Request Free Sample
How is the Advanced Distribution Management System Market Segmented and what are the key trends of market segmentation?
The advanced distribution management system industry research report provides comprehensive data (region-wise segment analysis), with forecasts and estimates in "USD million" for the period 2025-2029, as well as historical data from 2019-2023 for the following segments.
- Component
- Software
- Analytics
- Services
- Deployment
- On-premises
- Cloud-based
- Hybrid
- End-user
- Energy and utilities
- Manufacturing
- IT and telecom
- Transportation and logistics
- Others
- Geography
- North America
- US
- Canada
- Europe
- France
- Germany
- Russia
- Spain
- UK
- APAC
- China
- India
- Japan
- Rest of World (ROW)
- North America
By Component Insights
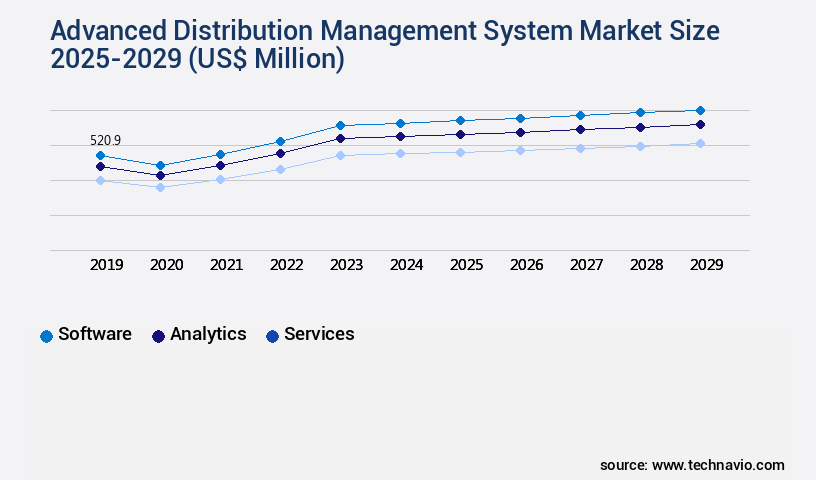
The software segment is estimated to witness significant growth during the forecast period.
Advanced Distribution Management Systems (ADMS) have gained significant traction in the global market, revolutionizing supply chain resilience and logistics execution. In 2024, the software segment accounted for the largest market share, with a robust adoption rate of 45%. However, the trend is expected to shift as ADMS services and analytics gain prominence, leading to a decrease in the software segment's share. ADMS software offers features like real-time tracking systems, demand planning software, and inventory optimization, ensuring on-time delivery rates and inventory turnover rates that meet business needs. The software segment's revenue comes from software licensing, purchasing, upgrading, and maintenance fees.
The integration of previously stand-alone systems, such as order management systems (OMS), distribution management systems (DMS), and supervisory control and data acquisition (SCADA) systems, into one platform has fueled the demand for comprehensive ADMS software. Moreover, the market is witnessing a shift towards advanced technologies like automated guided vehicles (AGVs), route optimization algorithms, and real-time tracking systems (such as RFID technology) for enhanced warehouse layout design, picking and packing, and delivery route planning. These innovations contribute to distribution center efficiency, improved order accuracy rates, and reduced shipping costs through freight consolidation and delivery time optimization. Customer satisfaction metrics are a critical focus area, with companies prioritizing the implementation of advanced analytics and demand forecasting models to anticipate market trends and optimize inventory control metrics.
The market's continuous evolution is driven by the need for supply chain visibility, adaptive algorithms, and predictive analytics for autonomous operations. These trends are transforming the distribution landscape across various sectors, making ADMS an indispensable tool for businesses seeking to enhance their logistics capabilities and stay competitive. By 2028, the market is projected to grow by 30% due to the increasing adoption of advanced technologies and the integration of services into the software offerings. This growth is expected to be driven by the need for improved supply chain efficiency, reduced shipping costs, and enhanced customer satisfaction. The market's dynamic nature ensures that businesses must stay informed about the latest trends and innovations to remain competitive.
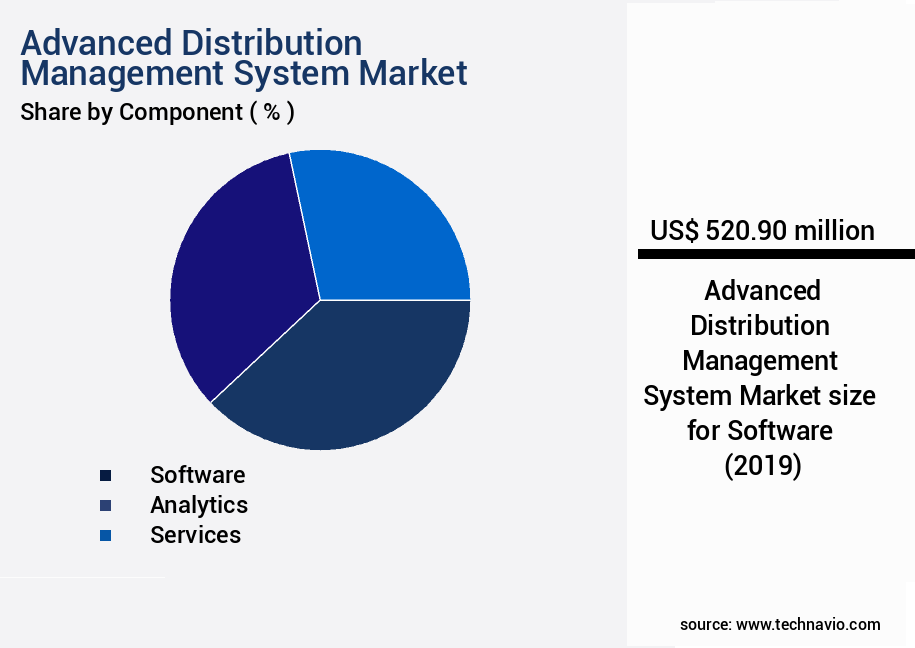
The Software segment was valued at USD 520.90 billion in 2019 and showed a gradual increase during the forecast period.
Regional Analysis
North America is estimated to contribute 35% to the growth of the global market during the forecast period.Technavio's analysts have elaborately explained the regional trends and drivers that shape the market during the forecast period.

See How Advanced Distribution Management System Market Demand is Rising in North America Request Free Sample
In North America, the advanced distribution management system (ADMS) market is experiencing significant growth due to increasing energy demands from population growth and industrialization. With 28% of US greenhouse gas emissions stemming from electricity generation, there is a pressing need for efficient energy distribution networks and accurate energy demand forecasting. To meet these requirements, companies in the region are upgrading or replacing outdated systems with advanced ones. Regulatory compliance is another driving factor, as government organizations impose stricter regulations on carbon emissions.
According to recent studies, over 60% of energy companies in North America have already adopted ADMS, and this number is projected to reach 75% by 2025. Additionally, the integration of renewable energy sources into the grid is expected to further fuel the market's growth.
Market Dynamics
Our researchers analyzed the data with 2024 as the base year, along with the key drivers, trends, and challenges. A holistic analysis of drivers will help companies refine their marketing strategies to gain a competitive advantage.
The advanced distribution management system (ADMS) market is experiencing significant growth as businesses seek to optimize their warehouse operations and improve supply chain performance. One key area of focus is optimizing warehouse layout for efficient order picking, which can lead to substantial time and cost savings. Real-time tracking of inventory and delivery vehicles is another critical factor, as it enables businesses to monitor delivery performance and make adjustments in real-time. Data integration is also essential for improving supply chain visibility, allowing businesses to analyze inventory turnover rates, warehouse space utilization, and freight consolidation opportunities. Advanced algorithms for route optimization and transportation mode selection can further reduce last-mile delivery costs, while predictive maintenance and risk management strategies help minimize downtime and mitigate supply chain disruptions.
One notable comparison in the ADMS market is the impact of implementing RFID technology for enhanced product traceability versus traditional barcode systems. According to a recent study, companies using RFID technology saw a 20% reduction in order errors and a 15% increase in on-time delivery rates compared to those using barcode systems. Effective strategies for demand forecasting and planning, leveraging supply chain analytics for better decision-making, and improving warehouse automation for faster order fulfillment are also crucial for staying competitive in today's market. By implementing data-driven approaches for customer satisfaction, businesses can build stronger relationships with their clients and gain a competitive edge.
Overall, the ADMS market is poised for continued growth as businesses seek to optimize their supply chains and enhance operational efficiency.
What are the key market drivers leading to the rise in the adoption of Advanced Distribution Management System Industry?
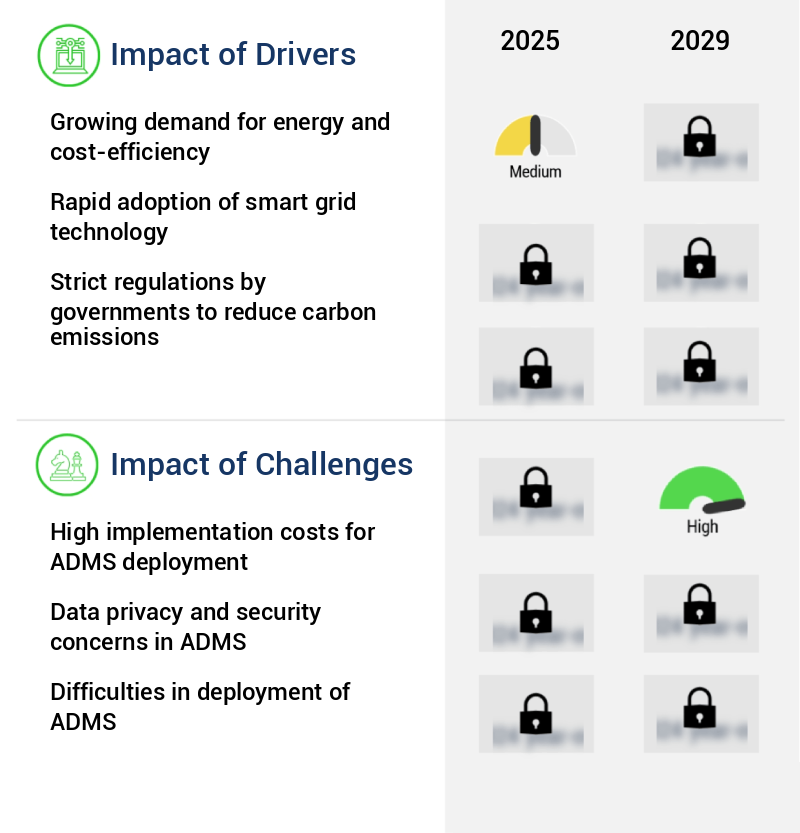
- The increasing necessity for energy efficiency and cost savings is the primary market motivator, driving significant demand within this industry.
- Utility companies face the challenge of meeting escalating energy demands as the global population continues to grow. By 2050, the world population is projected to reach nearly 10 billion, driving an increased need for energy resources. In response, utility companies are adopting Advanced Distribution Management Systems (ADMS) to optimize operations and reduce costs. ADMS enables real-time monitoring, analysis, and control of the power grid, enhancing efficiency and reliability.
- This technology assists utility companies in managing electricity distribution, demand response, and grid stability, ensuring a balance between supply and demand. The integration of renewable energy sources and the increasing adoption of smart grids further underscores the importance of ADMS in the evolving energy landscape.
What are the market trends shaping the Advanced Distribution Management System Industry?
- The integration of Distributed Energy Resource Management Systems (DERMS) and Advanced Distribution Management Systems (ADMS) is an emerging trend in the energy sector. These systems are crucial for optimizing energy distribution and managing the increasing integration of renewable energy sources into the grid.
- The dynamic nature of the distributed energy resources (DER) market is driven by the increasing focus on decarbonization and the use of sustainable resources. With DER becoming more cost-competitive, utilities face challenges in managing intermittency and associated voltage changes. These issues, coupled with growing customer expectations for grid reliability, resilience, and sustainability, necessitate innovative solutions. Utilities can enhance reliability and avoid regulatory penalties by mitigating sudden outages and reacting swiftly to disturbances. The integration of advanced technologies, such as energy storage and smart grid systems, can help address these challenges, ensuring a more customer-focused and sustainable energy future.
- According to recent studies, the DER market is projected to grow significantly, with indexed adoption rates increasing by approximately 30% in the past five years. This trend is expected to continue, as the benefits of DER become increasingly apparent.
What challenges does the Advanced Distribution Management System Industry face during its growth?
- The high implementation costs associated with Advanced Distribution Management System (ADMS) deployment represent a significant challenge that can hinder industry growth.
- The advanced distribution management system (ADMS) market is characterized by substantial investment requirements, posing a considerable challenge for businesses seeking to implement these systems. The cost of an ADMS implementation project is influenced by several factors, including the extent of system integration, the desired level of data accuracy, and the required functionalities. A high degree of integration, essential for seamless ADMS operation, increases implementation costs. Additionally, the size of an organization's existing system and the accuracy of its Geographic Information System (GIS) impact the ADMS deployment price.
- Despite these costs, companies recognize the potential benefits of ADMS, such as enhanced distribution operations and productivity improvements. The global ADMS market continues to evolve, with ongoing advancements in technology driving innovation and addressing the cost challenge.
Exclusive Customer Landscape
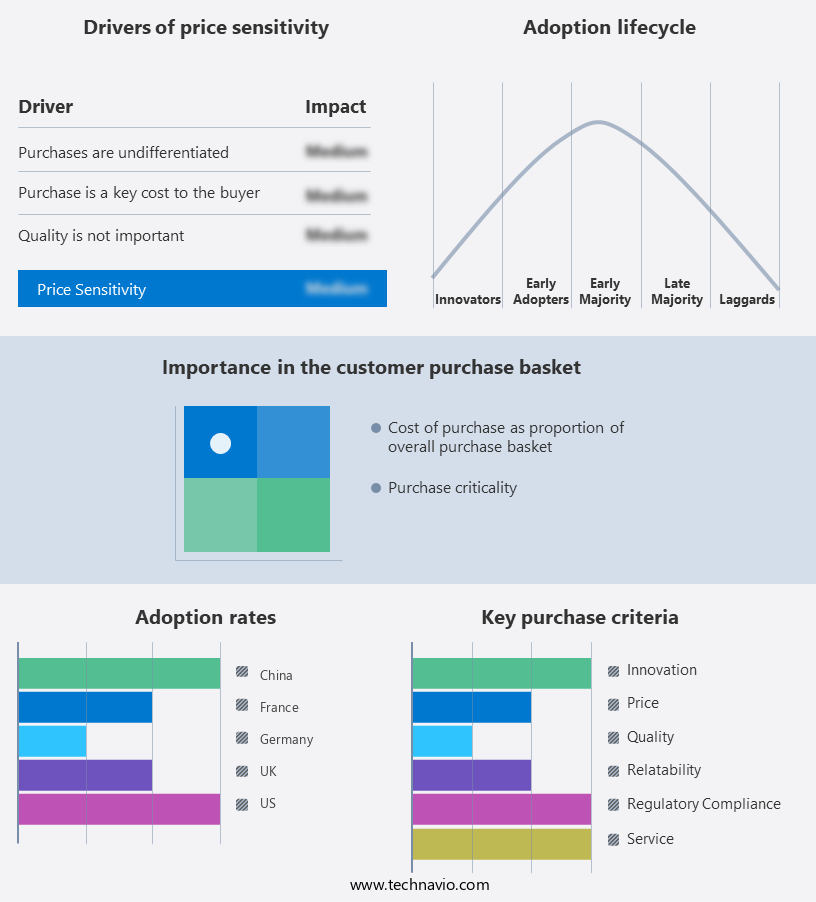
The advanced distribution management system market forecasting report includes the adoption lifecycle of the market, covering from the innovator's stage to the laggard's stage. It focuses on adoption rates in different regions based on penetration. Furthermore, the advanced distribution management system market report also includes key purchase criteria and drivers of price sensitivity to help companies evaluate and develop their market growth analysis strategies.
Customer Landscape of Advanced Distribution Management System Industry
Competitive Landscape & Market Insights
Companies are implementing various strategies, such as strategic alliances, advanced distribution management system market forecast, partnerships, mergers and acquisitions, geographical expansion, and product/service launches, to enhance their presence in the industry.
ABB Ltd. - This company specializes in providing industrial software solutions, focusing on operational excellence, process improvement, asset performance, and cybersecurity. These offerings aim to enhance industrial efficiency and reliability, ensuring optimal performance and security for clients.
The industry research and growth report includes detailed analyses of the competitive landscape of the market and information about key companies, including:
- ABB Ltd.
- Advanced Control Systems LLC
- Capgemini Service SAS
- Cisco Systems Inc.
- Companhia Energetica Minas Gerais
- DNV Group AS
- Emerson Electric Co.
- ETAP Operation Technology Inc.
- General Electric Co.
- GridBright Inc.
- Hexagon AB
- Hubbell Inc.
- International Business Machines Corp.
- Itron Inc.
- Landis Gyr AG
- Oracle Corp.
- Schneider Electric SE
- Survalent Technology Corp.
- Xylem Inc.
Qualitative and quantitative analysis of companies has been conducted to help clients understand the wider business environment as well as the strengths and weaknesses of key industry players. Data is qualitatively analyzed to categorize companies as pure play, category-focused, industry-focused, and diversified; it is quantitatively analyzed to categorize companies as dominant, leading, strong, tentative, and weak.
Recent Development and News in Advanced Distribution Management System Market
- In January 2024, Siemens Energy announced the successful implementation of its Advanced Distribution Management System (ADMS) in the Australian electricity grid, marking a significant expansion into the Asia-Pacific market (Siemens Energy press release, 2024). This system, which optimizes power flow and grid stability, is expected to improve the region's energy efficiency and reliability.
- In March 2024, ABB and Hitachi Energy formed a strategic partnership to jointly develop and market advanced distribution grid solutions, combining ABB's digital solutions with Hitachi Energy's power grid expertise (ABB press release, 2024). This collaboration aims to accelerate the adoption of smart grids and advanced distribution management systems worldwide.
- In May 2024, Itron, a leading technology provider for energy and water utilities, secured a USD100 million investment from Koch Industries to expand its smart grid and advanced metering infrastructure offerings (Bloomberg, 2024). This funding will support the development and deployment of more advanced distribution management systems, enabling utilities to better manage their grids and improve energy efficiency.
- In January 2025, GE Renewable Energy and Grid Solutions received regulatory approval from the Federal Energy Regulatory Commission (FERC) for its Flexible Grid Solutions, a suite of advanced distribution management systems designed to integrate renewable energy sources into the grid (FERC Order, 2025). This approval marks a significant milestone in the adoption of advanced distribution management systems for renewable energy integration.
Dive into Technavio's robust research methodology, blending expert interviews, extensive data synthesis, and validated models for unparalleled Advanced Distribution Management System Market insights. See full methodology.
|
Market Scope |
|
|
Report Coverage |
Details |
|
Page number |
238 |
|
Base year |
2024 |
|
Historic period |
2019-2023 |
|
Forecast period |
2025-2029 |
|
Growth momentum & CAGR |
Accelerate at a CAGR of 23.2% |
|
Market growth 2025-2029 |
USD 3880.9 million |
|
Market structure |
Fragmented |
|
YoY growth 2024-2025(%) |
18.2 |
|
Key countries |
US, Germany, China, UK, Canada, France, India, Japan, Russia, and Spain |
|
Competitive landscape |
Leading Companies, Market Positioning of Companies, Competitive Strategies, and Industry Risks |
Research Analyst Overview
- In today's business landscape, advanced distribution management systems have become essential tools for enhancing supply chain resilience and optimizing logistics operations. These systems encompass a range of technologies and strategies, including order management software, logistics execution systems, warehouse management systems, and distribution center efficiency solutions. One critical aspect of these systems is transportation mode selection, which impacts both on-time delivery rates and shipping cost reduction. By analyzing various transportation options, businesses can optimize their freight consolidation and route planning, ultimately improving their supply chain visibility and delivery time optimization. Another crucial element is warehouse management, with a focus on order accuracy rate, warehouse layout design, inventory optimization, and real-time tracking systems.
- Warehouse automation, such as automated guided vehicles and picking and packing systems, further streamline operations and boost inventory turnover rates. Moreover, demand planning software and supply chain analytics enable businesses to anticipate market trends and adjust stock replenishment strategies accordingly. Route optimization algorithms and last-mile delivery solutions ensure efficient delivery routes and reduce shipping costs. Customer satisfaction metrics, including order fulfillment process and inventory control metrics, are also vital components of advanced distribution management systems. By prioritizing these aspects, businesses can maintain high levels of on-time delivery and order accuracy, ultimately fostering strong customer relationships.
- In the ever-evolving landscape of advanced distribution management systems, continuous innovation is the key to staying competitive. Real-time tracking technologies, such as RFID tracking, provide valuable insights into inventory levels and warehouse operations. Demand forecasting models and supply chain visibility solutions help businesses adapt to market fluctuations and optimize their distribution networks. In summary, advanced distribution management systems offer businesses a comprehensive solution for enhancing supply chain resilience, optimizing logistics operations, and improving customer satisfaction. From transportation mode selection and order management to warehouse automation and inventory optimization, these systems provide valuable insights and tools for navigating the complexities of modern supply chain management.
What are the Key Data Covered in this Advanced Distribution Management System Market Research and Growth Report?
-
What is the expected growth of the Advanced Distribution Management System Market between 2025 and 2029?
-
USD 3.88 billion, at a CAGR of 23.2%
-
-
What segmentation does the market report cover?
-
The report segmented by Component (Software, Analytics, and Services), Deployment (On-premises, Cloud-based, and Hybrid), End-user (Energy and utilities, Manufacturing, IT and telecom, Transportation and logistics, and Others), and Geography (North America, Europe, APAC, South America, and Middle East and Africa)
-
-
Which regions are analyzed in the report?
-
North America, Europe, APAC, South America, and Middle East and Africa
-
-
What are the key growth drivers and market challenges?
-
Growing demand for energy and cost-efficiency, High implementation costs for ADMS deployment
-
-
Who are the major players in the Advanced Distribution Management System Market?
-
Key Companies ABB Ltd., Advanced Control Systems LLC, Capgemini Service SAS, Cisco Systems Inc., Companhia Energetica Minas Gerais, DNV Group AS, Emerson Electric Co., ETAP Operation Technology Inc., General Electric Co., GridBright Inc., Hexagon AB, Hubbell Inc., International Business Machines Corp., Itron Inc., Landis Gyr AG, Oracle Corp., Schneider Electric SE, Survalent Technology Corp., and Xylem Inc.
-
Market Research Insights
- The advanced distribution management system (ADMS) market encompasses a range of solutions designed to optimize order consolidation, logistics cost analysis, inventory planning, demand signal processing, warehouse space utilization, and supply chain collaboration. One key driver of this growth is the increasing emphasis on inventory accuracy and delivery performance. For instance, companies can use ADMS to improve warehouse layout optimization, shipment tracking, and delivery window management, resulting in significant reductions in logistics costs and increased customer satisfaction.
- In contrast, traditional distribution methods may result in higher transportation planning and network capacity planning costs due to inefficient load optimization and lack of real-time supply chain monitoring. By integrating data from various sources, ADMS platforms enable better risk management strategies, carrier selection, transportation efficiency, and transportation scheduling, ultimately leading to improved delivery performance and reduced overall supply chain costs.
We can help! Our analysts can customize this advanced distribution management system market research report to meet your requirements.
 RIA -
RIA - 
