Glass Drinkware Market Analysis, Size, and Forecast 2026-2030: Europe (UK, Germany, and France), APAC (China, India, and Japan), North America (US, Canada, and Mexico), Middle East and Africa (Saudi Arabia, UAE, and South Africa), South America (Brazil, Argentina, and Colombia), and Rest of World (ROW)

Glass Drinkware Market Analysis, Size, and Forecast 2026-2030:
Europe (UK, Germany, and France), APAC (China, India, and Japan), North America (US, Canada, and Mexico), Middle East and Africa (Saudi Arabia, UAE, and South Africa), South America (Brazil, Argentina, and Colombia), and Rest of World (ROW)

Published: May 2026 287 Pages SKU: IRTNTR81254

Market Overview at a Glance

$1.42 B
Market Opportunity
4.1%
CAGR 2025 - 2030
38%
APAC Growth
$1.85 B
Water glasses segment 2024

Glass Drinkware Market Size and Growth Forecast 2026-2030

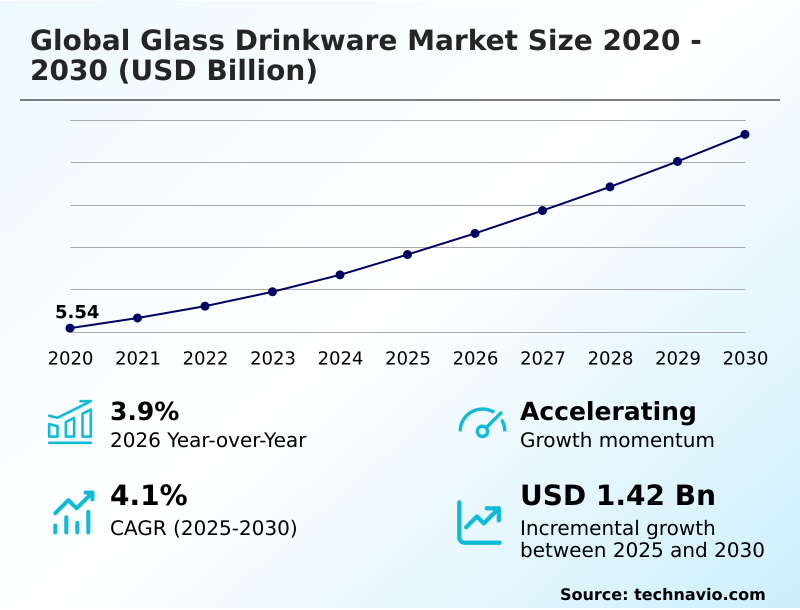
The Glass Drinkware Market size was valued at USD 6.41 billion in 2025 growing at a CAGR of 4.1% during the forecast period 2026-2030.

APAC accounts for 38% of incremental growth during the forecast period. The Water glasses segment by Product was valued at USD 1.85 billion in 2024, while the Residential segment holds the largest revenue share by End-user.

The market is projected to grow by USD 2.29 billion from 2020 to 2030, with USD 1.42 billion of the growth expected during the forecast period of 2025 to 2030.

Get Key Insights on Market Forecast (PDF) Request Free Sample

Glass Drinkware Market Overview

The glass drinkware market is evolving beyond simple container provision, shaped by consumer demands for health, sustainability, and premium aesthetics. A significant driver is the growing health consciousness that questions the chemical inertness of plastics, fueling a migration toward non-porous glass alternatives in the residential sector, which is the largest end-user segment. This trend is complemented by the premiumization of the HoReCa sector, particularly in high-growth regions like APAC, which is projected to account for 38% of incremental growth. Establishments now view high-quality, varietal-specific glassware as essential for enhancing the customer experience. For instance, a high-volume hospitality supplier adopting automated glass pressing for tempered glass tumblers can reduce breakage rates by over 15%, directly improving operational margins. This imperative for material durability, combined with innovations in borosilicate glass and double-wall insulation, allows manufacturers to meet diverse demands for everything from artisanal coffee mugs to resilient barware, positioning glass as a superior material choice.

Drivers, Trends, and Challenges in the Glass Drinkware Market

Navigating the global glass drinkware market requires balancing the pursuit of sustainability in glass packaging with the high melt energy consumption inherent in production, a tension magnified by regulatory frameworks like the EU Energy Efficiency Directive.

The consumer search for the best glass for everyday use is increasingly pointing toward durable materials that minimize replacement frequency, highlighting the benefits of using lead-free crystal for its clarity and resilience.

For example, a specialized manufacturer producing high-end crystal stemware may implement ion-toughening processes, which can more than double the shatter resistance of a thin-rimmed wine glass compared to untreated alternatives—a critical factor for vendor qualification by premium hotel chains. This focus on durability also governs the selection of durable tumbler glasses for restaurants.

The technical differences between soda-lime glass vs borosilicate temperature range dictate their suitability as glassware for hot and cold drinks, directly impacting consumer choice. Ultimately, as the glass vs plastic drinkware health debate intensifies, the eco-friendly glass water bottle benefits and the inherent purity of the material position it favorably.

The impact of glass clarity on beverage presentation remains a key differentiator, especially for premium wines and spirits, solidifying its place in high-value applications.

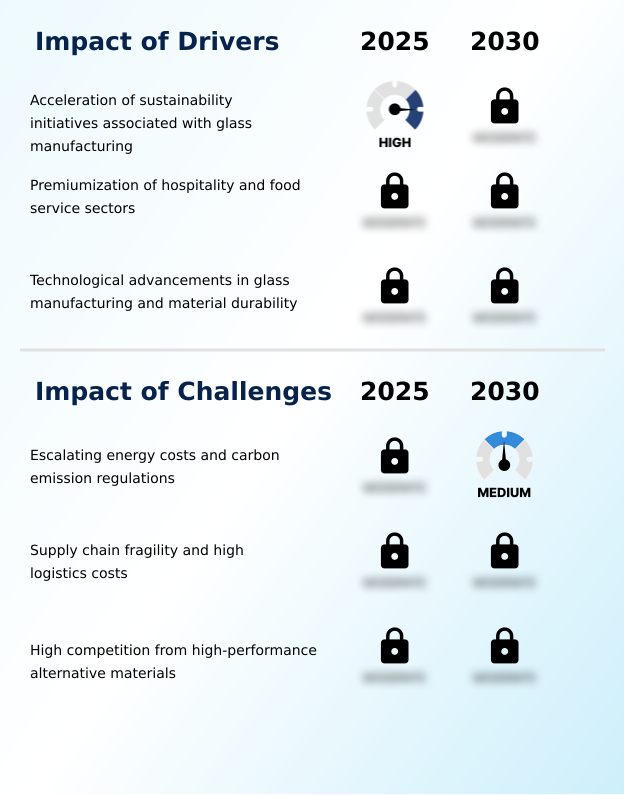
Primary Growth Driver: The acceleration of sustainability initiatives associated with glass manufacturing is a key driver for market growth.

A primary market driver is the global sustainability movement, compelling a shift from single-use plastics to glass, which is valued for its chemical inertness and infinite recyclability.

This is reinforced by the premiumization of the HoReCa sector, especially in high-growth regions like APAC, which is projected to contribute 38% of market growth. Hotels and restaurants are increasingly investing in premium hospitality glassware to enhance customer experience.

Furthermore, technological advancements in manufacturing are expanding market applications. Innovations in tempered glass and borosilicate glass enhance material durability and reduce consumer concerns about fragility, making aesthetic drinkware design more accessible.

Techniques like glass pressing and the craftsmanship of hand-blown glass cater to both mass-market and luxury segments, supporting overall market expansion.

Emerging Market Trend: The expansion of the circular economy within glass manufacturing is an influential market trend. This movement prioritizes sustainability through increased recycling and the adoption of eco-friendly production methods.

The market is shaped by a dual focus on sustainability and premiumization. A dominant trend is the rise of experiential home entertainment, which fuels demand for specialty cocktail glassware and varietal-specific glassware with features like ribbed textures. This is particularly evident in the residential sector, which constitutes the market's largest segment.

Simultaneously, health consciousness is accelerating the shift toward borosilicate glass, prized for its purity and superior thermal shock resistance. On the manufacturing front, the circular economy is driving process innovation, with an increased use of cullet in furnaces and a strategic move toward lightweighting in machine-formed glass to reduce carbon footprints in compliance with global ESG standards.

Key Industry Challenge: Escalating energy costs and stringent carbon emission regulations present a key challenge affecting industry growth.

The glass drinkware market confronts significant hurdles, led by high melt energy consumption and volatile energy pricing, which are intensified by carbon pricing frameworks like the EU ETS. These operational costs challenge profit margins. Additionally, the industry grapples with supply chain fragility and high logistics costs associated with transporting heavy, breakable products, which complicates e-commerce fulfillment.

A formidable challenge is the competition from alternative materials. High-performance stainless steel and advanced polymers offer superior durability and insulation for the on-the-go beverage market, compelling glass manufacturers to innovate in areas like shatter-resistant technology and lightweighting to defend their market share. This pressure necessitates a continuous focus on carbon footprint reduction to maintain a competitive advantage.

Explore Full Market Dynamics Analysis Request Free Sample

Glass Drinkware Market Segmentation

The glass drinkware industry research report provides comprehensive data including region-wise segment analysis, with forecasts and analysis for the period 2026-2030, as well as historical data from 2020-2024 for the following segments.

Market Segment by Product
  • Water glasses
  • Tumbler
  • Wine and champagne glasses
  • Beer glasses and mugs
  • Others
Market Segment by End-user
  • Residential
  • Commercial
Market Segment by Distribution channel
  • Offline
  • Online
Market Segment by Geography
Europe
UK, Germany, France, Italy, Spain, The Netherlands
APAC
China, India, Japan, South Korea, Australia, Indonesia
North America
US, Canada, Mexico
Middle East and Africa
Saudi Arabia, UAE, South Africa, Israel, Turkey
South America
Brazil, Argentina, Colombia

Product Segment Analysis

The water glasses segment is estimated to witness significant growth during the forecast period.

The water glasses segment is foundational to the glass drinkware market, driven by a definitive consumer shift away from single-use plastics toward sustainable hydration solutions.

In both the residential and commercial sectors, demand extends beyond utility to include aesthetic and ergonomic considerations. Manufacturers are responding with designs featuring reinforced rims and weighted bases to improve material durability, often using tempered soda-lime glass for mass-market applications.

Concurrently, the adoption of borosilicate glass is increasing due to its superior thermal shock resistance, allowing for versatile use with both hot and cold beverages.

In the hospitality sector, which represents a significant portion of commercial end-users, premium water glasses are now integral to the dining experience, influencing procurement decisions beyond mere cost.

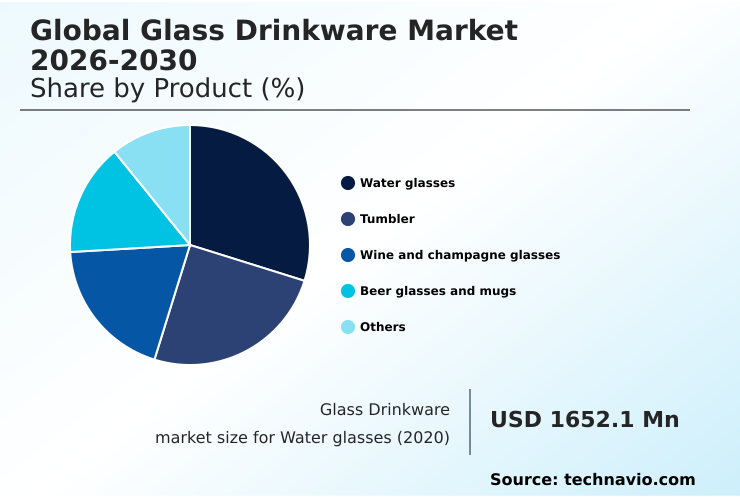
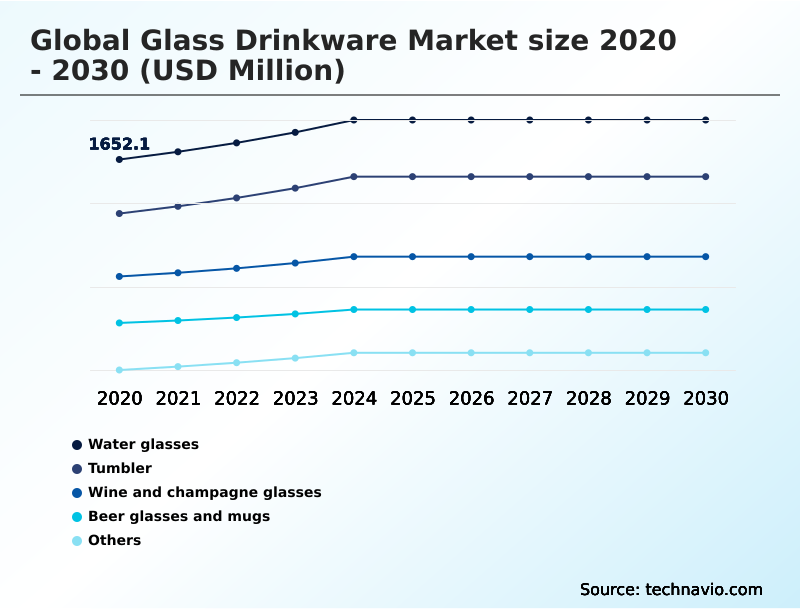
The Water glasses segment was valued at USD 1.85 billion in 2024 and showed a gradual increase during the forecast period.

Glass Drinkware Market by Region: APAC Leads with 38% Growth Share

APAC is estimated to contribute 38% to the growth of the global market during the forecast period.

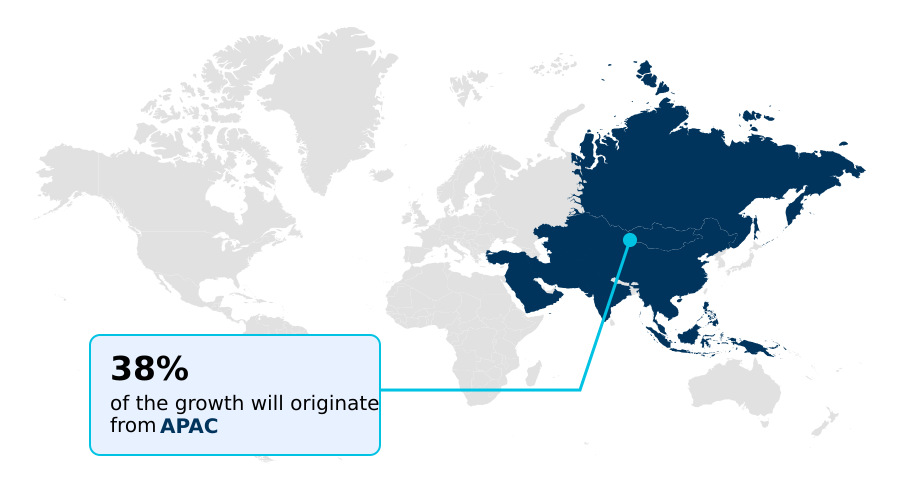
Geographically, the glass drinkware market's growth is led by APAC, which is poised to contribute approximately 38% of the incremental growth, driven by rising disposable incomes and rapid urbanization in countries like China and India.

This contrasts with the mature European market, which accounts for over 27% of the global landscape.

In Europe, growth is sustained by a strong HoReCa sector and stringent environmental regulations like the EU ETS, which promote a circular economy through the use of cullet and lightweighting in production.

North America, contributing around 21%, is characterized by a demand for premium, lead-free crystal and borosilicate glass products fueled by home entertainment and wellness trends.

Across these regions, the choice between mass-produced soda-lime glass and high-end specialty materials defines regional competitive dynamics and supply chain strategies.

Customer Landscape Analysis for the Glass Drinkware Market

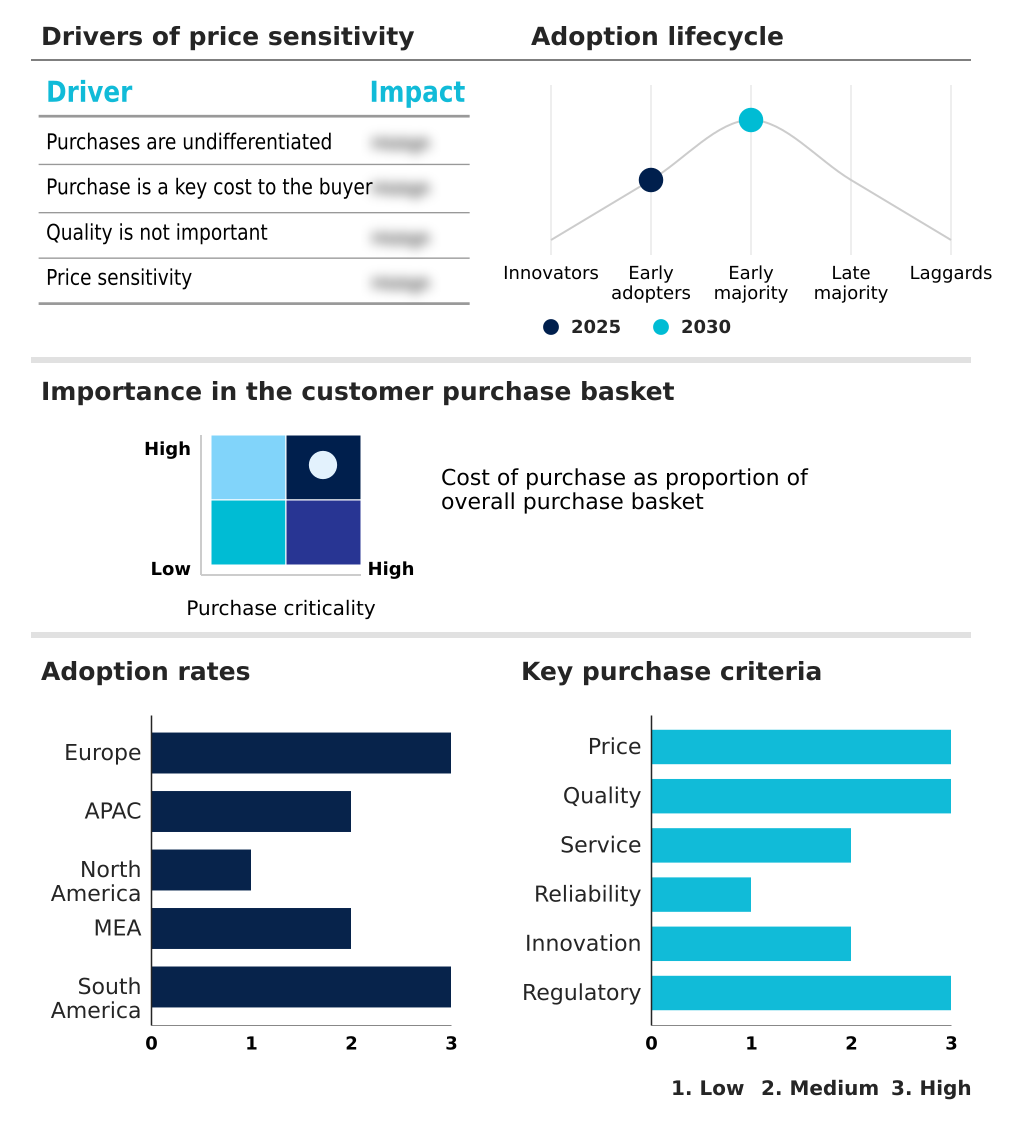
The glass drinkware market forecasting report includes the adoption lifecycle of the market, covering from the innovator’s stage to the laggard’s stage. It focuses on adoption rates in different regions based on penetration. Furthermore, the glass drinkware market report also includes key purchase criteria and drivers of price sensitivity to help companies evaluate and develop their market growth analysis strategies.

Competitive Landscape of the Glass Drinkware Market

Companies are implementing various strategies, such as strategic alliances, partnerships, mergers and acquisitions, geographical expansion, and product/service launches, to enhance their presence in the glass drinkware market industry.

Arc Holdings - Specializing in mass-market tempered glass tableware, the company provides durable drinkware solutions for both residential and professional food service applications, emphasizing functional design and accessibility.

The industry research and growth report includes detailed analyses of the competitive landscape of the market and information about key companies, including:

  • Arc Holdings
  • Baccarat
  • Bayerische Glaswerke GmbH
  • Bormioli Rocco Spa
  • Borosil Ltd.
  • Krosno Glass SA
  • Luigi Bormioli
  • Ocean Glass Public Company Limited
  • Pasabahce
  • Simon Pearce
  • Spiegelau
  • Steklarna Hrastnik
  • Stoelzle Oberglas GmbH
  • Tiroler Glashutte GmbH
  • Waterford
  • ZALTO Glas GMBH
  • Zwiesel Kristallglas AG

Qualitative and quantitative analysis of companies has been conducted to help clients understand the wider business environment as well as the strengths and weaknesses of key industry players. Data is qualitatively analyzed to categorize companies as pure play, category-focused, industry-focused, and diversified; it is quantitatively analyzed to categorize companies as dominant, leading, strong, tentative, and weak.

Recent Developments in the Glass Drinkware Market

  • In November 2024, Verallia initiated a strategic partnership to pilot and commercialize LionGlass, a novel aluminosilicophosphate material developed by researchers at Penn State University, aiming to reduce melt energy consumption by approximately 30%.
  • In March 2025, Libbey Inc. announced a strategic optimization of its logistics network across the APAC region, designed to enhance service for emerging markets and address growing local demand more efficiently.
  • In May 2025, New York-based supplier Starline entered into a strategic partnership with Symglass, a move intended to broaden its product portfolio with promotional drinkware and expand market access for both entities.
  • In September 2024, INSCO completed its acquisition of India-based Hindustan National Glass and Industries Ltd. (HNGIL) through the Insolvency and Bankruptcy Code (IBC) process, significantly consolidating the regional glass manufacturing sector.

Research Analyst Overview: Glass Drinkware Market

High melt energy consumption in glass manufacturing is a primary operational reality, creating significant cost pressures and compliance challenges under regulations such as the EU Emissions Trading System (EU ETS). This forces boardroom-level decisions regarding the high CAPEX for technologies like hydrogen-powered furnaces or electric boosting systems versus the long-term risk of carbon-related financial penalties.

This strategic calculus directly influences material science investments, including the development of aluminosilicophosphate glass, which offers lower melting points. The choice of material dictates product portfolio capabilities, from mass-market soda-lime glass produced via glass pressing to premium hand-blown, lead-free crystal. Innovations such as nucleated glass technology for beer glasses and double-wall insulation for coffee mugs serve as critical differentiators.

In Europe, which accounts for over 27% of the global market, mastering these advanced manufacturing techniques, including glass blowing and ion-toughening, is essential for maintaining a competitive edge and meeting demand for varietal-specific glassware with high thermal shock resistance.

Dive into Technavio’s robust research methodology, blending expert interviews, extensive data synthesis, and validated models for unparalleled Glass Drinkware Market insights. See full methodology.

Request Free Sample

Market Scope
Page number 287
Base year 2025
Historic period 2020-2024
Forecast period 2026-2030
Growth momentum & CAGR Accelerate at a CAGR of 4.1%
Market growth 2026-2030 USD 1420.1 million
Market structure Fragmented
YoY growth 2025-2026(%) 3.9%
Key countries UK, Germany, France, Italy, Spain, The Netherlands, China, India, Japan, South Korea, Australia, Indonesia, US, Canada, Mexico, Saudi Arabia, UAE, South Africa, Israel, Turkey, Brazil, Argentina and Colombia
Competitive landscape Leading Companies, Market Positioning of Companies, Competitive Strategies, and Industry Risks

Glass Drinkware Market: Key Questions Answered in This Report

  • What is the expected growth of the Glass Drinkware Market between 2026 and 2030?

    • The Glass Drinkware Market is expected to grow by USD 1.42 billion during 2026-2030, registering a CAGR of 4.1%. Year-over-year growth in 2026 is estimated at 3.9%%. This acceleration is shaped by acceleration of sustainability initiatives associated with glass manufacturing, which is intensifying demand across multiple end-use verticals covered in the report.

  • What segmentation does the market report cover?

    • The report is segmented by Product (Water glasses, Tumbler, Wine and champagne glasses, Beer glasses and mugs, and Others), End-user (Residential, and Commercial), Distribution Channel (Offline, and Online) and Geography (Europe, APAC, North America, Middle East and Africa, South America). Among these, the Water glasses segment is estimated to witness significant growth during the forecast period, driven by rising adoption across key application areas. Each segment includes detailed qualitative and quantitative analysis, along with historical data from 2020-2024 and forecasts through 2030 with year-over-year growth rates.

  • Which regions are analyzed in the report?

    • The report covers Europe, APAC, North America, Middle East and Africa and South America. APAC is estimated to contribute 38% to market growth during the forecast period. Country-level analysis includes UK, Germany, France, Italy, Spain, The Netherlands, China, India, Japan, South Korea, Australia, Indonesia, US, Canada, Mexico, Saudi Arabia, UAE, South Africa, Israel, Turkey, Brazil, Argentina and Colombia, with dedicated market size tables and year-over-year growth for each.

  • What are the key growth drivers and market challenges?

    • The primary driver is acceleration of sustainability initiatives associated with glass manufacturing, which is accelerating investment and industry demand. The main challenge is escalating energy costs and carbon emission regulations, creating operational barriers for key market participants. The report quantifies the impact of each driver and challenge across 2026 and 2030 with comparative analysis.

  • Who are the major players in the Glass Drinkware Market?

    • Key vendors include Arc Holdings, Baccarat, Bayerische Glaswerke GmbH, Bormioli Rocco Spa, Borosil Ltd., Krosno Glass SA, Luigi Bormioli, Ocean Glass Public Company Limited, Pasabahce, Simon Pearce, Spiegelau, Steklarna Hrastnik, Stoelzle Oberglas GmbH, Tiroler Glashutte GmbH, Waterford, ZALTO Glas GMBH and Zwiesel Kristallglas AG. The report provides qualitative and quantitative analysis categorizing companies as dominant, leading, strong, tentative, and weak based on their market positioning. Company profiles include business segment analysis, SWOT assessment, key offerings, and recent strategic developments.

Glass Drinkware Market Research Insights

The market dynamics of glass drinkware are defined by a crucial balance between aesthetic drinkware design and the operational need for commercial-grade glassware durability. This is particularly evident in the HoReCa sector, where procurement decisions are increasingly influenced by total cost of ownership rather than initial price.

For example, in high-traffic restaurants, the adoption of stackable, tempered glass tumblers is a key procurement decision, as their break resistance directly impacts replacement budgets. The commercial segment’s demand for resilience contrasts with the residential sector, which, despite being larger by value, has a slower replacement cycle. Strict ESG criteria are also compelling the industry to adopt more sustainable practices.

Innovations like borosilicate coffee and tea mugs and specialty cocktail glassware cater to niche consumer preferences, forcing manufacturers to diversify beyond standard soda-lime glass production.

We can help! Our analysts can customize this glass drinkware market research report to meet your requirements.

Get in touch

1. Executive Summary

1.1 Market overview

Executive Summary - Chart on Market Overview
Executive Summary - Data Table on Market Overview
Executive Summary - Chart on Global Market Characteristics
Executive Summary - Chart on Market by Geography
Executive Summary - Chart on Market Segmentation by Product
Executive Summary - Chart on Market Segmentation by End-user
Executive Summary - Chart on Market Segmentation by Distribution Channel
Executive Summary - Chart on Incremental Growth
Executive Summary - Data Table on Incremental Growth
Executive Summary - Chart on Company Market Positioning

2. Technavio Analysis

2.1 Analysis of price sensitivity, lifecycle, customer purchase basket, adoption rates, and purchase criteria

2.2 Criticality of inputs and Factors of differentiation

Chart on Overview on criticality of inputs and factors of differentiation

2.3 Factors of disruption

Chart on Overview on factors of disruption

2.4 Impact of drivers and challenges

Chart on Impact of drivers and challenges in 2025 and 2030

3. Market Landscape

3.1 Market ecosystem

Chart on Parent Market
Data Table on - Parent Market

3.2 Market characteristics

Chart on Market characteristics analysis

3.3 Value chain analysis

Chart on Value chain analysis

4. Market Sizing

4.1 Market definition

Data Table on Offerings of companies included in the market definition

4.2 Market segment analysis

Market segments

4.3 Market size 2025

4.4 Market outlook: Forecast for 2025-2030

Chart on Global - Market size and forecast 2025-2030 ($ million)
Data Table on Global - Market size and forecast 2025-2030 ($ million)
Chart on Global Market: Year-over-year growth 2025-2030 (%)
Data Table on Global Market: Year-over-year growth 2025-2030 (%)

5. Historic Market Size

5.1 Global Glass Drinkware Market 2020 - 2024

Historic Market Size - Data Table on Global Glass Drinkware Market 2020 - 2024 ($ million)

5.2 Product segment analysis 2020 - 2024

Historic Market Size - Product Segment 2020 - 2024 ($ million)

5.3 End-user segment analysis 2020 - 2024

Historic Market Size - End-user Segment 2020 - 2024 ($ million)

5.4 Distribution Channel segment analysis 2020 - 2024

Historic Market Size - Distribution Channel Segment 2020 - 2024 ($ million)

5.5 Geography segment analysis 2020 - 2024

Historic Market Size - Geography Segment 2020 - 2024 ($ million)

5.6 Country segment analysis 2020 - 2024

Historic Market Size - Country Segment 2020 - 2024 ($ million)

6. Qualitative Analysis

6.1 Impact of AI on the Global Glass Drinkware Market

7. Five Forces Analysis

7.1 Five forces summary

Five forces analysis - Comparison between 2025 and 2030

7.2 Bargaining power of buyers

Bargaining power of buyers - Impact of key factors 2025 and 2030

7.3 Bargaining power of suppliers

Bargaining power of suppliers - Impact of key factors in 2025 and 2030

7.4 Threat of new entrants

Threat of new entrants - Impact of key factors in 2025 and 2030

7.5 Threat of substitutes

Threat of substitutes - Impact of key factors in 2025 and 2030

7.6 Threat of rivalry

Threat of rivalry - Impact of key factors in 2025 and 2030

7.7 Market condition

Chart on Market condition - Five forces 2025 and 2030

8. Market Segmentation by Product

8.1 Market segments

Chart on Product - Market share 2025-2030 (%)
Data Table on Product - Market share 2025-2030 (%)

8.2 Comparison by Product

Chart on Comparison by Product
Data Table on Comparison by Product

8.3 Water glasses - Market size and forecast 2025-2030

Chart on Water glasses - Market size and forecast 2025-2030 ($ million)
Data Table on Water glasses - Market size and forecast 2025-2030 ($ million)
Chart on Water glasses - Year-over-year growth 2025-2030 (%)
Data Table on Water glasses - Year-over-year growth 2025-2030 (%)

8.4 Tumbler - Market size and forecast 2025-2030

Chart on Tumbler - Market size and forecast 2025-2030 ($ million)
Data Table on Tumbler - Market size and forecast 2025-2030 ($ million)
Chart on Tumbler - Year-over-year growth 2025-2030 (%)
Data Table on Tumbler - Year-over-year growth 2025-2030 (%)

8.5 Wine and champagne glasses - Market size and forecast 2025-2030

Chart on Wine and champagne glasses - Market size and forecast 2025-2030 ($ million)
Data Table on Wine and champagne glasses - Market size and forecast 2025-2030 ($ million)
Chart on Wine and champagne glasses - Year-over-year growth 2025-2030 (%)
Data Table on Wine and champagne glasses - Year-over-year growth 2025-2030 (%)

8.6 Beer glasses and mugs - Market size and forecast 2025-2030

Chart on Beer glasses and mugs - Market size and forecast 2025-2030 ($ million)
Data Table on Beer glasses and mugs - Market size and forecast 2025-2030 ($ million)
Chart on Beer glasses and mugs - Year-over-year growth 2025-2030 (%)
Data Table on Beer glasses and mugs - Year-over-year growth 2025-2030 (%)

8.7 Others - Market size and forecast 2025-2030

Chart on Others - Market size and forecast 2025-2030 ($ million)
Data Table on Others - Market size and forecast 2025-2030 ($ million)
Chart on Others - Year-over-year growth 2025-2030 (%)
Data Table on Others - Year-over-year growth 2025-2030 (%)

8.8 Market opportunity by Product

Market opportunity by Product ($ million)
Data Table on Market opportunity by Product ($ million)

9. Market Segmentation by End-user

9.1 Market segments

Chart on End-user - Market share 2025-2030 (%)
Data Table on End-user - Market share 2025-2030 (%)

9.2 Comparison by End-user

Chart on Comparison by End-user
Data Table on Comparison by End-user

9.3 Residential - Market size and forecast 2025-2030

Chart on Residential - Market size and forecast 2025-2030 ($ million)
Data Table on Residential - Market size and forecast 2025-2030 ($ million)
Chart on Residential - Year-over-year growth 2025-2030 (%)
Data Table on Residential - Year-over-year growth 2025-2030 (%)

9.4 Commercial - Market size and forecast 2025-2030

Chart on Commercial - Market size and forecast 2025-2030 ($ million)
Data Table on Commercial - Market size and forecast 2025-2030 ($ million)
Chart on Commercial - Year-over-year growth 2025-2030 (%)
Data Table on Commercial - Year-over-year growth 2025-2030 (%)

9.5 Market opportunity by End-user

Market opportunity by End-user ($ million)
Data Table on Market opportunity by End-user ($ million)

10. Market Segmentation by Distribution Channel

10.1 Market segments

Chart on Distribution Channel - Market share 2025-2030 (%)
Data Table on Distribution Channel - Market share 2025-2030 (%)

10.2 Comparison by Distribution Channel

Chart on Comparison by Distribution Channel
Data Table on Comparison by Distribution Channel

10.3 Offline - Market size and forecast 2025-2030

Chart on Offline - Market size and forecast 2025-2030 ($ million)
Data Table on Offline - Market size and forecast 2025-2030 ($ million)
Chart on Offline - Year-over-year growth 2025-2030 (%)
Data Table on Offline - Year-over-year growth 2025-2030 (%)

10.4 Online - Market size and forecast 2025-2030

Chart on Online - Market size and forecast 2025-2030 ($ million)
Data Table on Online - Market size and forecast 2025-2030 ($ million)
Chart on Online - Year-over-year growth 2025-2030 (%)
Data Table on Online - Year-over-year growth 2025-2030 (%)

10.5 Market opportunity by Distribution Channel

Market opportunity by Distribution Channel ($ million)
Data Table on Market opportunity by Distribution Channel ($ million)

11. Customer Landscape

11.1 Customer landscape overview

Analysis of price sensitivity, lifecycle, customer purchase basket, adoption rates, and purchase criteria

12. Geographic Landscape

12.1 Geographic segmentation

Chart on Market share by geography 2025-2030 (%)
Data Table on Market share by geography 2025-2030 (%)

12.2 Geographic comparison

Chart on Geographic comparison
Data Table on Geographic comparison

12.3 Europe - Market size and forecast 2025-2030

Chart on Europe - Market size and forecast 2025-2030 ($ million)
Data Table on Europe - Market size and forecast 2025-2030 ($ million)
Chart on Europe - Year-over-year growth 2025-2030 (%)
Data Table on Europe - Year-over-year growth 2025-2030 (%)
Chart on Regional Comparison - Europe
Data Table on Regional Comparison - Europe

12.3.1 UK - Market size and forecast 2025-2030

Chart on UK - Market size and forecast 2025-2030 ($ million)
Data Table on UK - Market size and forecast 2025-2030 ($ million)
Chart on UK - Year-over-year growth 2025-2030 (%)
Data Table on UK - Year-over-year growth 2025-2030 (%)

12.3.2 Germany - Market size and forecast 2025-2030

Chart on Germany - Market size and forecast 2025-2030 ($ million)
Data Table on Germany - Market size and forecast 2025-2030 ($ million)
Chart on Germany - Year-over-year growth 2025-2030 (%)
Data Table on Germany - Year-over-year growth 2025-2030 (%)

12.3.3 France - Market size and forecast 2025-2030

Chart on France - Market size and forecast 2025-2030 ($ million)
Data Table on France - Market size and forecast 2025-2030 ($ million)
Chart on France - Year-over-year growth 2025-2030 (%)
Data Table on France - Year-over-year growth 2025-2030 (%)

12.3.4 Italy - Market size and forecast 2025-2030

Chart on Italy - Market size and forecast 2025-2030 ($ million)
Data Table on Italy - Market size and forecast 2025-2030 ($ million)
Chart on Italy - Year-over-year growth 2025-2030 (%)
Data Table on Italy - Year-over-year growth 2025-2030 (%)

12.3.5 Spain - Market size and forecast 2025-2030

Chart on Spain - Market size and forecast 2025-2030 ($ million)
Data Table on Spain - Market size and forecast 2025-2030 ($ million)
Chart on Spain - Year-over-year growth 2025-2030 (%)
Data Table on Spain - Year-over-year growth 2025-2030 (%)

12.3.6 The Netherlands - Market size and forecast 2025-2030

Chart on The Netherlands - Market size and forecast 2025-2030 ($ million)
Data Table on The Netherlands - Market size and forecast 2025-2030 ($ million)
Chart on The Netherlands - Year-over-year growth 2025-2030 (%)
Data Table on The Netherlands - Year-over-year growth 2025-2030 (%)

12.4 APAC - Market size and forecast 2025-2030

Chart on APAC - Market size and forecast 2025-2030 ($ million)
Data Table on APAC - Market size and forecast 2025-2030 ($ million)
Chart on APAC - Year-over-year growth 2025-2030 (%)
Data Table on APAC - Year-over-year growth 2025-2030 (%)
Chart on Regional Comparison - APAC
Data Table on Regional Comparison - APAC

12.4.1 China - Market size and forecast 2025-2030

Chart on China - Market size and forecast 2025-2030 ($ million)
Data Table on China - Market size and forecast 2025-2030 ($ million)
Chart on China - Year-over-year growth 2025-2030 (%)
Data Table on China - Year-over-year growth 2025-2030 (%)

12.4.2 India - Market size and forecast 2025-2030

Chart on India - Market size and forecast 2025-2030 ($ million)
Data Table on India - Market size and forecast 2025-2030 ($ million)
Chart on India - Year-over-year growth 2025-2030 (%)
Data Table on India - Year-over-year growth 2025-2030 (%)

12.4.3 Japan - Market size and forecast 2025-2030

Chart on Japan - Market size and forecast 2025-2030 ($ million)
Data Table on Japan - Market size and forecast 2025-2030 ($ million)
Chart on Japan - Year-over-year growth 2025-2030 (%)
Data Table on Japan - Year-over-year growth 2025-2030 (%)

12.4.4 South Korea - Market size and forecast 2025-2030

Chart on South Korea - Market size and forecast 2025-2030 ($ million)
Data Table on South Korea - Market size and forecast 2025-2030 ($ million)
Chart on South Korea - Year-over-year growth 2025-2030 (%)
Data Table on South Korea - Year-over-year growth 2025-2030 (%)

12.4.5 Australia - Market size and forecast 2025-2030

Chart on Australia - Market size and forecast 2025-2030 ($ million)
Data Table on Australia - Market size and forecast 2025-2030 ($ million)
Chart on Australia - Year-over-year growth 2025-2030 (%)
Data Table on Australia - Year-over-year growth 2025-2030 (%)

12.4.6 Indonesia - Market size and forecast 2025-2030

Chart on Indonesia - Market size and forecast 2025-2030 ($ million)
Data Table on Indonesia - Market size and forecast 2025-2030 ($ million)
Chart on Indonesia - Year-over-year growth 2025-2030 (%)
Data Table on Indonesia - Year-over-year growth 2025-2030 (%)

12.5 North America - Market size and forecast 2025-2030

Chart on North America - Market size and forecast 2025-2030 ($ million)
Data Table on North America - Market size and forecast 2025-2030 ($ million)
Chart on North America - Year-over-year growth 2025-2030 (%)
Data Table on North America - Year-over-year growth 2025-2030 (%)
Chart on Regional Comparison - North America
Data Table on Regional Comparison - North America

12.5.1 US - Market size and forecast 2025-2030

Chart on US - Market size and forecast 2025-2030 ($ million)
Data Table on US - Market size and forecast 2025-2030 ($ million)
Chart on US - Year-over-year growth 2025-2030 (%)
Data Table on US - Year-over-year growth 2025-2030 (%)

12.5.2 Canada - Market size and forecast 2025-2030

Chart on Canada - Market size and forecast 2025-2030 ($ million)
Data Table on Canada - Market size and forecast 2025-2030 ($ million)
Chart on Canada - Year-over-year growth 2025-2030 (%)
Data Table on Canada - Year-over-year growth 2025-2030 (%)

12.5.3 Mexico - Market size and forecast 2025-2030

Chart on Mexico - Market size and forecast 2025-2030 ($ million)
Data Table on Mexico - Market size and forecast 2025-2030 ($ million)
Chart on Mexico - Year-over-year growth 2025-2030 (%)
Data Table on Mexico - Year-over-year growth 2025-2030 (%)

12.6 Middle East and Africa - Market size and forecast 2025-2030

Chart on Middle East and Africa - Market size and forecast 2025-2030 ($ million)
Data Table on Middle East and Africa - Market size and forecast 2025-2030 ($ million)
Chart on Middle East and Africa - Year-over-year growth 2025-2030 (%)
Data Table on Middle East and Africa - Year-over-year growth 2025-2030 (%)
Chart on Regional Comparison - Middle East and Africa
Data Table on Regional Comparison - Middle East and Africa

12.6.1 Saudi Arabia - Market size and forecast 2025-2030

Chart on Saudi Arabia - Market size and forecast 2025-2030 ($ million)
Data Table on Saudi Arabia - Market size and forecast 2025-2030 ($ million)
Chart on Saudi Arabia - Year-over-year growth 2025-2030 (%)
Data Table on Saudi Arabia - Year-over-year growth 2025-2030 (%)

12.6.2 UAE - Market size and forecast 2025-2030

Chart on UAE - Market size and forecast 2025-2030 ($ million)
Data Table on UAE - Market size and forecast 2025-2030 ($ million)
Chart on UAE - Year-over-year growth 2025-2030 (%)
Data Table on UAE - Year-over-year growth 2025-2030 (%)

12.6.3 South Africa - Market size and forecast 2025-2030

Chart on South Africa - Market size and forecast 2025-2030 ($ million)
Data Table on South Africa - Market size and forecast 2025-2030 ($ million)
Chart on South Africa - Year-over-year growth 2025-2030 (%)
Data Table on South Africa - Year-over-year growth 2025-2030 (%)

12.6.4 Israel - Market size and forecast 2025-2030

Chart on Israel - Market size and forecast 2025-2030 ($ million)
Data Table on Israel - Market size and forecast 2025-2030 ($ million)
Chart on Israel - Year-over-year growth 2025-2030 (%)
Data Table on Israel - Year-over-year growth 2025-2030 (%)

12.6.5 Turkey - Market size and forecast 2025-2030

Chart on Turkey - Market size and forecast 2025-2030 ($ million)
Data Table on Turkey - Market size and forecast 2025-2030 ($ million)
Chart on Turkey - Year-over-year growth 2025-2030 (%)
Data Table on Turkey - Year-over-year growth 2025-2030 (%)

12.7 South America - Market size and forecast 2025-2030

Chart on South America - Market size and forecast 2025-2030 ($ million)
Data Table on South America - Market size and forecast 2025-2030 ($ million)
Chart on South America - Year-over-year growth 2025-2030 (%)
Data Table on South America - Year-over-year growth 2025-2030 (%)
Chart on Regional Comparison - South America
Data Table on Regional Comparison - South America

12.7.1 Brazil - Market size and forecast 2025-2030

Chart on Brazil - Market size and forecast 2025-2030 ($ million)
Data Table on Brazil - Market size and forecast 2025-2030 ($ million)
Chart on Brazil - Year-over-year growth 2025-2030 (%)
Data Table on Brazil - Year-over-year growth 2025-2030 (%)

12.7.2 Argentina - Market size and forecast 2025-2030

Chart on Argentina - Market size and forecast 2025-2030 ($ million)
Data Table on Argentina - Market size and forecast 2025-2030 ($ million)
Chart on Argentina - Year-over-year growth 2025-2030 (%)
Data Table on Argentina - Year-over-year growth 2025-2030 (%)

12.7.3 Colombia - Market size and forecast 2025-2030

Chart on Colombia - Market size and forecast 2025-2030 ($ million)
Data Table on Colombia - Market size and forecast 2025-2030 ($ million)
Chart on Colombia - Year-over-year growth 2025-2030 (%)
Data Table on Colombia - Year-over-year growth 2025-2030 (%)

12.8 Market opportunity by geography

Market opportunity by geography ($ million)
Data Tables on Market opportunity by geography ($ million)

13. Drivers, Challenges, and Opportunity

13.1 Market drivers

Acceleration of sustainability initiatives associated with glass manufacturing
Premiumization of hospitality and food service sectors
Technological advancements in glass manufacturing and material durability

13.2 Market challenges

Escalating energy costs and carbon emission regulations
Supply chain fragility and high logistics costs
High competition from high-performance alternative materials

13.3 Impact of drivers and challenges

Impact of drivers and challenges in 2025 and 2030

13.4 Market opportunities

Expansion of circular economy in glass manufacturing
Rise of experiential home entertainment
Health-conscious consumption and shift to borosilicate glass

14. Competitive Landscape

14.1 Overview

14.2

Overview on criticality of inputs and factors of differentiation

14.3 Landscape disruption

Overview on factors of disruption

14.4 Industry risks

Impact of key risks on business

15. Competitive Analysis

15.1 Companies profiled

Companies covered

15.2 Company ranking index

15.3 Market positioning of companies

Matrix on companies position and classification

15.4 Arc Holdings

Arc Holdings - Overview
Arc Holdings - Product / Service
Arc Holdings - Key offerings
SWOT

15.5 Baccarat

Baccarat - Overview
Baccarat - Product / Service
Baccarat - Key offerings
SWOT

15.6 Bayerische Glaswerke GmbH

Bayerische Glaswerke GmbH - Overview
Bayerische Glaswerke GmbH - Product / Service
Bayerische Glaswerke GmbH - Key offerings
SWOT

15.7 Bormioli Rocco Spa

Bormioli Rocco Spa - Overview
Bormioli Rocco Spa - Product / Service
Bormioli Rocco Spa - Key offerings
SWOT

15.8 Borosil Ltd.

Borosil Ltd. - Overview
Borosil Ltd. - Business segments
Borosil Ltd. - Key offerings
Borosil Ltd. - Segment focus
SWOT

15.9 Krosno Glass SA

Krosno Glass SA - Overview
Krosno Glass SA - Product / Service
Krosno Glass SA - Key offerings
SWOT

15.10 Luigi Bormioli

Luigi Bormioli - Overview
Luigi Bormioli - Product / Service
Luigi Bormioli - Key offerings
SWOT

15.11 Ocean Glass Public Company Limited

Ocean Glass Public Company Limited - Overview
Ocean Glass Public Company Limited - Product / Service
Ocean Glass Public Company Limited - Key offerings
SWOT

15.12 Pasabahce

Pasabahce - Overview
Pasabahce - Product / Service
Pasabahce - Key offerings
SWOT

15.13 Simon Pearce

Simon Pearce - Overview
Simon Pearce - Product / Service
Simon Pearce - Key offerings
SWOT

15.14 Steklarna Hrastnik

Steklarna Hrastnik - Overview
Steklarna Hrastnik - Product / Service
Steklarna Hrastnik - Key offerings
SWOT

15.15 Stoelzle Oberglas GmbH

Stoelzle Oberglas GmbH - Overview
Stoelzle Oberglas GmbH - Product / Service
Stoelzle Oberglas GmbH - Key offerings
SWOT

15.16 Tiroler Glashutte GmbH

Tiroler Glashutte GmbH - Overview
Tiroler Glashutte GmbH - Product / Service
Tiroler Glashutte GmbH - Key offerings
SWOT

15.17 Waterford

Waterford - Overview
Waterford - Product / Service
Waterford - Key offerings
SWOT

15.18 Zwiesel Kristallglas AG

Zwiesel Kristallglas AG - Overview
Zwiesel Kristallglas AG - Product / Service
Zwiesel Kristallglas AG - Key offerings
SWOT

16. Appendix

16.1 Scope of the report

Market definition
Objectives
Notes and caveats

16.2 Inclusions and exclusions checklist

Inclusions checklist
Exclusions checklist

16.3 Currency conversion rates for US$

16.4 Research methodology

16.5 Data procurement

Information sources

16.6 Data validation

16.7 Validation techniques employed for market sizing

16.8 Data synthesis

16.9 360 degree market analysis

16.10 List of abbreviations

Research Methodology

Technavio presents a detailed picture of the market by way of study, synthesis, and summation of data from multiple sources. The analysts have presented the various facets of the market with a particular focus on identifying the key industry influencers. The data thus presented is comprehensive, reliable, and the result of extensive research, both primary and secondary.

INFORMATION SOURCES

Primary sources

  • Manufacturers and suppliers
  • Channel partners
  • Industry experts
  • Strategic decision makers

Secondary sources

  • Industry journals and periodicals
  • Government data
  • Financial reports of key industry players
  • Historical data
  • Press releases

DATA ANALYSIS

Data Synthesis

  • Collation of data
  • Estimation of key figures
  • Analysis of derived insights

Data Validation

  • Triangulation with data models
  • Reference against proprietary databases
  • Corroboration with industry experts

REPORT WRITING

Qualitative

  • Market drivers
  • Market challenges
  • Market trends
  • Five forces analysis

Quantitative

  • Market size and forecast
  • Market segmentation
  • Geographical insights
  • Competitive landscape

Interested in this report?

Get your sample now to see our research methodology and insights!

Download Now

Frequently Asked Questions

Glass Drinkware market growth will increase by USD 1420.1 million during 2026-2030.

The Glass Drinkware market is expected to grow at a CAGR of 4.1% during 2026-2030.

Glass Drinkware market is segmented by Product (Water glasses, Tumbler, Wine and champagne glasses, Beer glasses and mugs, Others) End-user (Residential, Commercial) Distribution channel (Offline, Online)

Arc Holdings, Baccarat, Bayerische Glaswerke GmbH, Bormioli Rocco Spa, Borosil Ltd., Krosno Glass SA, Luigi Bormioli, Ocean Glass Public Company Limited, Pasabahce, Simon Pearce, Spiegelau, Steklarna Hrastnik, Stoelzle Oberglas GmbH, Tiroler Glashutte GmbH, Waterford, ZALTO Glas GMBH, Zwiesel Kristallglas AG are a few of the key vendors in the Glass Drinkware market.

APAC will register the highest growth rate of 38% among the other regions. Therefore, the Glass Drinkware market in APAC is expected to garner significant business opportunities for the vendors during the forecast period.

UK, Germany, France, Italy, Spain, The Netherlands, China, India, Japan, South Korea, Australia, Indonesia, US, Canada, Mexico, Saudi Arabia, UAE, South Africa, Israel, Turkey, Brazil, Argentina, Colombia

  • Acceleration of sustainability initiatives associated with glass manufacturing is the driving factor this market.

The Glass Drinkware market vendors should focus on grabbing business opportunities from the Product segment as it accounted for the largest market share in the base year.
RIA - Research AI Assistant
Ask RIA