
Coffee Market Size 2026-2030
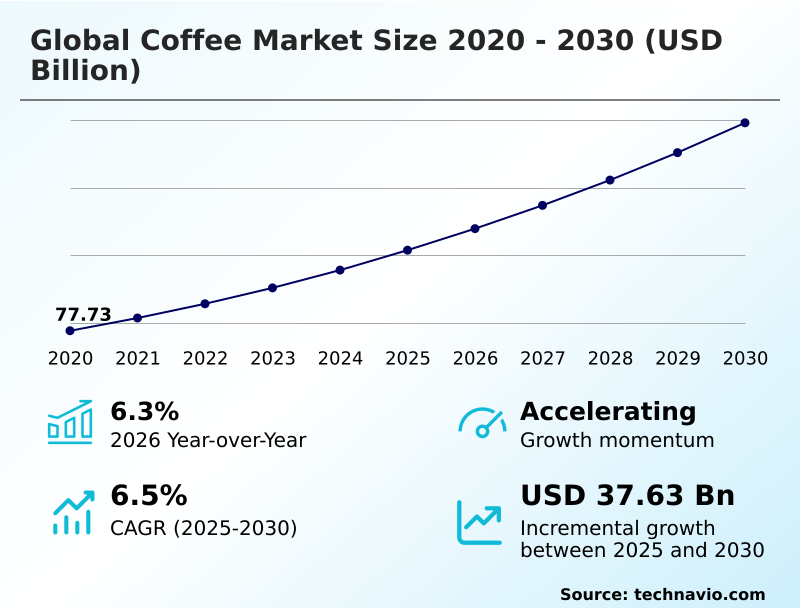
The coffee market size is valued to increase by USD 37.63 billion, at a CAGR of 6.5% from 2025 to 2030. Rising consumer demand for premium and functional coffee experiences will drive the coffee market.
Major Market Trends & Insights
- Europe dominated the market and accounted for a 28.6% growth during the forecast period.
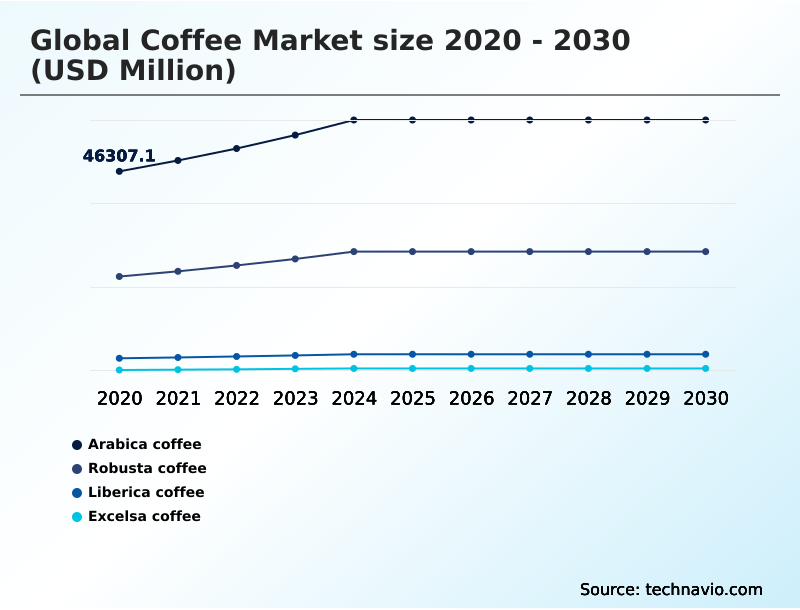
- By Product - Arabica coffee segment was valued at USD 57.56 billion in 2024
- By Application - Food and beverage segment accounted for the largest market revenue share in 2024
Market Size & Forecast
- Market Opportunities: USD 61.44 billion
- Market Future Opportunities: USD 37.63 billion
- CAGR from 2025 to 2030 : 6.5%
Market Summary
- The coffee market is undergoing a significant transformation, moving beyond a commodity-centric model to one defined by premiumization, sustainability, and technological integration. Key drivers include the global expansion of coffee house chains into emerging markets and a discerning consumer base demanding high-quality, ethically sourced products. This fuels innovation in areas such as low-carbon roasting and the development of climate-resilient varieties.
- Trends are shaped by the rise of functional coffee ingredients and the mainstream adoption of cold coffee beverages, reflecting a broader shift toward wellness and convenience. However, the industry grapples with challenges like commodity price volatility and the operational complexities of ensuring supply chain transparency.
- For instance, a global food service provider must leverage advanced traceability systems and geospatial mapping to validate its deforestation-free supply chain.
- This not only ensures compliance with stringent international regulations but also strengthens brand trust by providing consumers with verifiable proof of its commitment to nature-positive supply chains and regenerative agriculture practices, turning a complex operational hurdle into a competitive advantage in a crowded marketplace.
What will be the Size of the Coffee Market during the forecast period?
Get Key Insights on Market Forecast (PDF) Get Free Sample
How is the Coffee Market Segmented?
The coffee industry research report provides comprehensive data (region-wise segment analysis), with forecasts and estimates in "USD million" for the period 2026-2030, as well as historical data from 2020-2024 for the following segments.
- Product
- Arabica coffee
- Robusta coffee
- Liberica coffee
- Excelsa coffee
- Application
- Food and beverage
- Pharmaceuticals
- Cosmetic
- Distribution channel
- B2C
- B2B
- DTC
- Geography
- Europe
- Germany
- Italy
- France
- North America
- US
- Canada
- Mexico
- APAC
- Japan
- China
- Indonesia
- Middle East and Africa
- Saudi Arabia
- Turkey
- UAE
- South America
- Brazil
- Colombia
- Argentina
- Rest of World (ROW)
- Europe
By Product Insights
The arabica coffee segment is estimated to witness significant growth during the forecast period.
The Arabica coffee segment continues to define premiumization, driven by heightened specialty coffee consumption and a focus on high-altitude Arabica beans known for their complex coffee flavor profiles.
The market's health is closely tied to crop yield optimization following recent supply instabilities. A recovery in production, with one key region's harvest increasing by 23%, signals a stabilization for roasted coffee products.
This is critical for the artisan roaster market, which relies on consistent quality validated through rigorous specialty coffee grading and sensory analysis.
Advanced caffeine extraction methods and the potential for byproduct valorization are also influencing innovation, particularly as demand for high-end at-home brewing equipment and differentiated retail coffee products grows, demanding stringent coffee quality control to preserve delicate volatile aromatic compounds.
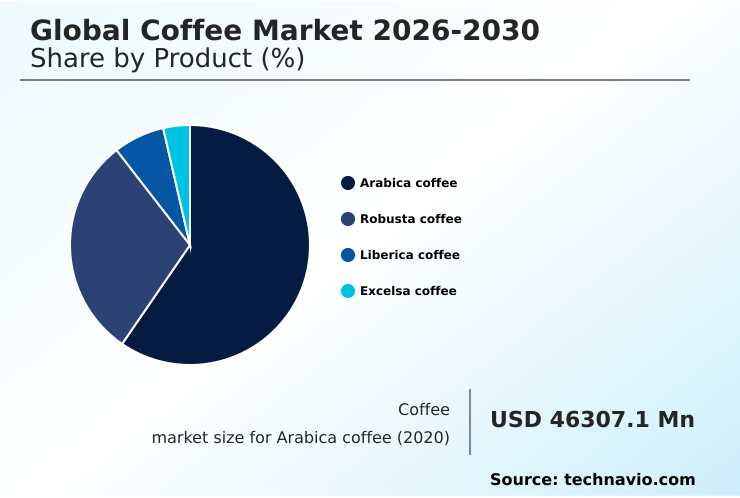
The Arabica coffee segment was valued at USD 57.56 billion in 2024 and showed a gradual increase during the forecast period.
Regional Analysis
Europe is estimated to contribute 28.6% to the growth of the global market during the forecast period.Technavio’s analysts have elaborately explained the regional trends and drivers that shape the market during the forecast period.
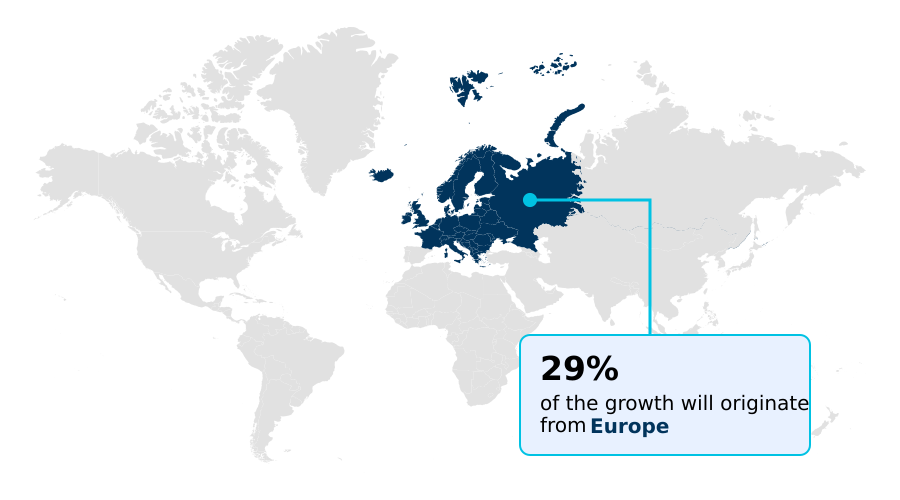
See How Coffee Market Demand is Rising in Europe Get Free Sample
The global landscape is characterized by contrasting dynamics, with mature regions focusing on sustainability while APAC drives growth in out-of-home coffee consumption, posting a growth rate over 2 percentage points higher than Europe.
In North America and Europe, the third-wave coffee movement and strong cafe culture trends push for regenerative agriculture practices and nature-positive supply chains. Here, the artisan roaster market emphasizes water-efficient processing and soil health management.
These regions set stringent quality control standards for green coffee bean processing.
In contrast, emerging markets in APAC are rapidly scaling, supported by coffee subscription models and improving barista training standards to meet burgeoning demand for specialty coffee cherry processing experiences.
Market Dynamics
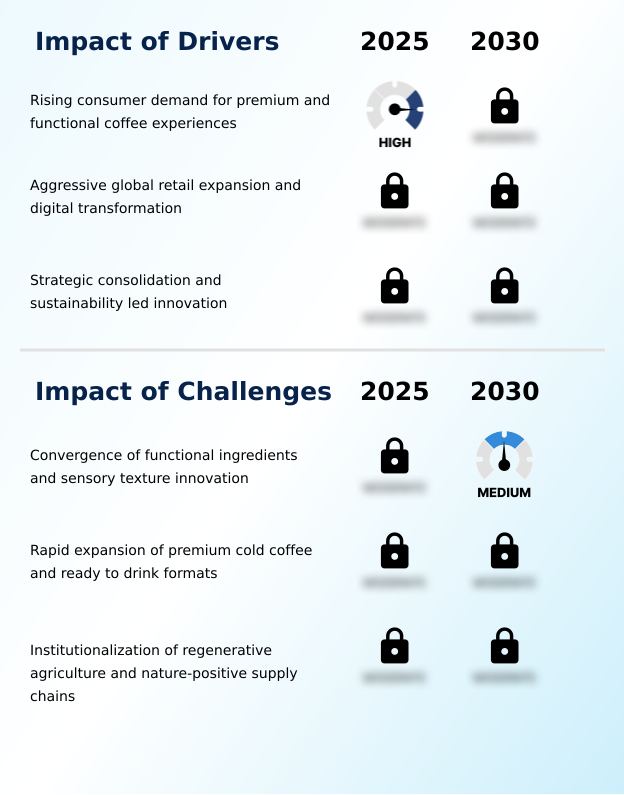
Our researchers analyzed the data with 2025 as the base year, along with the key drivers, trends, and challenges. A holistic analysis of drivers will help companies refine their marketing strategies to gain a competitive advantage.
- Navigating the global coffee market requires a deep understanding of interconnected strategic issues. The persistent impact of climate change on coffee yields directly influences the arabica versus robusta bean quality debate, creating price volatility in the coffee commodity market. This environmental pressure accelerates the need for sustainability practices in coffee farming and highlights the benefits of direct trade coffee.
- In response, consumer trends in specialty coffee are shifting, favoring brands that can demonstrate ethical sourcing and a lower environmental footprint. This is fueling the growth of ready to drink coffee market and the rise of cold brew coffee consumption, as well as the niche but growing role of coffee in the cosmetics industry.
- Technology in modern coffee roasting is evolving to improve efficiency and flavor, while advancements in coffee capsule technology cater to convenience. However, significant challenges in coffee supply chain logistics persist. To navigate the European Union Deforestation Regulation impact, companies are adopting traceability solutions for coffee sourcing.
- Firms utilizing these technologies report compliance validation times up to twice as fast as those using manual methods.
- This highlights how marketing strategies for premium coffee brands, investment in coffee house franchises, and the development of functional coffee for health and wellness are all underpinned by a resilient and transparent supply chain built on regenerative agriculture for coffee crops and efficient water efficiency in coffee processing.
What are the key market drivers leading to the rise in the adoption of Coffee Industry?
- A key market driver is the rising consumer demand for premium and functional coffee experiences that align with evolving lifestyle and wellness trends.
- Rapid global expansion of coffee house chains is a major driver, with some digitally-native brands leveraging digital coffee retail to add over 2,000 stores in a single quarter, fueling revenue growth of over 35%.
- This expansion is underpinned by investments in efficient supply chain logistics and cafe franchise models. Concurrently, sustainable coffee farming has become a core strategic pillar, with ethical sourcing verification and ethical sourcing certification being paramount.
- Major players are implementing low-carbon roasting technologies and embracing circular economy practices to meet carbon footprint reduction goals of over 20%.
- This push extends to food-service coffee solutions and e-commerce coffee sales, where transparent direct-trade sourcing models and bean-to-cup automation appeal to conscious consumers.
What are the market trends shaping the Coffee Industry?
- A prominent market trend is the convergence of functional ingredients with sensory texture innovation. This evolution is transforming traditional beverages into multi-sensory wellness products.
- A primary trend is the evolution toward premium coffee formats that cater to evolving consumer lifestyle trends. This includes the rapid expansion of cold coffee beverages, where techniques like nitrogen infusion technology are creating new textures. The cold beverage category now accounts for over 60% of sales for some leading chains.
- The market for functional coffee ingredients is experiencing growth rates nearly double that of the traditional coffee segment, reflecting a shift toward wellness. This is supported by agronomic research into specialty robusta and other unique beans, with experimental methods like anaerobic fermentation creating novel flavors.
- This innovation extends to at-home formats, with cold brew concentrates and advancements in single-serve coffee pods and instant coffee innovation becoming more sophisticated. Genetic diversity preservation is also emerging as a critical trend, while plant-based milk alternatives have become standard.
What challenges does the Coffee Industry face during its growth?
- A key challenge affecting industry growth is the intensifying impact of environmental volatility on crop yields and bean quality in major producing nations.
- Environmental volatility remains a core challenge, with key growing regions recording over 30 additional extreme-heat days annually, disrupting soil moisture management and the entire coffee value chain. This elevates the need for climate-resilient varieties and improved coffee rust resistance, driving the adoption of precision agriculture and other agronomic best practices. Simultaneously, regulatory pressures intensify the focus on supply chain transparency.
- Compliance with deforestation-free supply chain rules is projected to increase administrative costs by up to 10% for importers without automated traceability systems and geospatial mapping capabilities. These factors, combined with persistent commodity price volatility in the global coffee trade, force companies to refine their risk management and coffee processing methods.
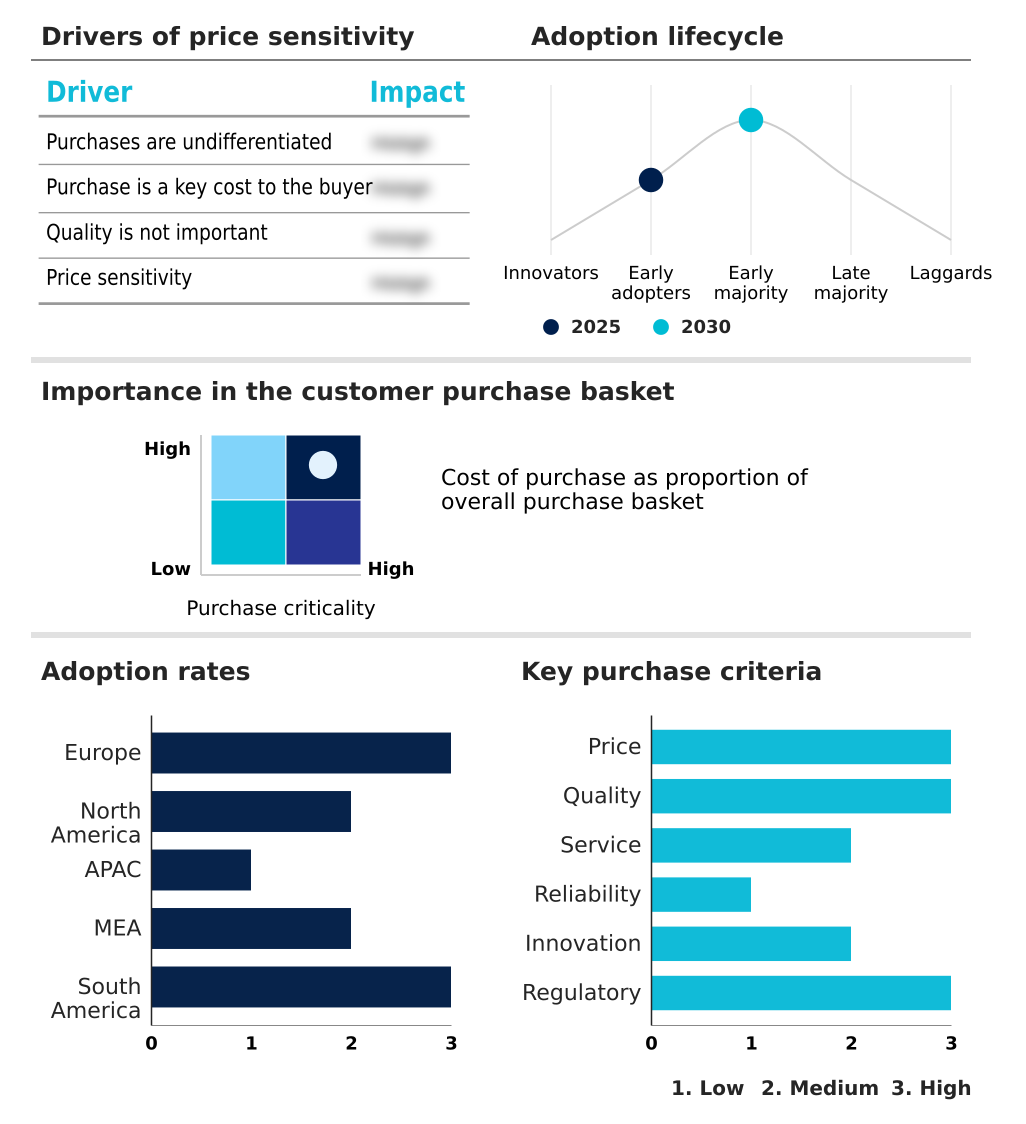
Exclusive Technavio Analysis on Customer Landscape
The coffee market forecasting report includes the adoption lifecycle of the market, covering from the innovator’s stage to the laggard’s stage. It focuses on adoption rates in different regions based on penetration. Furthermore, the coffee market report also includes key purchase criteria and drivers of price sensitivity to help companies evaluate and develop their market growth analysis strategies.
Customer Landscape of Coffee Industry
Competitive Landscape
Companies are implementing various strategies, such as strategic alliances, coffee market forecast, partnerships, mergers and acquisitions, geographical expansion, and product/service launches, to enhance their presence in the industry.
Blue Bottle Coffee Inc. - Provides a comprehensive portfolio of coffee products and beverage solutions across retail, food service, and direct-to-consumer channels to meet diverse consumer preferences and occasions.
The industry research and growth report includes detailed analyses of the competitive landscape of the market and information about key companies, including:
- Blue Bottle Coffee Inc.
- Caffe Nero Group Ltd.
- Costa Ltd.
- Dutch Mafia LLC
- illycaffe SpA
- JDE Peets NV
- Keurig Dr Pepper Inc.
- Luckin Coffee Inc.
- Luigi Lavazza SpA
- McDonald Corp.
- Melitta Group
- Nestle SA
- Peets Coffee Inc.
- Starbucks Corp.
- Tata Consumer Products Ltd.
- Tchibo GmbH
- The Coca Cola Co.
- The J.M. Smucker Co.
- The Kraft Heinz Co.
- Tim Hortons USA Inc.
Qualitative and quantitative analysis of companies has been conducted to help clients understand the wider business environment as well as the strengths and weaknesses of key industry players. Data is qualitatively analyzed to categorize companies as pure play, category-focused, industry-focused, and diversified; it is quantitatively analyzed to categorize companies as dominant, leading, strong, tentative, and weak.
Recent Development and News in Coffee market
- In September 2024, Nestle launched its Nescafe Ready-to-Drink line under the 'Bikeifi' campaign across Egypt, Saudi Arabia, and Iraq to capture growing demand for portable beverage solutions.
- In March 2025, JDE Peet's announced its comprehensive Nature Transition Plan, a science-based roadmap designed to protect ecosystems, expand regenerative coffee farming, and strengthen farmer resilience.
- In April 2025, Nestle introduced its Nescafe Espresso Concentrated product line in European markets, offering a versatile base for at-home specialty beverages in flavors like vanilla and caramel.
- In April 2025, Lavazza launched its innovative Tabli capsule system in Europe, featuring a 100% coffee-based capsule design to eliminate traditional packaging waste and align with circular economy goals.
Dive into Technavio’s robust research methodology, blending expert interviews, extensive data synthesis, and validated models for unparalleled Coffee Market insights. See full methodology.
| Market Scope | |
|---|---|
| Page number | 302 |
| Base year | 2025 |
| Historic period | 2020-2024 |
| Forecast period | 2026-2030 |
| Growth momentum & CAGR | Accelerate at a CAGR of 6.5% |
| Market growth 2026-2030 | USD 37634.5 million |
| Market structure | Fragmented |
| YoY growth 2025-2026(%) | 6.3% |
| Key countries | Germany, Italy, France, UK, Spain, Russia, US, Canada, Mexico, Japan, China, Indonesia, India, Vietnam, Philippines, Ethiopia, Saudi Arabia, Turkey, UAE, South Africa, Brazil, Colombia and Argentina |
| Competitive landscape | Leading Companies, Market Positioning of Companies, Competitive Strategies, and Industry Risks |
Research Analyst Overview
- The coffee market is evolving through intense technological and sustainable pressures, demanding sophisticated operational strategies. The emphasis on nature-positive supply chains is driving investment in regenerative agriculture practices and advanced agronomic research for climate-resilient varieties. Boardroom decisions now center on integrating traceability systems for ethical sourcing verification and ensuring a deforestation-free supply chain to mitigate regulatory risk.
- This involves the use of geospatial mapping for soil health management and precision agriculture for crop yield optimization. Innovations in green coffee bean processing, including water-efficient processing and anaerobic fermentation, are becoming critical differentiators. For roasted coffee products, low-carbon roasting and other carbon footprint reduction initiatives reflect a commitment to circular economy practices.
- At the consumer level, the third-wave coffee movement has elevated standards for sensory analysis of volatile aromatic compounds, pushing the industry toward high-altitude arabica and specialty robusta. This premiumization is supported by bean-to-cup automation, advanced caffeine extraction methods, and a focus on byproduct valorization.
- Firms are finding that investment in these technologies, which also address soil moisture management and coffee rust resistance, can improve resource efficiency by over 15%, linking sustainability directly to operational performance and quality control standards across all supply chain logistics.
What are the Key Data Covered in this Coffee Market Research and Growth Report?
-
What is the expected growth of the Coffee Market between 2026 and 2030?
-
USD 37.63 billion, at a CAGR of 6.5%
-
-
What segmentation does the market report cover?
-
The report is segmented by Product (Arabica coffee, Robusta coffee, Liberica coffee, and Excelsa coffee), Application (Food and beverage, Pharmaceuticals, and Cosmetic), Distribution Channel (B2C, B2B, and DTC) and Geography (Europe, North America, APAC, Middle East and Africa, South America)
-
-
Which regions are analyzed in the report?
-
Europe, North America, APAC, Middle East and Africa and South America
-
-
What are the key growth drivers and market challenges?
-
Rising consumer demand for premium and functional coffee experiences, Convergence of functional ingredients and sensory texture innovation
-
-
Who are the major players in the Coffee Market?
-
Blue Bottle Coffee Inc., Caffe Nero Group Ltd., Costa Ltd., Dutch Mafia LLC, illycaffe SpA, JDE Peets NV, Keurig Dr Pepper Inc., Luckin Coffee Inc., Luigi Lavazza SpA, McDonald Corp., Melitta Group, Nestle SA, Peets Coffee Inc., Starbucks Corp., Tata Consumer Products Ltd., Tchibo GmbH, The Coca Cola Co., The J.M. Smucker Co., The Kraft Heinz Co. and Tim Hortons USA Inc.
-
Market Research Insights
- The market's momentum is shaped by the aggressive expansion of coffee house chains and the deepening of digital coffee retail. Leading digitally-native brands have demonstrated revenue growth exceeding 30% by rapidly expanding their physical and digital footprints, capitalizing on evolving consumer lifestyle trends.
- This growth is mirrored by a strong focus on sustainable coffee farming, as major operators achieve up to a 25% reduction in manufacturing emissions through investments in clean technology. The shift toward premium coffee formats is evident in both out-of-home coffee consumption and at-home brewing, where coffee subscription models are gaining traction.
- This dynamic environment compels players to innovate across the entire coffee value chain, from ethical sourcing certification to creating compelling cafe culture trends to capture and retain a discerning customer base.
We can help! Our analysts can customize this coffee market research report to meet your requirements.
 RIA -
RIA - 
