
Glass Lens Market Size 2025-2029
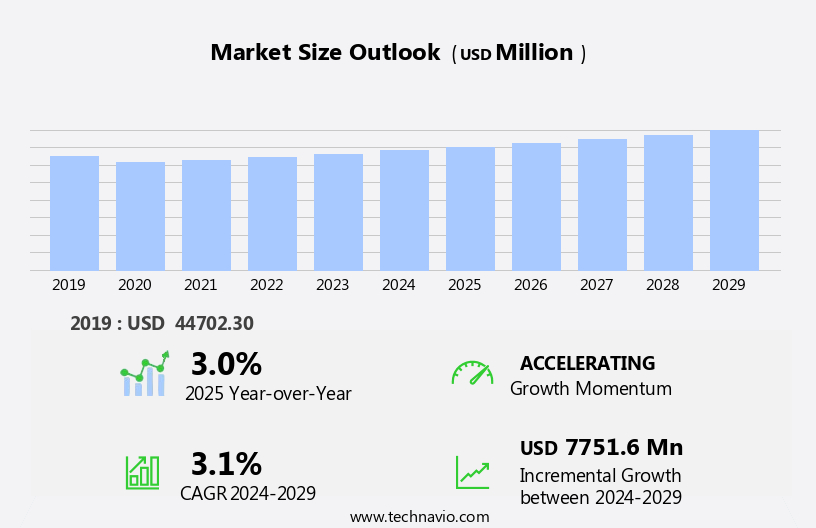
The glass lens market size is forecast to increase by USD 7.75 billion at a CAGR of 3.1% between 2024 and 2029.
- The market is poised for significant growth, driven by the increasing elderly population and the availability of products through online distribution channels. The aging demographic is a key market driver, as the demand for corrective eyewear solutions increases with age. Moreover, the convenience of purchasing glass lenses from an e-commerce platform has expanded accessibility and convenience, fueling market expansion. However, the market faces production challenges that temper growth potential. Glass lens manufacturing involves complex processes and high production costs, which can limit the industry's ability to meet increasing demand.
- Furthermore, regulatory hurdles impact adoption, as stringent regulations governing the production and distribution of glass lenses add complexity to the market landscape. These lenses cater to various consumer needs, including eye comfort during prolonged screen time and enhanced visual clarity in different lighting conditions. Companies seeking to capitalize on market opportunities must navigate these challenges effectively by investing in research and development to improve production processes and collaborating with regulatory bodies to ensure compliance.
What will be the Size of the Glass Lens Market during the forecast period?
- The market in the US is experiencing significant growth due to the increasing prevalence of refractive errors, such as myopia and presbyopia, among children and the aging population. According to the World Health Organization, approximately 2.2 billion people worldwide have a refractive error, making vision correction a necessity. In response, the market offers various solutions, including bifocal lenses, contact lenses, and prescription glasses. High-index plastics and durable materials, such as polycarbonates and high-quality spectacle lenses, ensure both functionality and comfort for users. Moreover, advancements in technology have led to the development of visually appealing lenses, including photochromic lenses that adapt to light conditions and anti-reflective coatings that reduce glare from computers and laptops.
- The rise of e-commerce platforms and online retailers has made these products more accessible to consumers, including those with diabetes, who may require scratch-resistant coatings to prevent damage from their condition's complications, such as diabetic retinopathy. Healthcare policies and increasing awareness of eye disorders, including vision loss caused by prolonged screen time, have also driven market growth. The market caters to various consumer preferences, offering a range of options from low-cost manufacturers to fashion eyewear and progressive lenses. UV ray protection is another essential feature, as prolonged exposure can lead to eye damage. Additionally, magnifying glasses and other vision correction devices are gaining popularity among those with age-related eye disorders. Additionally, the rise of refractive surgery as a viable alternative to glasses and contact lenses may impact the market's growth.
How is this Glass Lens Industry segmented?
The glass lens industry research report provides comprehensive data (region-wise segment analysis), with forecasts and estimates in "USD million" for the period 2025-2029, as well as historical data from 2019-2023 for the following segments.
- Type
- Single glass vision lenses
- Progressive glass lenses
- Bifocal glass lenses
- Distribution Channel
- Offline
- Online
- Product Type
- Anti-reflective
- Blue light reduction
- Scratch-resistant
- UV protection
- Geography
- North America
- US
- Canada
- Europe
- France
- Germany
- UK
- APAC
- Australia
- China
- India
- Japan
- South Korea
- Rest of World (ROW)
- North America
By Type Insights
The single glass vision lenses segment is estimated to witness significant growth during the forecast period.
The market encompasses various types of lenses used for correcting vision impairments and enhancing visual experience. Single vision lenses, which offer correction for one field of vision, are commonly prescribed. These lenses, which can correct for distance, near, or intermediate vision, have the same optical focal point across the entire lens surface. An aging population and increasing prevalence of optical disorders, such as myopia, hyperopia, astigmatism, and presbyopia, fuel the demand for vision care products. Public health campaigns emphasize the importance of regular eye exams and the use of protective eyewear, including prescription glasses, contact lenses, and sunglasses, to prevent vision-related problems.
Advancements in coating technologies, such as scratch-resistant, anti-reflective, and anti-fog coatings, increase the durability and functionality of lenses. Additionally, the integration of artificial intelligence and machine learning in the design and production of lenses enhances precision and customization. Three-dimensional printing and high-index plastics enable the creation of lightweight, visually appealing lenses for fashion eyewear and prescription glasses. The rise of e-commerce platforms and online retailers facilitates the accessibility of these products. However, the market also faces competition from low-cost manufacturers. Vision care extends beyond corrective lenses, with the use of telescopes, microscopes, and magnifying glasses for specific applications.
Additionally, refractive surgery procedures, such as LASIK and PRK, offer alternatives to traditional lens-based solutions. The World Health Organization reports that over 2.2 billion people worldwide have a refractive error, making corrective lenses essential for maintaining optimal visual health. Diabetes, an increasingly common health condition, can lead to diabetic retinopathy, emphasizing the importance of regular patient visits and health insurance policies. The integration of blue light reduction technology in lenses addresses the growing concern of digital eye strain caused by extended screen time, particularly from laptops and computers. UV protection is another critical feature, as prolonged exposure to light rays can lead to vision loss and cataracts.
In summary, the market is driven by the growing need for vision correction and protection, advancements in coating technologies, and the increasing prevalence of optical disorders. The market caters to various applications, from single vision lenses for computer use to specialized lenses for telescopes and microscopes. The integration of technology and customization enhances the functionality and accessibility of these essential products.
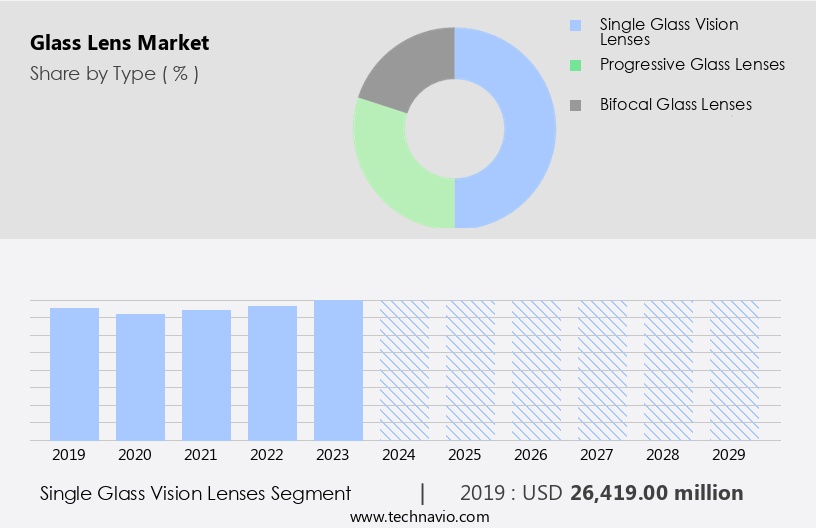
The Single glass vision lenses segment was valued at USD 26.42 billion in 2019 and showed a gradual increase during the forecast period.
Regional Analysis
APAC is estimated to contribute 46% to the growth of the global market during the forecast period.Technavio's analysts have elaborately explained the regional trends and drivers that shape the market during the forecast period.

The North American the market is experiencing growth due to the aging population, increasing screen time, and rising prevalence of vision-related problems such as myopia, hyperopia, astigmatism, and presbyopia. The region's well-established healthcare system, with a focus on vision care, contributes significantly to the market's expansion. In the US, the largest market in North America, investments in healthcare and the vision care industry are driving growth. Key entities in the market include polycarbonates, high-index plastics, scratch-resistant coatings, anti-reflective coatings, and coating technologies. The market also caters to various optical disorders, such as nearsightedness, farsightedness, and cataracts, through corrective lenses like prescription glasses, contact lenses, and bifocals.
The region's market expansion is driven by the well-established healthcare system in the US, which prioritizes high-quality vision care services primarily through ophthalmic clinics and hospitals. The market growth is also fueled by substantial investments in the healthcare sector in the US and the presence of numerous key players. Fashion eyewear, a significant segment of the market, is gaining popularity due to the increasing trend of online retail platforms. The integration of artificial intelligence and machine learning in the design and production of glasses, as well as the availability of fashion eyewear and visually appealing lenses, further boosts market growth.
Additionally, the market is witnessing the emergence of low-cost manufacturers and the increasing popularity of e-commerce platforms. The market also offers various types of lenses, including single vision, progressive lenses, photochromic lenses, and trifocal lenses, catering to diverse consumer needs. The market's expansion is further fueled by public health campaigns, increasing patient visits, and the growing prevalence of diabetes and diabetic retinopathy. The market also caters to specific needs, such as UV protection, blue light reduction, and anti-fog coating, through various types of lenses. The market's growth is also influenced by the increasing use of glasses in various applications, including telescopes, microscopes, cameras, and data storage media. The market's future trends include the integration of three-dimensional printing, refractive surgery, and online retail platforms.
Market Dynamics
Our researchers analyzed the data with 2024 as the base year, along with the key drivers, trends, and challenges. A holistic analysis of drivers will help companies refine their marketing strategies to gain a competitive advantage.
What are the Glass Lens market drivers leading to the rise in the adoption of Industry?
- The escalating elderly demographic represents the primary market catalyst, significantly influencing market growth. The aging population trend, driven by increased life expectancy and declining birth rates, is leading to a significant shift in healthcare expenditures, particularly in vision care. This demographic change is expected to result in increased spending on corrective lenses, coatings, and other vision-related solutions. Polycarbonates, high-index plastics, and coating technologies, such as scratch-resistant and anti-reflective coatings, are gaining popularity due to their durability and effectiveness. Moreover, the rise in screen time and the prevalence of optical disorders, including hyperopia and age-related vision impairments, are fueling the demand for vision correction solutions. Public health campaigns and advancements in technology, including three-dimensional printing and artificial intelligence, are also contributing to the growth of the market.
- Additionally, the increasing prevalence of vision-related problems, such as cataracts and macular degeneration, due to exposure to UV rays, is leading to a higher demand for lenses with UV protection. Polarized lenses, bifocal lenses, telescopes, and microscopes are some of the products that cater to this need. Low-cost manufacturers are also entering the market, offering affordable solutions for consumers. However, the market remains competitive, with companies investing in research and development to offer innovative products and solutions. Overall, the market for glass lenses is expected to continue growing, driven by the aging population and the increasing prevalence of vision-related problems.
What are the Glass Lens market trends shaping the Industry?
- The trend in marketing involves making products available through online distribution channels. This approach is increasingly mandatory in today's professional business environment. The market encompasses various corrective lenses, including bifocal contact lenses, prescription glasses, and progressive lenses, designed to address refractive errors such as myopia, presbyopia, and cataracts. This market caters to diverse populations, including children and those with diabetes, who are at risk of vision loss due to conditions like diabetic retinopathy.
- Eye clinics play a pivotal role in diagnosing and prescribing corrective lenses, offering patient visits and consultations. Online platforms, including e-commerce sites, have emerged as significant players, offering convenience and affordability through a broad range of products, including anti-reflective coatings, scratch-resistant coatings, and designer frames. The advent of the Internet has streamlined the buying process, enabling quick delivery services and real-time interaction through live chat options. Companies engage consumers to enhance health education and promote products, contributing to the market's growth. The World Health Organization estimates that approximately 2.2 billion people worldwide have a refractive error, underscoring the market's potential.
How does Glass Lens market faces challenges face during its growth?
- The glass lens's limitations and the challenges in its production significantly hinder the growth of the industry. Specifically, the industry faces obstacles in overcoming the technical constraints of glass lenses and increasing their production efficiency to meet rising demand. Glass lenses, particularly those used in fashion eyewear, offer numerous benefits such as precision, scratch-resistance, durability, and lightweight properties. However, some limitations hinder their widespread adoption. One issue is the physical discomfort associated with glass lenses. The thickness required for correcting high prescriptions can cause discomfort and reduce visual appeal. Moreover, the frames needed to accommodate large progressive glass lenses can be bulky, leading to pressure on the nose and behind the ears, causing headaches and general discomfort. Photochromic lenses, a type of glass lens, address some of these concerns by providing the advantage of being able to adapt to changing light conditions.
- Furthermore, advancements in technology have led to the development of thin and lightweight photochromic lenses. Additionally, the growing prevalence of astigmatism, digital eye strain from extended laptop use, and an aging population with refractive surgery procedures increasing the demand for prescription glass lenses. Blue Light Reduction technology in photochromic lenses further caters to the needs of consumers using data storage media and other digital devices. Despite these benefits, the high cost and potential for breakage remain challenges to the market growth. Health insurance policies may cover some of the expenses, but the affordability remains a concern for many consumers.
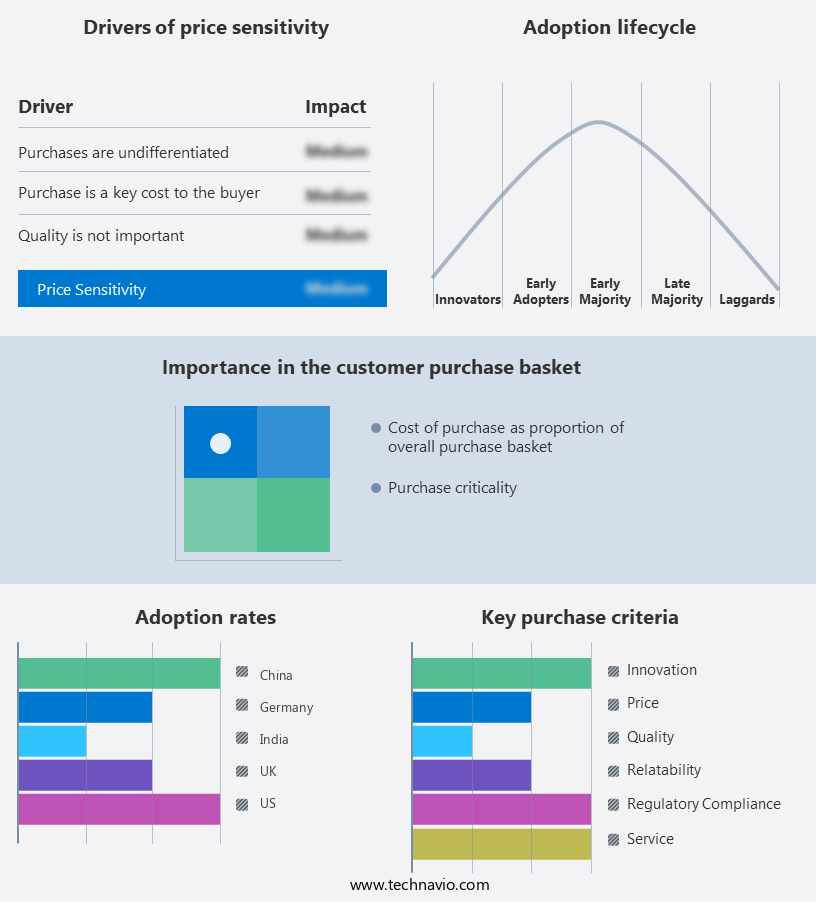
Exclusive Customer Landscape
The glass lens market forecasting report includes the adoption lifecycle of the market, covering from the innovator's stage to the laggard's stage. It focuses on adoption rates in different regions based on penetration. Furthermore, the glass lens market report also includes key purchase criteria and drivers of price sensitivity to help companies evaluate and develop their market growth analysis strategies.
Customer Landscape
Key Companies & Market Insights
Companies are implementing various strategies, such as strategic alliances, glass lens market forecast, partnerships, mergers and acquisitions, geographical expansion, and product/service launches, to enhance their presence in the industry.
Bausch Lomb Corp. - The company offers glass lenses such as Zenlens (scleral lenses), Quantum (custom soft lenses), and KeraSoft (specialty lenses for irregular corneas).
The industry research and growth report includes detailed analyses of the competitive landscape of the market and information about key companies, including:
- Bausch Lomb Corp.
- Carl Zeiss AG
- EcoGlass AS
- Essilor Ltd.
- Fielmann AG
- GKB Ophthalmics Ltd.
- Guild Optical Associates Inc.
- HOYA Vision Care Europe Hoya Holdings N.V.
- Jiangsu Hongchen Optical Co. Ltd.
- Knight Optical Ltd.
- Leica Camera AG
- Lensel Optics Pvt Ltd.
- Luzerne Optical Laboratories Ltd.
- Ohara Inc.
- Rodenstock GmBH
- Shanghai Mingyue Glasses Co. Ltd.
- SUMITA OPTICAL GLASS Inc.
- TOKAI OPTICAL Co. Ltd.
- Vision Rx Lab
- Younger Optics
Qualitative and quantitative analysis of companies has been conducted to help clients understand the wider business environment as well as the strengths and weaknesses of key industry players. Data is qualitatively analyzed to categorize companies as pure play, category-focused, industry-focused, and diversified; it is quantitatively analyzed to categorize companies as dominant, leading, strong, tentative, and weak.
Recent Development and News in Glass Lens Market
- In January 2024, Corning Incorporated, a leading glass technology company, unveiled its new Gorilla Glass Victus, which is claimed to be the world's strongest glass for smartphones, offering superior damage resistance against drops and scratches (Corning Inc. Press Release, 2024). This innovation is expected to significantly enhance the competitive edge of smartphone manufacturers using this advanced glass technology.
- In March 2025, Asahi Glass Co. (AGC) and Foxconn Interconnect Technology Limited (FIT) announced a strategic partnership to develop and manufacture advanced glass-on-glass touch sensors for automotive applications (AGC Press Release, 2025). This collaboration is anticipated to revolutionize the automotive industry by integrating touch functionality into car windows, improving user experience and safety features.
- In August 2024, Nanolumens, a leading provider of LED displays, raised USD30 million in a Series C funding round, with investments from key industry players such as Corning and LG Display (Nanolumens Press Release, 2024). This significant investment will enable Nanolumens to expand its production capacity and accelerate the development of its glass-based LED display technology, targeting large-format digital signage and architectural applications.
- In December 2025, the European Union (EU) approved the Horizon Europe research and innovation program, which includes a focus on advanced materials, including glass lenses, with an investment of USD 116 billion (European Commission Press Release, 2025). This initiative is expected to foster innovation and growth within the European the market, driving technological advancements and creating new business opportunities.
Research Analyst Overview
The market exhibits a dynamic and evolving landscape, shaped by various factors that influence its growth and trends. One significant factor is the aging population, as the global population continues to age, the demand for vision care solutions, including glass lenses, is expected to increase. This demographic shift is particularly pronounced in developed regions, where populations are aging more rapidly. Another trend in the market is the increasing use of advanced materials, such as polycarbonates, in lens production. These materials offer superior durability and impact resistance, making them an attractive option for various applications, from safety glasses to eyeglasses.
Public health campaigns and increasing awareness of vision-related problems are also driving growth in the market. With the rise of screen time and digital eye strain, there is a growing need for corrective lenses that reduce blue light and provide UV protection. This is particularly important for individuals with refractive errors, such as hyperopia, myopia, and astigmatism. Coating technologies, such as scratch-resistant and anti-reflective coatings, are also gaining popularity in the market. These coatings enhance the functionality and durability of lenses, making them more appealing to consumers. Additionally, the development of three-dimensional printing technology is enabling the production of customized lenses, offering greater precision and comfort for wearers.
Vision care is not limited to corrective lenses, however. There is also a growing demand for lenses for specific applications, such as telescopes, microscopes, and cameras. These lenses require high-quality materials and precise manufacturing processes to ensure optimal performance. The market for glass lenses is also influenced by technological advancements, such as artificial intelligence and machine learning. These technologies are being used to develop more sophisticated lens designs and to improve the accuracy of prescription glasses. Additionally, the integration of AI and machine learning in eye clinics is enabling faster and more accurate diagnosis of eye disorders, such as cataracts and diabetic retinopathy.
The market for glass lenses is diverse and includes various types of lenses, such as single vision, bifocal, trifocal, and progressive lenses. There is also a growing demand for fashion eyewear, with consumers seeking visually appealing lenses that offer both style and functionality. The market is also influenced by economic factors, such as healthcare policies and health insurance coverage. In some regions, government policies and healthcare systems prioritize access to affordable vision care solutions, driving demand for low-cost manufacturers and OTC reading glasses. In other regions, high-quality, durable, and lightweight lenses are preferred, with consumers willing to pay a premium for these features.
E-commerce is also playing an increasingly important role in the market, with online retail platforms offering greater convenience and accessibility for consumers. However, the rise of e-commerce also presents challenges for traditional brick-and-mortar eye clinics and optical stores, as they adapt to changing consumer preferences and competition from online retailers. In conclusion, the market is a dynamic and evolving landscape, shaped by various factors, including demographic trends, technological advancements, and economic factors. The market includes a diverse range of products and applications, from corrective lenses to lenses for specific applications, and is influenced by consumer preferences and economic factors. As the market continues to evolve, it is expected to offer significant opportunities for innovation and growth.
Dive into Technavio's robust research methodology, blending expert interviews, extensive data synthesis, and validated models for unparalleled Glass Lens Market insights. See full methodology.
|
Market Scope |
|
|
Report Coverage |
Details |
|
Page number |
217 |
|
Base year |
2024 |
|
Historic period |
2019-2023 |
|
Forecast period |
2025-2029 |
|
Growth momentum & CAGR |
Accelerate at a CAGR of 3.1% |
|
Market growth 2025-2029 |
USD 7.75 billion |
|
Market structure |
Fragmented |
|
YoY growth 2024-2025(%) |
3.0 |
|
Key countries |
US, China, India, Canada, Germany, Japan, UK, South Korea, France, and Australia |
|
Competitive landscape |
Leading Companies, Market Positioning of Companies, Competitive Strategies, and Industry Risks |
What are the Key Data Covered in this Glass Lens Market Research and Growth Report?
- CAGR of the Glass Lens industry during the forecast period
- Detailed information on factors that will drive the growth and forecasting between 2025 and 2029
- Precise estimation of the size of the market and its contribution of the industry in focus to the parent market
- Accurate predictions about upcoming growth and trends and changes in consumer behaviour
- Growth of the market across North America, APAC, Europe, South America, and Middle East and Africa
- Thorough analysis of the market's competitive landscape and detailed information about companies
- Comprehensive analysis of factors that will challenge the glass lens market growth and forecasting
We can help! Our analysts can customize this glass lens market research report to meet your requirements.
 RIA -
RIA - 
