Americas Glass Packaging Market Size 2026-2030
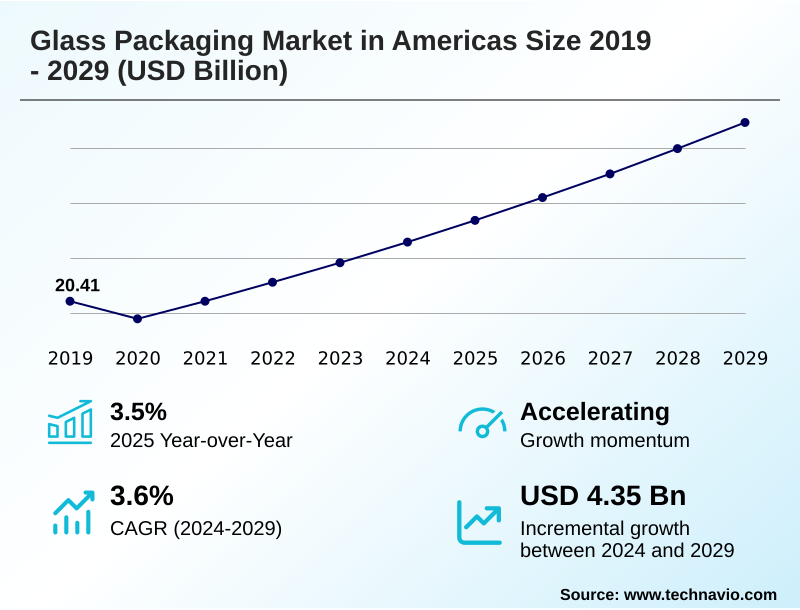
The Americas Glass Packaging Market size was valued at USD 23.35 billion in 2025, growing at a CAGR of 3.7% during the forecast period 2026-2030.
Major Market Trends & Insights
- By Application - Food and beverages segment was valued at USD 12.01 billion in 2024
- By Type - Soda lime glass segment accounted for the largest market revenue share in 2024
Market Size & Forecast
- Historic Market Opportunities 2020-2024: USD 8.18 billion
- Market Future Opportunities 2025-2030: USD 4.60 billion
- CAGR from 2025 to 2030 : 3.7%
Market Summary
- The glass packaging market in Americas demonstrates resilient growth, with a 3.5% year-over-year increase, underpinned by strong consumer and regulatory tailwinds. This expansion is primarily driven by a pronounced shift toward sustainable packaging solutions, as glass is infinitely recyclable without any loss of quality.
- A key business scenario involves brand owners leveraging glass to capitalize on the premiumization trend; products in glass packaging are perceived by consumers as 35% higher in quality, justifying premium pricing for beverages and food items. This dynamic allows companies to enhance brand image and appeal to an eco-conscious consumer base.
- However, the industry faces a significant challenge from the intense competition of lighter and often cheaper alternatives like plastic and aluminum, which offer logistical and cost advantages. This requires continuous innovation in areas such as lightweighting and design to maintain market position.
What will be the Size of the Americas Glass Packaging Market during the forecast period?
Get Key Insights on Market Forecast (PDF) Request Free Sample
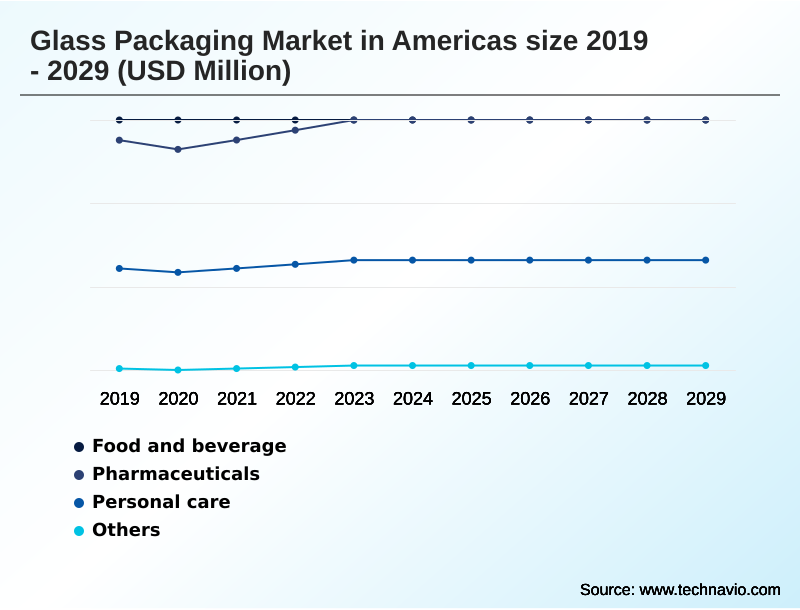
How is the Americas Glass Packaging Market Segmented?
The americas glass packaging industry research report provides comprehensive data (region-wise segment analysis), with forecasts and analysis for the period 2026-2030, as well as historical data from 2020-2024 for the following segments.
- Application
- Food and beverages
- Pharmaceuticals
- Personal care
- Others
- Type
- Soda lime glass
- Borosilicate glass
- De-alkalized soda lime glass
- Product
- Bottles
- Jars and containers
- Vials
- Others
- Geography
- Americas
How is the Americas Glass Packaging Market Segmented by Application?
The food and beverages segment is estimated to witness significant growth during the forecast period.
The food and beverages segment, representing over 50% of the market, is driven by the premiumization trend and a strong consumer perception of glass as a superior material.
For instance, products in glass are perceived by consumers as being 35% higher in quality than identical products in plastic, directly impacting brand identity and justifying higher price points.
This preference for packaging purity and product integrity reinforces the use of glass for a wide range of goods, from craft beer to artisanal sauces.
The chemical inertness of materials like soda lime glass is a key value proposition, ensuring that the original flavor and aroma are preserved, which is a critical factor for the clean label movement and organic product categories, enhancing shelf presence.
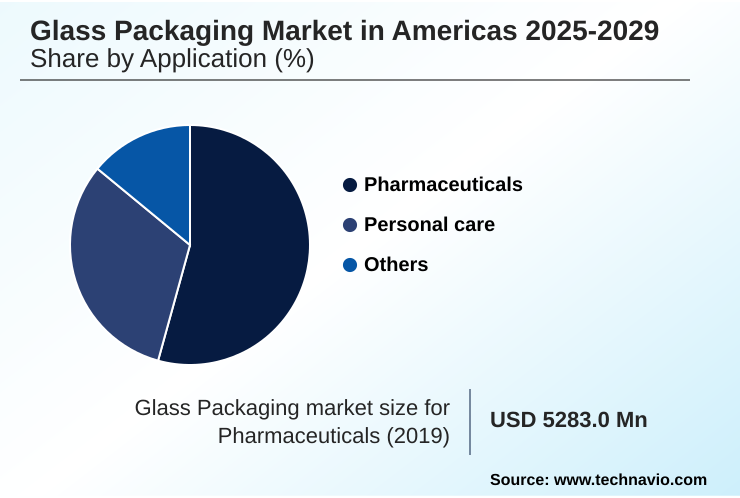
The Food and beverages segment was valued at USD 12.01 billion in 2024 and showed a gradual increase during the forecast period.
What are the key Drivers, Trends, and Challenges in the Americas Glass Packaging Market?
Our researchers analyzed the data with 2025 as the base year, along with the key drivers, trends, and challenges. A holistic analysis of drivers will help companies refine their marketing strategies to gain a competitive advantage.
- Strategic decision-making in the glass packaging market in Americas requires a nuanced understanding of material science and manufacturing technology. The determination of soda lime glass vs borosilicate properties is a critical first step, as borosilicate glass for pharmaceutical vials offers superior chemical resistance essential for drug stability, a feature not required for most food and beverage containers.
- Concurrently, the adoption of lightweighting technology for glass bottles is a key competitive lever, with advanced processes capable of reducing container weight by up to 30%, which in turn lowers transportation costs and carbon footprint. This directly addresses one of the primary challenges in glass recycling infrastructure: the high cost of transporting heavy materials.
- Furthermore, companies are pursuing various glass packaging premiumization strategies, using unique designs and decoration to command higher prices. A central element of these efforts involves increasing recycled content in glass packaging.
- Using recycled cullet is not only an environmental benefit but also an economic one, as every 10% of cullet used can reduce melting energy requirements by nearly 3%, improving operational efficiency in an energy-intensive process.
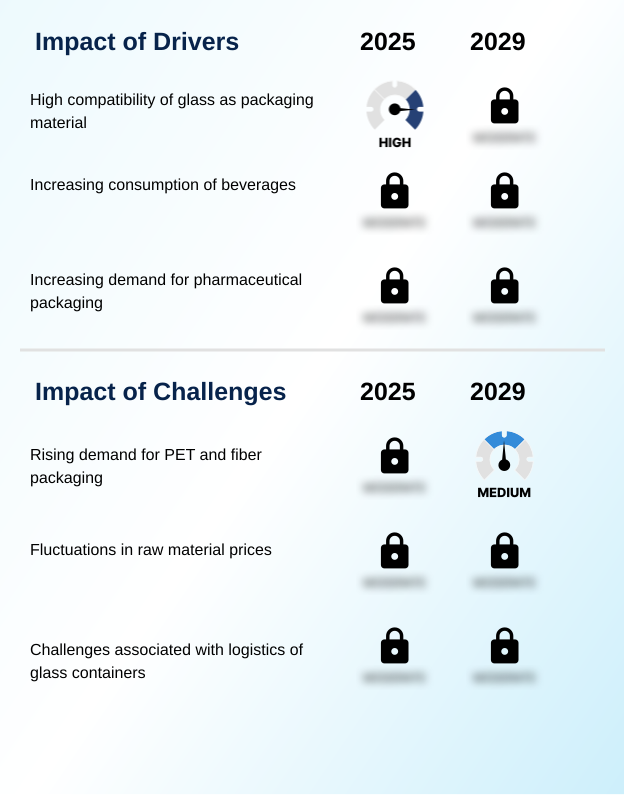
What are the key market drivers leading to the rise in the adoption of Americas Glass Packaging Industry?
- Heightened consumer and regulatory focus on sustainability serves as a primary catalyst for the expansion of the glass packaging market in the Americas.
- The pervasive premiumization trend in the food and beverage sector is a significant driver for the glass packaging market in Americas, where packaging is a key communicator of product quality.
- Products packaged in glass are perceived by consumers as being 35% higher in quality compared to identical products in plastic containers, justifying a higher price point.
- This consumer perception is a powerful tool for premium brand differentiation, especially in crowded categories. For example, over 90% of new super-premium ready-to-drink cocktails utilize custom-designed glass bottles to enhance shelf presence and convey a sense of craftsmanship.
- This dynamic directly links the choice of packaging material to brand identity and revenue generation, making glass the preferred option for high-value products.
What are the market trends shaping the Americas Glass Packaging Industry?
- The ascendancy of sustainability and the imperative of a circular economy are defining the strategic direction of the glass packaging market in the Americas.
- The ascendancy of the circular economy imperative is reshaping the glass packaging market in Americas, with a clear trend toward maximizing post-consumer recycled content. The use of cullet in manufacturing is a key strategic advantage, as it can lower energy requirements by 3% for every 10% of recycled material used.
- This push is supported by legislation, such as mandates that require beverage bottles to contain a minimum of 60% recycled cullet, compelling manufacturers to invest heavily in recycling infrastructure. This focus on creating a robust closed-loop system is a direct response to consumer demand for sustainable packaging solutions and reinforces glass's position as an environmentally responsible choice.
- The industry's ability to innovate around the collection and processing of recycled glass will be a key determinant of future competitiveness.
What challenges does the Americas Glass Packaging Industry face during its growth?
- Intense competition from alternative packaging materials, such as plastics and aluminum, presents a significant challenge to the growth of the glass packaging market in the Americas.
- Intense competition from alternative packaging materials presents a formidable challenge to the glass packaging market in Americas. Lightweight and shatterproof alternatives like PET and aluminum offer significant logistical advantages, with some brands citing a 30% reduction in transportation-related carbon emissions after switching from glass.
- This pressure is most acute in high-volume beverage categories, where aluminum cans have surpassed glass bottles as the primary format for ready-to-drink spirits in North America.
- The constant innovation in plastic barrier properties and the branding flexibility of aluminum cans force glass manufacturers to continuously defend their market share by mitigating inherent disadvantages in weight and fragility through technologies like lightweighting and advanced design, addressing a key chemical leaching risk concern.
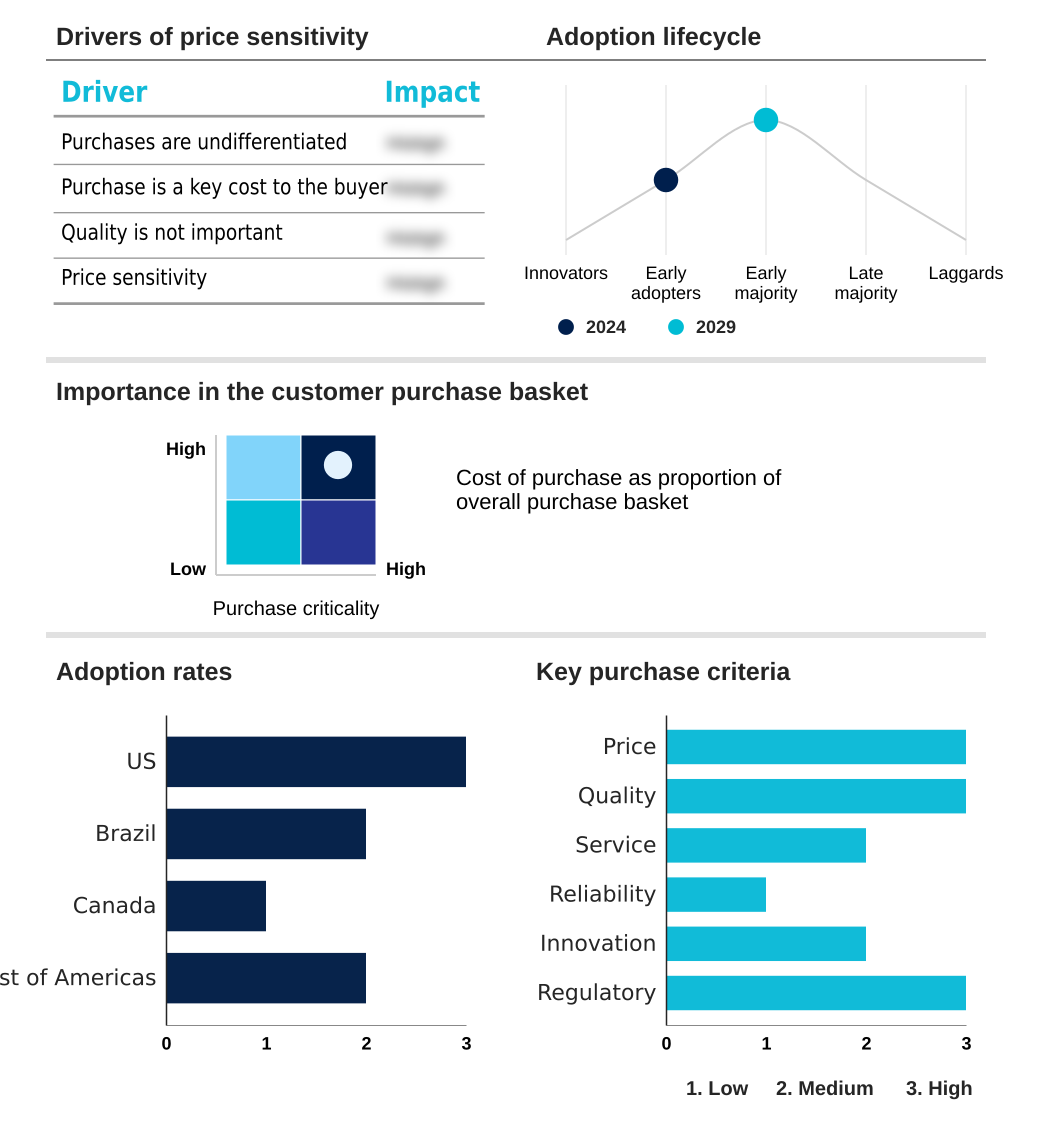
Exclusive Technavio Analysis on Customer Landscape
The americas glass packaging market forecasting report includes the adoption lifecycle of the market, covering from the innovator’s stage to the laggard’s stage. It focuses on adoption rates in different regions based on penetration. Furthermore, the americas glass packaging market report also includes key purchase criteria and drivers of price sensitivity to help companies evaluate and develop their market growth analysis strategies.
Customer Landscape of Americas Glass Packaging Industry
Competitive Landscape
Companies are implementing various strategies, such as strategic alliances, americas glass packaging market forecast, partnerships, mergers and acquisitions, geographical expansion, and product/service launches, to enhance their presence in the industry.
Ardagh Group SA - Key offerings focus on infinitely recyclable glass packaging, including bottles and jars, delivering premium quality and sustainability for diverse end-use markets.
The industry research and growth report includes detailed analyses of the competitive landscape of the market and information about key companies, including:
- Ardagh Group SA
- BA Glass BV
- Beatson Clark
- Berlin Packaging LLC
- Bormioli Rocco Spa
- Burch Bottle Packaging Inc.
- Calaso B.V.
- Gerresheimer AG
- Kaufman Container Co.
- M A Silva USA
- O I Glass Inc.
- O.Berk Co. LLC
- PGP Glass Pvt. Ltd.
- Verallia SA
- WestPack LLC
Qualitative and quantitative analysis of companies has been conducted to help clients understand the wider business environment as well as the strengths and weaknesses of key industry players. Data is qualitatively analyzed to categorize companies as pure play, category-focused, industry-focused, and diversified; it is quantitatively analyzed to categorize companies as dominant, leading, strong, tentative, and weak.
Market Intelligence Radar: High-Impact Developments & Growth Signals
- In the Metal, Glass and Plastic Containers industry, the implementation of stringent environmental regulations, including extended producer responsibility schemes and mandates for recycled content, is compelling glass packaging manufacturers to invest in circular economy initiatives and improve packaging waste management. This directly increases demand for high-quality cullet and drives innovation in closed-loop systems.
- Technological advancements within the Metal, Glass and Plastic Containers industry, such as the adoption of lightweighting processes like Narrow Neck Press and Blow (NNPB), are addressing the historical disadvantages of glass. This innovation reduces material usage and transportation costs, enhancing the competitiveness of glass against shatterproof alternative materials like plastic and aluminum.
- The Metal, Glass and Plastic Containers industry is contending with supply chain disruptions related to raw materials, particularly the inconsistent availability of clean, post-consumer cullet from material recovery facilities. This challenge impacts production costs and the ability to meet sustainability targets for post-consumer recycled content, affecting the entire glass packaging supply chain.
- Shifts in end-use demand within the Metal, Glass and Plastic Containers industry, such as the move toward aluminum cans for ready-to-drink (RTD) cocktails, present a direct competitive threat to glass packaging. This trend, driven by consumer preferences for portability and convenience, forces glass manufacturers to innovate in design and branding to maintain share in high-growth beverage categories.
Dive into Technavio’s robust research methodology, blending expert interviews, extensive data synthesis, and validated models for unparalleled Americas Glass Packaging Market insights. See full methodology.
| Market Scope | |
|---|---|
| Page number | 212 |
| Base year | 2025 |
| Historic period | 2020-2024 |
| Forecast period | 2026-2030 |
| Growth momentum & CAGR | Accelerate at a CAGR of 3.7% |
| Market growth 2026-2030 | USD 4600.8 million |
| Market structure | Fragmented |
| YoY growth 2025-2026(%) | 3.5% |
| Key countries | US, Brazil, Canada and Rest of Americas |
| Competitive landscape | Leading Companies, Market Positioning of Companies, Competitive Strategies, and Industry Risks |
Research Analyst Overview
- The ecosystem of the glass packaging market in the Americas is a complex value chain, where the food and beverage sector accounts for over 53% of end-user demand. The process begins with suppliers of raw materials like sand and soda ash, which are transformed by manufacturers such as O-I Glass and Ardagh Group in an energy-intensive process.
- These producers are making capital-intensive investments in furnace technology to reduce emissions and comply with tightening environmental regulations. The resulting containers are moved through distribution channels to end-users in the beverage, food, and pharmaceutical industries. A crucial component of this ecosystem is the reverse logistics network for post-consumer recycled content, where material recovery facilities play a vital role.
- The efficiency of this recycling infrastructure directly impacts manufacturing costs, as using cullet reduces energy consumption by up to 30%.
What are the Key Data Covered in this Americas Glass Packaging Market Research and Growth Report?
-
What is the expected growth of the Americas Glass Packaging Market between 2026 and 2030?
-
The Americas Glass Packaging Market is expected to grow by USD 4.60 billion during 2026-2030, registering a CAGR of 3.7%. Year-over-year growth in 2026 is estimated at 3.5%%. This acceleration is shaped by heightened consumer and regulatory focus on sustainability, which is intensifying demand across multiple end-use verticals covered in the report.
-
-
What segmentation does the market report cover?
-
The report is segmented by Application (Food and beverages, Pharmaceuticals, Personal care, and Others), Type (Soda lime glass, Borosilicate glass, and De-alkalized soda lime glass), Product (Bottles, Jars and containers, Vials, and Others) and Geography (Americas). Among these, the Food and beverages segment is estimated to witness significant growth during the forecast period, driven by rising adoption across key application areas. Each segment includes detailed qualitative and quantitative analysis, along with historical data from 2020-2024 and forecasts through 2030 with year-over-year growth rates.
-
-
Which regions are analyzed in the report?
-
The report covers Americas. Country-level analysis includes US, Brazil, Canada and Rest of Americas, with dedicated market size tables and year-over-year growth for each.
-
-
What are the key growth drivers and market challenges?
-
The primary driver is heightened consumer and regulatory focus on sustainability, which is accelerating investment and industry demand. The main challenge is intense competition from alternative packaging materials, creating operational barriers for key market participants. The report quantifies the impact of each driver and challenge across 2026 and 2030 with comparative analysis.
-
-
Who are the major players in the Americas Glass Packaging Market?
-
Key vendors include Ardagh Group SA, BA Glass BV, Beatson Clark, Berlin Packaging LLC, Bormioli Rocco Spa, Burch Bottle Packaging Inc., Calaso B.V., Gerresheimer AG, Kaufman Container Co., M A Silva USA, O I Glass Inc., O.Berk Co. LLC, PGP Glass Pvt. Ltd., Verallia SA and WestPack LLC. The report provides qualitative and quantitative analysis categorizing companies as dominant, leading, strong, tentative, and weak based on their market positioning. Company profiles include business segment analysis, SWOT assessment, key offerings, and recent strategic developments.
-
Market Research Insights
- The competitive landscape of the glass packaging market in Americas is moderately consolidated, with major players like O-I Glass Inc., Ardagh Group SA, and Verallia SA accounting for a significant share of production capacity. These industry leaders are making substantial capital-intensive investments, with over 60% of recent capex directed toward sustainability and efficiency upgrades.
- For example, O-I Glass has deployed its MAGMA melting technology to reduce energy consumption by up to 50% at upgraded facilities. Meanwhile, specialized producers like Gerresheimer AG are focusing on high-value segments, expanding capacity for Type I borosilicate glass vials to meet pharmaceutical demand.
- These strategic actions directly address key market drivers, including the circular economy imperative and the need to defend market share against alternative materials through technological innovation and enhanced value propositions in a highly competitive environment.
We can help! Our analysts can customize this americas glass packaging market research report to meet your requirements.
 RIA -
RIA - 
