Grant Management Software Market Analysis, Size, and Forecast 2025-2029: North America (US, Canada, and Mexico), Europe (UK, Germany, and France), APAC (China, India, and Japan), South America (Brazil and Argentina), Middle East and Africa (UAE, Saudi Arabia, and South Africa), and Rest of World (ROW)

Grant Management Software Market Analysis, Size, and Forecast 2025-2029:
North America (US, Canada, and Mexico), Europe (UK, Germany, and France), APAC (China, India, and Japan), South America (Brazil and Argentina), Middle East and Africa (UAE, Saudi Arabia, and South Africa), and Rest of World (ROW)

Published: Dec 2025 293 Pages SKU: IRTNTR81131

Market Overview at a Glance

$1.52 B
Market Opportunity
10.4%
CAGR 2024 - 2029
31.8%
North America Growth
$1.47 B
Solutions segment 2023

Grant Management Software Market Size 2025-2029

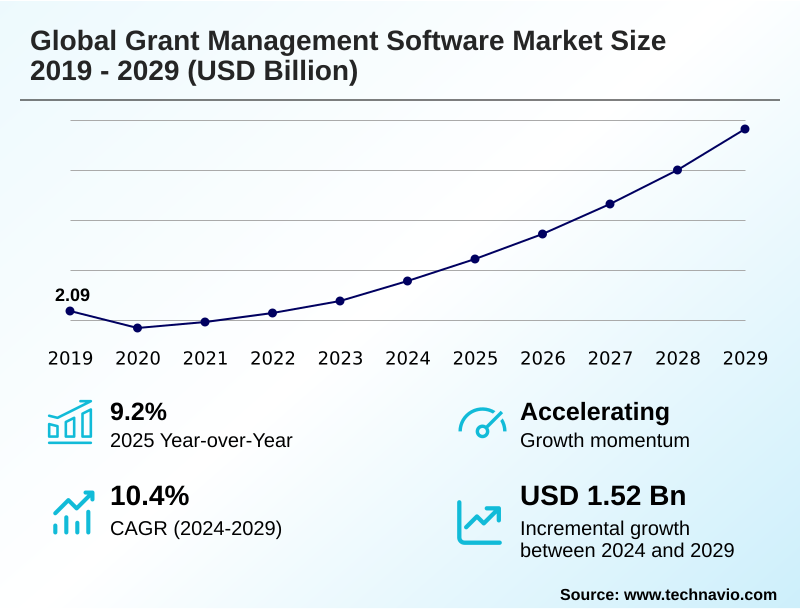
The grant management software market size is valued to increase by USD 1.52 billion, at a CAGR of 10.4% from 2024 to 2029. Escalating complexity in regulatory compliance and funder reporting mandates will drive the grant management software market.

Major Market Trends & Insights

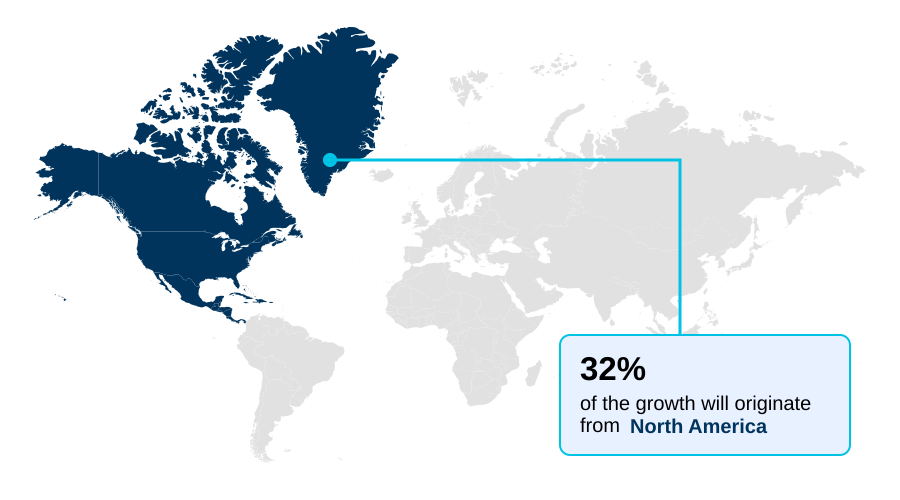
  • North America dominated the market and accounted for a 31.8% growth during the forecast period.
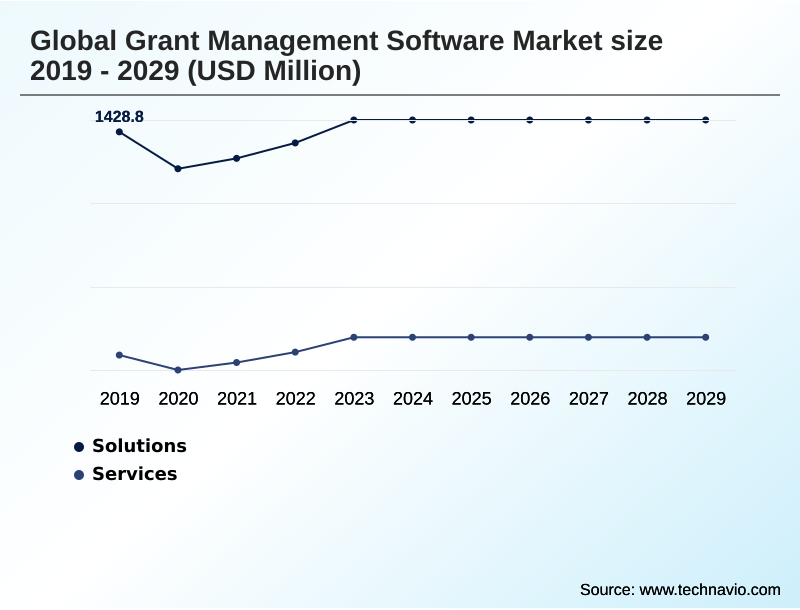
  • By Component - Solutions segment was valued at USD 1.47 billion in 2023
  • By Application - Application tracking segment accounted for the largest market revenue share in 2023

Market Size & Forecast

  • Market Opportunities: USD 1.82 billion
  • Market Future Opportunities: USD 1.52 billion
  • CAGR from 2024 to 2029 : 10.4%

Market Summary

  • The Grant Management Software Market is defined by a strategic shift toward digital transformation, driven by the need for greater efficiency and accountability in the philanthropic and public sectors. Organizations are moving away from manual processes to adopt comprehensive platforms that provide robust compliance monitoring tools and streamline post-award reporting.
  • The integration of advanced analytics and AI-driven grant matching is becoming a key trend, allowing funders to optimize their philanthropic portfolio management and make data-informed decisions. For instance, a nonprofit managing multiple federal grants can leverage a centralized system for meticulous budget tracking and reconciliation and effort reporting for personnel, ensuring audit trail maintenance and adherence to complex regulations.
  • This automation of pre-award workflows and financial disbursement automation not only reduces administrative burden but also enhances transparency. However, challenges related to the complexity of fund accounting integration and ensuring stringent data security persist.
  • The market's evolution reflects a broader demand for technology that enables measurable social impact, pushing vendors to offer more sophisticated social impact measurement tools and grantee relationship management features within their SaaS grant management platforms.

What will be the Size of the Grant Management Software Market during the forecast period?

Get Key Insights on Market Forecast (PDF) Request Free Sample

How is the Grant Management Software Market Segmented?

The grant management software industry research report provides comprehensive data (region-wise segment analysis), with forecasts and estimates in "USD million" for the period 2025-2029, as well as historical data from 2019-2023 for the following segments.

  • Component
    • Solutions
    • Services
  • Application
    • Application tracking
    • Performance and outcomes measurement
    • Collaboration
    • Others
  • Deployment
    • Cloud
    • On-premises
  • Geography
    • North America
      • US
      • Canada
      • Mexico
    • Europe
      • UK
      • Germany
      • France
    • APAC
      • China
      • India
      • Japan
    • South America
      • Brazil
      • Argentina
    • Middle East and Africa
      • UAE
      • Saudi Arabia
      • South Africa
    • Rest of World (ROW)

By Component Insights

The solutions segment is estimated to witness significant growth during the forecast period.

The core of the Grant Management Software Market is composed of advanced solutions, predominantly delivered as saas grant management platforms.

These end-to-end grant solutions facilitate the entire grant lifecycle management process, from pre-award workflows with configurable online application forms to post-award financial disbursement automation and integrated grants accounting.

The shift to cloud-based philanthropy software has made these powerful nonprofit technology solutions more accessible, with some platforms improving data accessibility by 99%. Modern systems feature sophisticated impact reporting modules and data visualization dashboards, enabling organizations to demonstrate value effectively.

Crucially, API-based system integration allows for seamless connectivity with other business systems, enabling comprehensive grant reporting automation and creating a unified operational view.

Request Free Sample

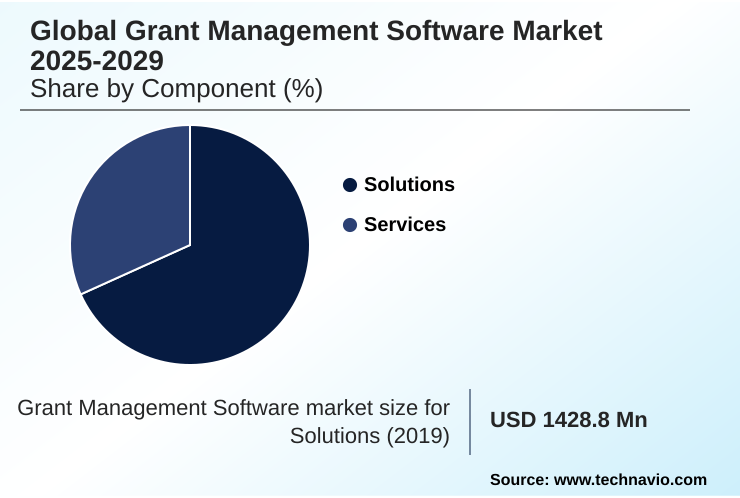
The Solutions segment was valued at USD 1.47 billion in 2023 and showed a gradual increase during the forecast period.

Request Free Sample

Regional Analysis

North America is estimated to contribute 31.8% to the growth of the global market during the forecast period.Technavio’s analysts have elaborately explained the regional trends and drivers that shape the market during the forecast period.

See How Grant Management Software Market Demand is Rising in North America Request Free Sample

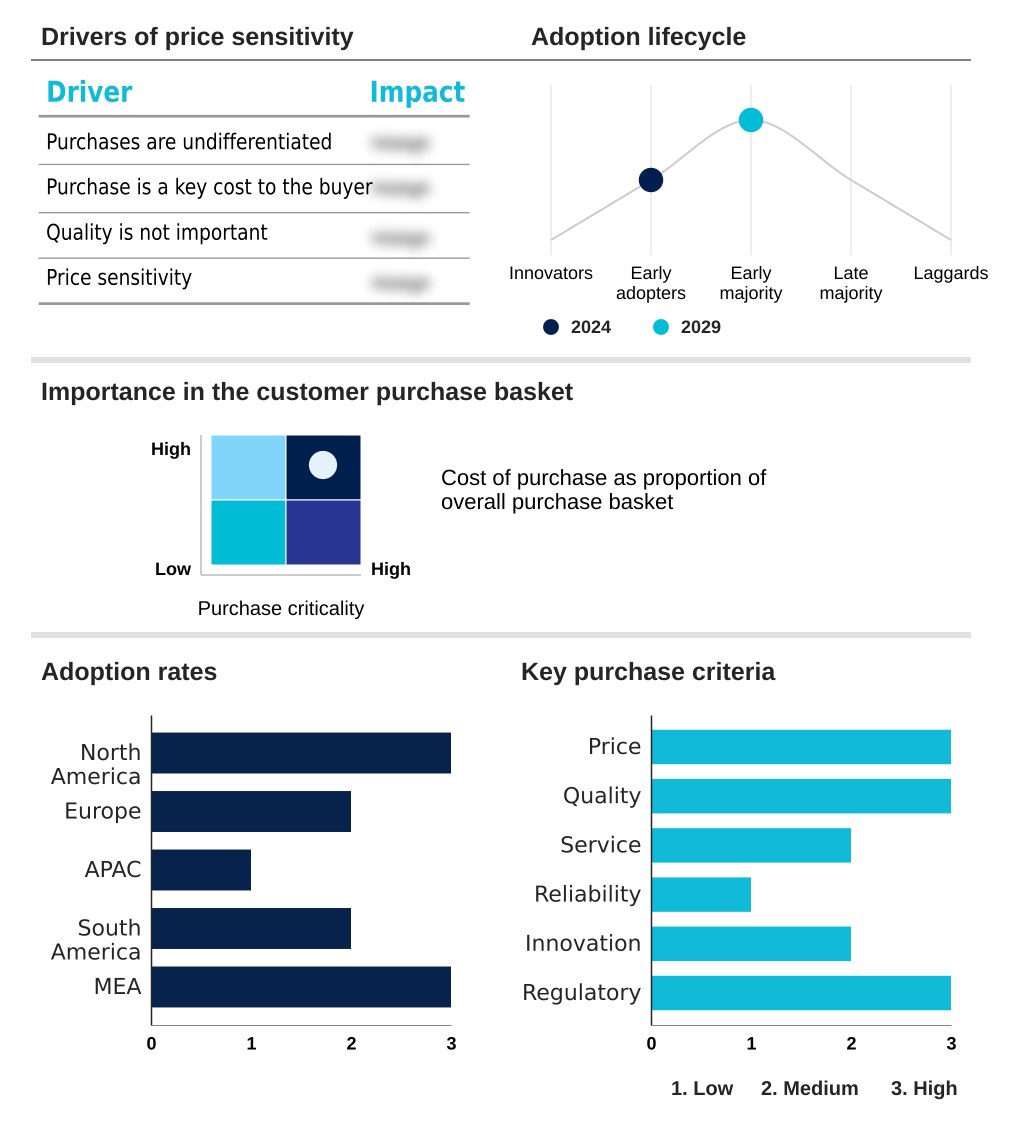
The geographic landscape is led by North America, which accounts for over 31% of incremental growth due to its mature philanthropic ecosystem and high demand for advanced foundation management software.

This region requires sophisticated budget tracking and reconciliation and tools for effective grantee relationship management. Conversely, APAC is the fastest-growing region, driven by rapid digitalization and an expanding nonprofit sector seeking scalable community foundation software.

European demand is shaped by stringent regulations, necessitating platforms with customizable reporting tools and secure collaborative evaluation portals.

Across all regions, the need for streamlined grant agreement generation, efficient grant closeout procedures, and holistic philanthropic portfolio management is universal, driving global adoption.

Market Dynamics

Our researchers analyzed the data with 2024 as the base year, along with the key drivers, trends, and challenges. A holistic analysis of drivers will help companies refine their marketing strategies to gain a competitive advantage.

  • As organizations mature, the focus shifts to advanced operational strategies such as automating grant application review processes and implementing ESG metrics in grantmaking to align with global standards. The technical complexity of these initiatives is significant, demanding robust solutions for managing federal grant compliance requirements and ensuring data security in cloud grant platforms.
  • A critical success factor is the deep integration of systems, particularly integrating financial systems with grant software to create a single source of truth for financial oversight. Organizations leveraging grant management platform API integration report audit-readiness times that are up to 50% faster than those using disparate tools.
  • Best practices for grant closeout procedures are now being codified within software workflows, ensuring consistency. The market is also seeing increased specialization, with purpose-built software for managing multi-partner research grants and unique grant management software for corporate foundations.
  • Success increasingly depends on a platform's ability to handle nuanced tasks like managing complex subaward agreements and automating post-award financial reporting, moving beyond basic administration to strategic asset management. Using AI for predictive grant analytics is the next frontier, promising to further refine the process of measuring social return on investment with software and enhancing impact tracking for philanthropic investments.

What are the key market drivers leading to the rise in the adoption of Grant Management Software Industry?

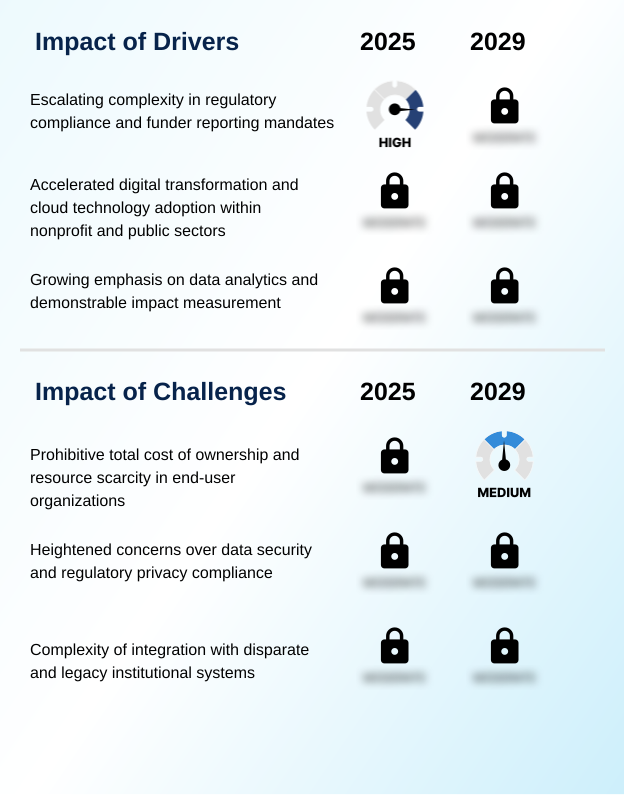
  • The escalating complexity of regulatory compliance and funder reporting mandates is a key driver compelling organizations to adopt automated grant management solutions.

  • The market is significantly driven by the widespread digital transformation for nonprofits and the necessity for automating grant compliance. Escalating regulatory complexity necessitates robust compliance monitoring tools and detailed audit trail maintenance for all post-award reporting.
  • Public sector grant software and research funding management systems are now essential for maintaining real-time financial oversight and performing thorough due diligence verification.
  • The move to cloud platforms enables automated eligibility screening, which can reduce administrative workload by up to 40%.
  • These platforms serve as a centralized grant information hub for higher education research administration and feature tools like a grantee communication portal to improve transparency and stakeholder engagement.

What are the market trends shaping the Grant Management Software Industry?

  • The proliferation of artificial intelligence and predictive analytics represents a transformative trend. It enhances decision-making and operational intelligence throughout the grant management lifecycle.

  • A key trend is the integration of AI, which is transforming grantmaking workflow optimization through AI-driven grant matching and predictive grant success modeling. This technology for social good enables better decision-making and enhances corporate philanthropy management.
  • Another significant shift is the focus on advanced analytics for ESG compliance tracking and impact measurement, with platforms now serving as critical social impact measurement tools and impact investing software tools. The adoption of workflow automation rules and configurable application scoring rubrics streamlines processes, improving review cycle times by over 30%.
  • These innovations also support detailed program outcome analysis and milestone tracking, fostering greater collaboration through funder collaboration platforms.

What challenges does the Grant Management Software Industry face during its growth?

  • The prohibitive total cost of ownership, coupled with resource scarcity within end-user organizations, presents a significant challenge to market growth.

  • A primary challenge is the complexity of integrating new systems with legacy infrastructure, with some organizations reporting that integration accounts for 25% of the total implementation cost. Effective fund accounting integration and single sign-on (SSO) integration are often difficult to achieve. Data security concerns also hinder adoption, requiring stringent role-based access controls and secure centralized documentation repository solutions.
  • Furthermore, managing intricate processes like subaward management, effort reporting for personnel, and multi-currency financial management demands sophisticated, and often costly, corporate giving platforms or a nonprofit CRM with grants module. These complexities can create barriers for cloud-based solutions for foundations and organizations focused on grant management for education.

Exclusive Technavio Analysis on Customer Landscape

The grant management software market forecasting report includes the adoption lifecycle of the market, covering from the innovator’s stage to the laggard’s stage. It focuses on adoption rates in different regions based on penetration. Furthermore, the grant management software market report also includes key purchase criteria and drivers of price sensitivity to help companies evaluate and develop their market growth analysis strategies.

Customer Landscape of Grant Management Software Industry

Competitive Landscape

Companies are implementing various strategies, such as strategic alliances, grant management software market forecast, partnerships, mergers and acquisitions, geographical expansion, and product/service launches, to enhance their presence in the industry.

Amplifund - Specialized digital platforms automate the entire grant administration lifecycle, enhancing operational efficiency and compliance for both funders and recipients.

The industry research and growth report includes detailed analyses of the competitive landscape of the market and information about key companies, including:

  • Amplifund
  • Benevity
  • Blackbaud Inc.
  • Bonterra LLC
  • Cayuse, LLC
  • CommunityForce Inc.
  • Fluxx
  • Foundant Technologies, Inc
  • GivingData LLC
  • GrantVantage
  • Kuali, Inc
  • Optimy
  • Oracle Corp.
  • Sage Group Plc
  • Salesforce Inc.
  • SmartSimple Software Inc
  • Submittable Co.
  • Workday Inc.

Qualitative and quantitative analysis of companies has been conducted to help clients understand the wider business environment as well as the strengths and weaknesses of key industry players. Data is qualitatively analyzed to categorize companies as pure play, category-focused, industry-focused, and diversified; it is quantitatively analyzed to categorize companies as dominant, leading, strong, tentative, and weak.

Recent Development and News in Grant management software market

  • In September 2024, Amplifund announces the acquisition of a leading AI-powered impact measurement startup to integrate predictive analytics into its post-award reporting modules.
  • In December 2024, Salesforce Inc. and the Bill & Melinda Gates Foundation announce a strategic partnership to co-develop an open-source grantmaking framework on the Salesforce platform, aimed at standardizing data models for global health initiatives.
  • In February 2025, Blackbaud Inc. launches a new ESG and sustainability reporting module for its grant management solutions, designed to help corporate foundations comply with the EU's Corporate Sustainability Reporting Directive (CSRD).
  • In May 2025, a consortium of vendors including Fluxx, Foundant Technologies, and SmartSimple Software unveil the 'Grant Interoperability Standard', an open API initiative to facilitate seamless data transfer between grantmaking and financial systems.

Dive into Technavio’s robust research methodology, blending expert interviews, extensive data synthesis, and validated models for unparalleled Grant Management Software Market insights. See full methodology.

Market Scope
Page number 293
Base year 2024
Historic period 2019-2023
Forecast period 2025-2029
Growth momentum & CAGR Accelerate at a CAGR of 10.4%
Market growth 2025-2029 USD 1524.1 million
Market structure Fragmented
YoY growth 2024-2025(%) 9.2%
Key countries US, Canada, Mexico, UK, Germany, France, Italy, Spain, The Netherlands, China, India, Japan, Australia, South Korea, Indonesia, Brazil, Argentina, Chile, UAE, Saudi Arabia, South Africa, Egypt and Nigeria
Competitive landscape Leading Companies, Market Positioning of Companies, Competitive Strategies, and Industry Risks

Request Free Sample

Research Analyst Overview

  • The Grant Management Software Market is fundamentally reshaping how funding is administered, with a clear pivot toward platforms offering complete grant lifecycle management. The integration of AI-driven grant matching and predictive grant success modeling is compelling leadership to re-evaluate technology budgets, as these capabilities are becoming essential for competitive grant-seeking.
  • Systems are now expected to provide sophisticated compliance monitoring tools, including features for ESG compliance tracking and meticulous audit trail maintenance. For boardroom consideration, the adoption of these platforms directly impacts risk management; for example, solutions with robust due diligence verification and automated eligibility screening have demonstrated a 30% reduction in administrative overhead associated with compliance.
  • Essential features now include multi-currency financial management, programmatic KPI tracking, and configurable online application forms. The demand for seamless API-based system integration, comprehensive subaward management, and detailed post-award reporting underscores the market’s move toward holistic, data-centric operational frameworks that support everything from pre-award workflows to final grant closeout procedures.

What are the Key Data Covered in this Grant Management Software Market Research and Growth Report?

  • What is the expected growth of the Grant Management Software Market between 2025 and 2029?

    • USD 1.52 billion, at a CAGR of 10.4%

  • What segmentation does the market report cover?

    • The report is segmented by Component (Solutions, and Services), Application (Application tracking, Performance and outcomes measurement, Collaboration, and Others), Deployment (Cloud, and On-premises) and Geography (North America, Europe, APAC, South America, Middle East and Africa)

  • Which regions are analyzed in the report?

    • North America, Europe, APAC, South America and Middle East and Africa

  • What are the key growth drivers and market challenges?

    • Escalating complexity in regulatory compliance and funder reporting mandates, Prohibitive total cost of ownership and resource scarcity in end-user organizations

  • Who are the major players in the Grant Management Software Market?

    • Amplifund, Benevity, Blackbaud Inc., Bonterra LLC, Cayuse, LLC, CommunityForce Inc., Fluxx, Foundant Technologies, Inc, GivingData LLC, GrantVantage, Kuali, Inc, Optimy, Oracle Corp., Sage Group Plc, Salesforce Inc., SmartSimple Software Inc, Submittable Co. and Workday Inc.

Market Research Insights

  • Market dynamics are shaped by a push for operational excellence and data-driven strategy. The adoption of nonprofit technology solutions and CSR grant administration platforms has been shown to improve reporting efficiency by 40% while reducing compliance-related errors by over 25%. These platforms are central to grantmaking workflow optimization and effective philanthropic portfolio management.
  • As organizations increasingly rely on technology for social good, the ability of these systems to provide clear grant performance analytics becomes critical. This focus on measurable outcomes drives demand for specialized community foundation software and other cloud-based solutions for foundations, which offer a significant return on investment by enhancing both efficiency and strategic insight.
  • The ongoing digital transformation for nonprofits is compelling a shift toward more integrated and intelligent systems.

We can help! Our analysts can customize this grant management software market research report to meet your requirements.

Get in touch

1. Executive Summary

1.1 Market overview

Executive Summary - Chart on Market Overview
Executive Summary - Data Table on Market Overview
Executive Summary - Chart on Global Market Characteristics
Executive Summary - Chart on Market by Geography
Executive Summary - Chart on Market Segmentation by Component
Executive Summary - Chart on Market Segmentation by Application
Executive Summary - Chart on Market Segmentation by Deployment
Executive Summary - Chart on Incremental Growth
Executive Summary - Data Table on Incremental Growth
Executive Summary - Chart on Company Market Positioning

2. Technavio Analysis

2.1 Analysis of price sensitivity, lifecycle, customer purchase basket, adoption rates, and purchase criteria

2.2 Criticality of inputs and Factors of differentiation

Chart on Overview on criticality of inputs and factors of differentiation

2.3 Factors of disruption

Chart on Overview on factors of disruption

2.4 Impact of drivers and challenges

Chart on Impact of drivers and challenges in 2024 and 2029

3. Market Landscape

3.1 Market ecosystem

Chart on Parent Market
Data Table on - Parent Market

3.2 Market characteristics

Chart on Market characteristics analysis

3.3 Value chain analysis

Chart on Value chain analysis

4. Market Sizing

4.1 Market definition

Data Table on Offerings of companies included in the market definition

4.2 Market segment analysis

Market segments

4.3 Market size 2024

4.4 Market outlook: Forecast for 2024-2029

Chart on Global - Market size and forecast 2024-2029 ($ million)
Data Table on Global - Market size and forecast 2024-2029 ($ million)
Chart on Global Market: Year-over-year growth 2024-2029 (%)
Data Table on Global Market: Year-over-year growth 2024-2029 (%)

5. Historic Market Size

5.1 Global Grant Management Software Market 2019 - 2023

Historic Market Size - Data Table on Global Grant Management Software Market 2019 - 2023 ($ million)

5.2 Component segment analysis 2019 - 2023

Historic Market Size - Component Segment 2019 - 2023 ($ million)

5.3 Application segment analysis 2019 - 2023

Historic Market Size - Application Segment 2019 - 2023 ($ million)

5.4 Deployment segment analysis 2019 - 2023

Historic Market Size - Deployment Segment 2019 - 2023 ($ million)

5.5 Geography segment analysis 2019 - 2023

Historic Market Size - Geography Segment 2019 - 2023 ($ million)

5.6 Country segment analysis 2019 - 2023

Historic Market Size - Country Segment 2019 - 2023 ($ million)

6. Five Forces Analysis

6.1 Five forces summary

Five forces analysis - Comparison between 2024 and 2029

6.2 Bargaining power of buyers

Bargaining power of buyers - Impact of key factors 2024 and 2029

6.3 Bargaining power of suppliers

Bargaining power of suppliers - Impact of key factors in 2024 and 2029

6.4 Threat of new entrants

Threat of new entrants - Impact of key factors in 2024 and 2029

6.5 Threat of substitutes

Threat of substitutes - Impact of key factors in 2024 and 2029

6.6 Threat of rivalry

Threat of rivalry - Impact of key factors in 2024 and 2029

6.7 Market condition

Chart on Market condition - Five forces 2024 and 2029

7. Market Segmentation by Component

7.1 Market segments

Chart on Component - Market share 2024-2029 (%)
Data Table on Component - Market share 2024-2029 (%)

7.2 Comparison by Component

Chart on Comparison by Component
Data Table on Comparison by Component

7.3 Solutions - Market size and forecast 2024-2029

Chart on Solutions - Market size and forecast 2024-2029 ($ million)
Data Table on Solutions - Market size and forecast 2024-2029 ($ million)
Chart on Solutions - Year-over-year growth 2024-2029 (%)
Data Table on Solutions - Year-over-year growth 2024-2029 (%)

7.4 Services - Market size and forecast 2024-2029

Chart on Services - Market size and forecast 2024-2029 ($ million)
Data Table on Services - Market size and forecast 2024-2029 ($ million)
Chart on Services - Year-over-year growth 2024-2029 (%)
Data Table on Services - Year-over-year growth 2024-2029 (%)

7.5 Market opportunity by Component

Market opportunity by Component ($ million)
Data Table on Market opportunity by Component ($ million)

8. Market Segmentation by Application

8.1 Market segments

Chart on Application - Market share 2024-2029 (%)
Data Table on Application - Market share 2024-2029 (%)

8.2 Comparison by Application

Chart on Comparison by Application
Data Table on Comparison by Application

8.3 Application tracking - Market size and forecast 2024-2029

Chart on Application tracking - Market size and forecast 2024-2029 ($ million)
Data Table on Application tracking - Market size and forecast 2024-2029 ($ million)
Chart on Application tracking - Year-over-year growth 2024-2029 (%)
Data Table on Application tracking - Year-over-year growth 2024-2029 (%)

8.4 Performance and outcomes measurement - Market size and forecast 2024-2029

Chart on Performance and outcomes measurement - Market size and forecast 2024-2029 ($ million)
Data Table on Performance and outcomes measurement - Market size and forecast 2024-2029 ($ million)
Chart on Performance and outcomes measurement - Year-over-year growth 2024-2029 (%)
Data Table on Performance and outcomes measurement - Year-over-year growth 2024-2029 (%)

8.5 Collaboration - Market size and forecast 2024-2029

Chart on Collaboration - Market size and forecast 2024-2029 ($ million)
Data Table on Collaboration - Market size and forecast 2024-2029 ($ million)
Chart on Collaboration - Year-over-year growth 2024-2029 (%)
Data Table on Collaboration - Year-over-year growth 2024-2029 (%)

8.6 Others - Market size and forecast 2024-2029

Chart on Others - Market size and forecast 2024-2029 ($ million)
Data Table on Others - Market size and forecast 2024-2029 ($ million)
Chart on Others - Year-over-year growth 2024-2029 (%)
Data Table on Others - Year-over-year growth 2024-2029 (%)

8.7 Market opportunity by Application

Market opportunity by Application ($ million)
Data Table on Market opportunity by Application ($ million)

9. Market Segmentation by Deployment

9.1 Market segments

Chart on Deployment - Market share 2024-2029 (%)
Data Table on Deployment - Market share 2024-2029 (%)

9.2 Comparison by Deployment

Chart on Comparison by Deployment
Data Table on Comparison by Deployment

9.3 Cloud - Market size and forecast 2024-2029

Chart on Cloud - Market size and forecast 2024-2029 ($ million)
Data Table on Cloud - Market size and forecast 2024-2029 ($ million)
Chart on Cloud - Year-over-year growth 2024-2029 (%)
Data Table on Cloud - Year-over-year growth 2024-2029 (%)

9.4 On-premises - Market size and forecast 2024-2029

Chart on On-premises - Market size and forecast 2024-2029 ($ million)
Data Table on On-premises - Market size and forecast 2024-2029 ($ million)
Chart on On-premises - Year-over-year growth 2024-2029 (%)
Data Table on On-premises - Year-over-year growth 2024-2029 (%)

9.5 Market opportunity by Deployment

Market opportunity by Deployment ($ million)
Data Table on Market opportunity by Deployment ($ million)

10. Customer Landscape

10.1 Customer landscape overview

Analysis of price sensitivity, lifecycle, customer purchase basket, adoption rates, and purchase criteria

11. Geographic Landscape

11.1 Geographic segmentation

Chart on Market share by geography 2024-2029 (%)
Data Table on Market share by geography 2024-2029 (%)

11.2 Geographic comparison

Chart on Geographic comparison
Data Table on Geographic comparison

11.3 North America - Market size and forecast 2024-2029

Chart on North America - Market size and forecast 2024-2029 ($ million)
Data Table on North America - Market size and forecast 2024-2029 ($ million)
Chart on North America - Year-over-year growth 2024-2029 (%)
Data Table on North America - Year-over-year growth 2024-2029 (%)
Chart on Regional Comparison - North America
Data Table on Regional Comparison - North America

11.3.1 US - Market size and forecast 2024-2029

Chart on US - Market size and forecast 2024-2029 ($ million)
Data Table on US - Market size and forecast 2024-2029 ($ million)
Chart on US - Year-over-year growth 2024-2029 (%)
Data Table on US - Year-over-year growth 2024-2029 (%)

11.3.2 Canada - Market size and forecast 2024-2029

Chart on Canada - Market size and forecast 2024-2029 ($ million)
Data Table on Canada - Market size and forecast 2024-2029 ($ million)
Chart on Canada - Year-over-year growth 2024-2029 (%)
Data Table on Canada - Year-over-year growth 2024-2029 (%)

11.3.3 Mexico - Market size and forecast 2024-2029

Chart on Mexico - Market size and forecast 2024-2029 ($ million)
Data Table on Mexico - Market size and forecast 2024-2029 ($ million)
Chart on Mexico - Year-over-year growth 2024-2029 (%)
Data Table on Mexico - Year-over-year growth 2024-2029 (%)

11.4 Europe - Market size and forecast 2024-2029

Chart on Europe - Market size and forecast 2024-2029 ($ million)
Data Table on Europe - Market size and forecast 2024-2029 ($ million)
Chart on Europe - Year-over-year growth 2024-2029 (%)
Data Table on Europe - Year-over-year growth 2024-2029 (%)
Chart on Regional Comparison - Europe
Data Table on Regional Comparison - Europe

11.4.1 UK - Market size and forecast 2024-2029

Chart on UK - Market size and forecast 2024-2029 ($ million)
Data Table on UK - Market size and forecast 2024-2029 ($ million)
Chart on UK - Year-over-year growth 2024-2029 (%)
Data Table on UK - Year-over-year growth 2024-2029 (%)

11.4.2 Germany - Market size and forecast 2024-2029

Chart on Germany - Market size and forecast 2024-2029 ($ million)
Data Table on Germany - Market size and forecast 2024-2029 ($ million)
Chart on Germany - Year-over-year growth 2024-2029 (%)
Data Table on Germany - Year-over-year growth 2024-2029 (%)

11.4.3 France - Market size and forecast 2024-2029

Chart on France - Market size and forecast 2024-2029 ($ million)
Data Table on France - Market size and forecast 2024-2029 ($ million)
Chart on France - Year-over-year growth 2024-2029 (%)
Data Table on France - Year-over-year growth 2024-2029 (%)

11.4.4 Italy - Market size and forecast 2024-2029

Chart on Italy - Market size and forecast 2024-2029 ($ million)
Data Table on Italy - Market size and forecast 2024-2029 ($ million)
Chart on Italy - Year-over-year growth 2024-2029 (%)
Data Table on Italy - Year-over-year growth 2024-2029 (%)

11.4.5 Spain - Market size and forecast 2024-2029

Chart on Spain - Market size and forecast 2024-2029 ($ million)
Data Table on Spain - Market size and forecast 2024-2029 ($ million)
Chart on Spain - Year-over-year growth 2024-2029 (%)
Data Table on Spain - Year-over-year growth 2024-2029 (%)

11.4.6 The Netherlands - Market size and forecast 2024-2029

Chart on The Netherlands - Market size and forecast 2024-2029 ($ million)
Data Table on The Netherlands - Market size and forecast 2024-2029 ($ million)
Chart on The Netherlands - Year-over-year growth 2024-2029 (%)
Data Table on The Netherlands - Year-over-year growth 2024-2029 (%)

11.5 APAC - Market size and forecast 2024-2029

Chart on APAC - Market size and forecast 2024-2029 ($ million)
Data Table on APAC - Market size and forecast 2024-2029 ($ million)
Chart on APAC - Year-over-year growth 2024-2029 (%)
Data Table on APAC - Year-over-year growth 2024-2029 (%)
Chart on Regional Comparison - APAC
Data Table on Regional Comparison - APAC

11.5.1 China - Market size and forecast 2024-2029

Chart on China - Market size and forecast 2024-2029 ($ million)
Data Table on China - Market size and forecast 2024-2029 ($ million)
Chart on China - Year-over-year growth 2024-2029 (%)
Data Table on China - Year-over-year growth 2024-2029 (%)

11.5.2 India - Market size and forecast 2024-2029

Chart on India - Market size and forecast 2024-2029 ($ million)
Data Table on India - Market size and forecast 2024-2029 ($ million)
Chart on India - Year-over-year growth 2024-2029 (%)
Data Table on India - Year-over-year growth 2024-2029 (%)

11.5.3 Japan - Market size and forecast 2024-2029

Chart on Japan - Market size and forecast 2024-2029 ($ million)
Data Table on Japan - Market size and forecast 2024-2029 ($ million)
Chart on Japan - Year-over-year growth 2024-2029 (%)
Data Table on Japan - Year-over-year growth 2024-2029 (%)

11.5.4 Australia - Market size and forecast 2024-2029

Chart on Australia - Market size and forecast 2024-2029 ($ million)
Data Table on Australia - Market size and forecast 2024-2029 ($ million)
Chart on Australia - Year-over-year growth 2024-2029 (%)
Data Table on Australia - Year-over-year growth 2024-2029 (%)

11.5.5 South Korea - Market size and forecast 2024-2029

Chart on South Korea - Market size and forecast 2024-2029 ($ million)
Data Table on South Korea - Market size and forecast 2024-2029 ($ million)
Chart on South Korea - Year-over-year growth 2024-2029 (%)
Data Table on South Korea - Year-over-year growth 2024-2029 (%)

11.5.6 Indonesia - Market size and forecast 2024-2029

Chart on Indonesia - Market size and forecast 2024-2029 ($ million)
Data Table on Indonesia - Market size and forecast 2024-2029 ($ million)
Chart on Indonesia - Year-over-year growth 2024-2029 (%)
Data Table on Indonesia - Year-over-year growth 2024-2029 (%)

11.6 South America - Market size and forecast 2024-2029

Chart on South America - Market size and forecast 2024-2029 ($ million)
Data Table on South America - Market size and forecast 2024-2029 ($ million)
Chart on South America - Year-over-year growth 2024-2029 (%)
Data Table on South America - Year-over-year growth 2024-2029 (%)
Chart on Regional Comparison - South America
Data Table on Regional Comparison - South America

11.6.1 Brazil - Market size and forecast 2024-2029

Chart on Brazil - Market size and forecast 2024-2029 ($ million)
Data Table on Brazil - Market size and forecast 2024-2029 ($ million)
Chart on Brazil - Year-over-year growth 2024-2029 (%)
Data Table on Brazil - Year-over-year growth 2024-2029 (%)

11.6.2 Argentina - Market size and forecast 2024-2029

Chart on Argentina - Market size and forecast 2024-2029 ($ million)
Data Table on Argentina - Market size and forecast 2024-2029 ($ million)
Chart on Argentina - Year-over-year growth 2024-2029 (%)
Data Table on Argentina - Year-over-year growth 2024-2029 (%)

11.6.3 Chile - Market size and forecast 2024-2029

Chart on Chile - Market size and forecast 2024-2029 ($ million)
Data Table on Chile - Market size and forecast 2024-2029 ($ million)
Chart on Chile - Year-over-year growth 2024-2029 (%)
Data Table on Chile - Year-over-year growth 2024-2029 (%)

11.7 Middle East and Africa - Market size and forecast 2024-2029

Chart on Middle East and Africa - Market size and forecast 2024-2029 ($ million)
Data Table on Middle East and Africa - Market size and forecast 2024-2029 ($ million)
Chart on Middle East and Africa - Year-over-year growth 2024-2029 (%)
Data Table on Middle East and Africa - Year-over-year growth 2024-2029 (%)
Chart on Regional Comparison - Middle East and Africa
Data Table on Regional Comparison - Middle East and Africa

11.7.1 UAE - Market size and forecast 2024-2029

Chart on UAE - Market size and forecast 2024-2029 ($ million)
Data Table on UAE - Market size and forecast 2024-2029 ($ million)
Chart on UAE - Year-over-year growth 2024-2029 (%)
Data Table on UAE - Year-over-year growth 2024-2029 (%)

11.7.2 Saudi Arabia - Market size and forecast 2024-2029

Chart on Saudi Arabia - Market size and forecast 2024-2029 ($ million)
Data Table on Saudi Arabia - Market size and forecast 2024-2029 ($ million)
Chart on Saudi Arabia - Year-over-year growth 2024-2029 (%)
Data Table on Saudi Arabia - Year-over-year growth 2024-2029 (%)

11.7.3 South Africa - Market size and forecast 2024-2029

Chart on South Africa - Market size and forecast 2024-2029 ($ million)
Data Table on South Africa - Market size and forecast 2024-2029 ($ million)
Chart on South Africa - Year-over-year growth 2024-2029 (%)
Data Table on South Africa - Year-over-year growth 2024-2029 (%)

11.7.4 Egypt - Market size and forecast 2024-2029

Chart on Egypt - Market size and forecast 2024-2029 ($ million)
Data Table on Egypt - Market size and forecast 2024-2029 ($ million)
Chart on Egypt - Year-over-year growth 2024-2029 (%)
Data Table on Egypt - Year-over-year growth 2024-2029 (%)

11.7.5 Nigeria - Market size and forecast 2024-2029

Chart on Nigeria - Market size and forecast 2024-2029 ($ million)
Data Table on Nigeria - Market size and forecast 2024-2029 ($ million)
Chart on Nigeria - Year-over-year growth 2024-2029 (%)
Data Table on Nigeria - Year-over-year growth 2024-2029 (%)

11.8 Market opportunity by geography

Market opportunity by geography ($ million)
Data Tables on Market opportunity by geography ($ million)

12. Drivers, Challenges, and Opportunity

12.1 Market drivers

Escalating complexity in regulatory compliance and funder reporting mandates
Accelerated digital transformation and cloud technology adoption within nonprofit and public sectors
Growing emphasis on data analytics and demonstrable impact measurement

12.2 Market challenges

Prohibitive total cost of ownership and resource scarcity in end-user organizations
Heightened concerns over data security and regulatory privacy compliance
Complexity of integration with disparate and legacy institutional systems

12.3 Impact of drivers and challenges

Impact of drivers and challenges in 2024 and 2029

12.4 Market opportunities

Proliferation of artificial intelligence and predictive analytics
Advanced analytics for impact measurement and ESG compliance
Hyper-automation and deep ecosystem integration

13. Competitive Landscape

13.1 Overview

13.2

Overview on criticality of inputs and factors of differentiation

13.3 Landscape disruption

Overview on factors of disruption

13.4 Industry risks

Impact of key risks on business

14. Competitive Analysis

14.1 Companies profiled

Companies covered

14.2 Company ranking index

14.3 Market positioning of companies

Matrix on companies position and classification

14.4 Benevity

Benevity - Overview
Benevity - Product / Service
Benevity - Key offerings
SWOT

14.5 Blackbaud Inc.

Blackbaud Inc. - Overview
Blackbaud Inc. - Product / Service
Blackbaud Inc. - Key offerings
SWOT

14.6 Bonterra LLC

Bonterra LLC - Overview
Bonterra LLC - Product / Service
Bonterra LLC - Key offerings
SWOT

14.7 Cayuse, LLC

Cayuse, LLC - Overview
Cayuse, LLC - Product / Service
Cayuse, LLC - Key offerings
SWOT

14.8 Fluxx

Fluxx - Overview
Fluxx - Product / Service
Fluxx - Key offerings
SWOT

14.9 Foundant Technologies, Inc

Foundant Technologies, Inc - Overview
Foundant Technologies, Inc - Product / Service
Foundant Technologies, Inc - Key offerings
SWOT

14.10 GrantVantage

GrantVantage - Overview
GrantVantage - Product / Service
GrantVantage - Key offerings
SWOT

14.11 Kuali, Inc

Kuali, Inc - Overview
Kuali, Inc - Product / Service
Kuali, Inc - Key offerings
SWOT

14.12 Optimy

Optimy - Overview
Optimy - Product / Service
Optimy - Key offerings
SWOT

14.13 Oracle Corp.

Oracle Corp. - Overview
Oracle Corp. - Business segments
Oracle Corp. - Key news
Oracle Corp. - Key offerings
Oracle Corp. - Segment focus
SWOT

14.14 Sage Group Plc

Sage Group Plc - Overview
Sage Group Plc - Business segments
Sage Group Plc - Key news
Sage Group Plc - Key offerings
Sage Group Plc - Segment focus
SWOT

14.15 Salesforce Inc.

Salesforce Inc. - Overview
Salesforce Inc. - Product / Service
Salesforce Inc. - Key news
Salesforce Inc. - Key offerings
SWOT

14.16 SmartSimple Software Inc

SmartSimple Software Inc - Overview
SmartSimple Software Inc - Product / Service
SmartSimple Software Inc - Key offerings
SWOT

14.17 Submittable Co.

Submittable Co. - Overview
Submittable Co. - Product / Service
Submittable Co. - Key offerings
SWOT

14.18 Workday Inc.

Workday Inc. - Overview
Workday Inc. - Product / Service
Workday Inc. - Key news
Workday Inc. - Key offerings
SWOT

15. Appendix

15.1 Scope of the report

Market definition
Objectives
Notes and caveats

15.2 Inclusions and exclusions checklist

Inclusions checklist
Exclusions checklist

15.3 Currency conversion rates for US$

15.4 Research methodology

15.5 Data procurement

Information sources

15.6 Data validation

15.7 Validation techniques employed for market sizing

15.8 Data synthesis

15.9 360 degree market analysis

15.10 List of abbreviations

Research Methodology

Technavio presents a detailed picture of the market by way of study, synthesis, and summation of data from multiple sources. The analysts have presented the various facets of the market with a particular focus on identifying the key industry influencers. The data thus presented is comprehensive, reliable, and the result of extensive research, both primary and secondary.

INFORMATION SOURCES

Primary sources

  • Manufacturers and suppliers
  • Channel partners
  • Industry experts
  • Strategic decision makers

Secondary sources

  • Industry journals and periodicals
  • Government data
  • Financial reports of key industry players
  • Historical data
  • Press releases

DATA ANALYSIS

Data Synthesis

  • Collation of data
  • Estimation of key figures
  • Analysis of derived insights

Data Validation

  • Triangulation with data models
  • Reference against proprietary databases
  • Corroboration with industry experts

REPORT WRITING

Qualitative

  • Market drivers
  • Market challenges
  • Market trends
  • Five forces analysis

Quantitative

  • Market size and forecast
  • Market segmentation
  • Geographical insights
  • Competitive landscape

Interested in this report?

Get your sample now to see our research methodology and insights!

Download Now

Frequently Asked Questions

Grant Management Software market growth will increase by USD 1524.1 million during 2025-2029.

The Grant Management Software market is expected to grow at a CAGR of 10.4% during 2025-2029.

Grant Management Software market is segmented by Component (Solutions, Services) Application (Application tracking, Performance and outcomes measurement, Collaboration, Others) Deployment (Cloud, On-premises)

Amplifund, Benevity, Blackbaud Inc., Bonterra LLC, Cayuse, LLC, CommunityForce Inc., Fluxx, Foundant Technologies, Inc, GivingData LLC, GrantVantage, Kuali, Inc, Optimy, Oracle Corp., Sage Group Plc, Salesforce Inc., SmartSimple Software Inc, Submittable Co., Workday Inc. are a few of the key vendors in the Grant Management Software market.

North America will register the highest growth rate of 31.8% among the other regions. Therefore, the Grant Management Software market in North America is expected to garner significant business opportunities for the vendors during the forecast period.

US, Canada, Mexico, UK, Germany, France, Italy, Spain, The Netherlands, China, India, Japan, Australia, South Korea, Indonesia, Brazil, Argentina, Chile, UAE, Saudi Arabia, South Africa, Egypt, Nigeria

  • Escalating complexity in regulatory compliance and funder reporting mandates is the driving factor this market.

The Grant Management Software market vendors should focus on grabbing business opportunities from the Component segment as it accounted for the largest market share in the base year.