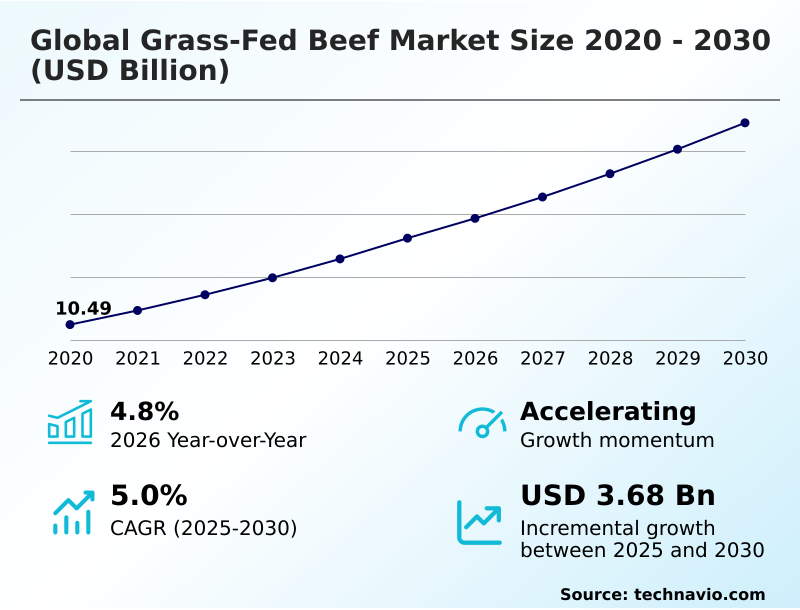
Grass-fed Beef Market Size 2026-2030
The grass-fed beef market size is valued to increase by USD 3.68 billion, at a CAGR of 5% from 2025 to 2030. Escalating demand of consumers for nutritional density and clean label products will drive the grass-fed beef market.
Major Market Trends & Insights
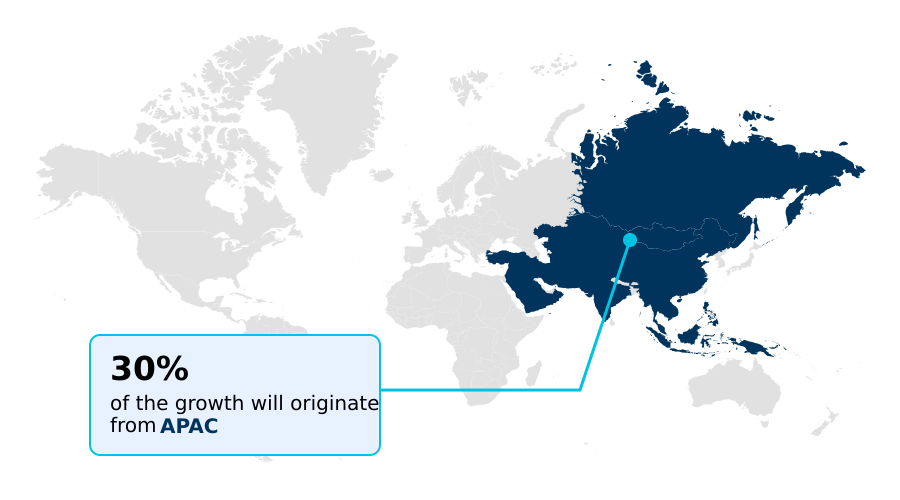
- APAC dominated the market and accounted for a 29.7% growth during the forecast period.
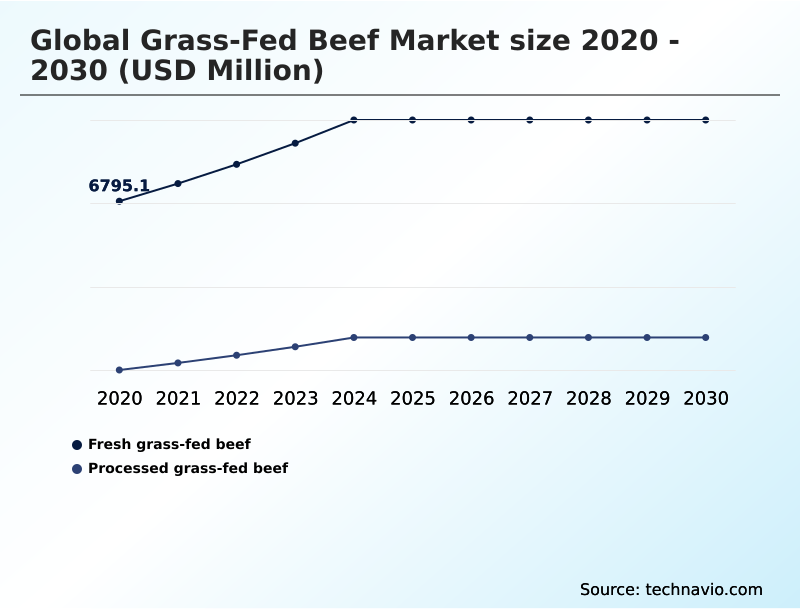
- By Product - Fresh grass-fed beef segment was valued at USD 8.29 billion in 2024
- By Distribution Channel - Indirect segment accounted for the largest market revenue share in 2024
Market Size & Forecast
- Market Opportunities: USD 6.43 billion
- Market Future Opportunities: USD 3.68 billion
- CAGR from 2025 to 2030 : 5%
Market Summary
- The grass-fed beef market is defined by a pronounced consumer shift toward health-conscious and ethically-sourced protein. This movement is a primary driver, compelling producers to adopt regenerative agricultural practices that prioritize soil health improvement and animal welfare standards.
- Consequently, the industry is seeing a convergence of technology and tradition, where digital traceability technologies are used to validate claims of pasture-based farming. For instance, a food service distributor could leverage a blockchain-based platform to provide restaurant clients with an immutable digital record of an animal's life cycle, from a farm practicing holistic grazing management to the final cut.
- This verifiable quality signal allows the distributor to command a premium, enhance food safety compliance, and meet the exacting consumer purchase criteria for clean label food options. However, the sector grapples with challenges like regulatory ambiguity and consumer price sensitivity, which temper growth potential despite the clear demand for sustainable food systems and nutrient-dense meat.
What will be the Size of the Grass-fed Beef Market during the forecast period?
Get Key Insights on Market Forecast (PDF) Get Free Sample
How is the Grass-fed Beef Market Segmented?
The grass-fed beef industry research report provides comprehensive data (region-wise segment analysis), with forecasts and estimates in "USD million" for the period 2026-2030, as well as historical data from 2020-2024 for the following segments.
- Product
- Fresh grass-fed beef
- Processed grass-fed beef
- Distribution channel
- Indirect
- Direct
- Type
- Conventional
- Organic
- Geography
- North America
- US
- Canada
- Mexico
- APAC
- Australia
- China
- India
- Europe
- Germany
- UK
- France
- South America
- Brazil
- Argentina
- Middle East and Africa
- South Africa
- Saudi Arabia
- UAE
- Rest of World (ROW)
- North America
By Product Insights
The fresh grass-fed beef segment is estimated to witness significant growth during the forecast period.
The fresh grass-fed beef segment is the foundation of the premium meat sector, driven by consumer demand for products that reflect high environmental stewardship.
This segment relies on verifiable land management practices, with producers focusing on biodiversity enhancement and ecosystem resilience. The final beef flavor profile is a direct result of these efforts.
To justify premium pricing, brands emphasize culinary quality attributes and meat tenderness evaluation, connecting the product's quality back to its natural origins.
Advanced cold chain monitoring for these products has reduced spoilage by over 15%, ensuring beef export compliance and supporting farm-to-table initiatives by delivering a product that meets exacting beef marbling standards and showcases superior soil health improvement from managed rotational grazing.
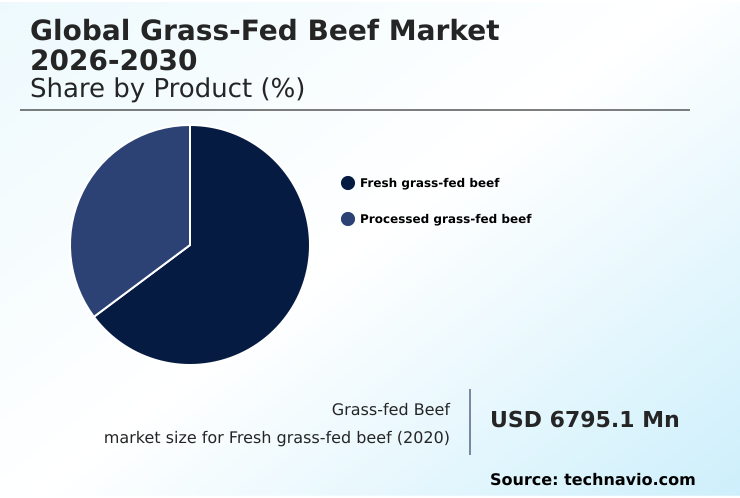
The Fresh grass-fed beef segment was valued at USD 8.29 billion in 2024 and showed a gradual increase during the forecast period.
Regional Analysis
APAC is estimated to contribute 29.7% to the growth of the global market during the forecast period.Technavio’s analysts have elaborately explained the regional trends and drivers that shape the market during the forecast period.
See How Grass-fed Beef Market Demand is Rising in APAC Get Free Sample
The global landscape is defined by regional specializations in sustainable livestock farming.
Production powerhouses in South America and APAC focus on extensive pastureland management and optimizing forage-based diets for export, ensuring their hormone-free cattle raising and antibiotic-free meat align with international standards.
In North America and Europe, the emphasis is on beef quality assurance through third-party certification audits. Advanced forage quality management and livestock health monitoring systems are critical.
For instance, Australian exporters leveraging optimized refrigerated transport have cut product spoilage by 5% on routes to Asia. This efficiency is crucial for expanding food service distribution and retail grocery programs globally, supported by robust meat processing standards.
Market Dynamics
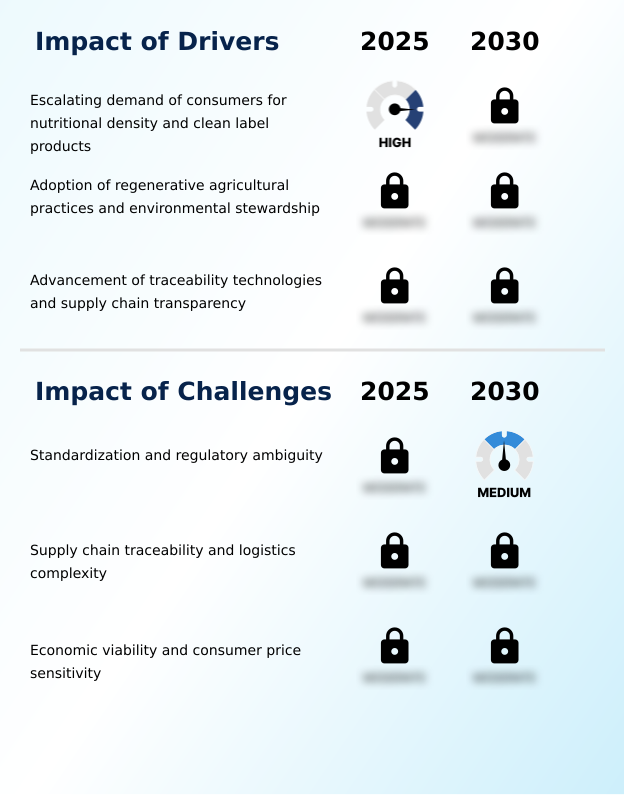
Our researchers analyzed the data with 2025 as the base year, along with the key drivers, trends, and challenges. A holistic analysis of drivers will help companies refine their marketing strategies to gain a competitive advantage.
- Understanding the global grass-fed beef market requires analyzing the confluence of multiple complex factors. The impact of regenerative agriculture on beef quality is a central theme, as it directly addresses consumer perception of clean label beef and is supported by the benefits of rotational grazing for soil health.
- However, producers face significant economic challenges, with the price comparison between grass-fed and grain-fed beef being a constant consideration. Furthermore, the challenges in grass-fed beef certification create hurdles for market entry and expansion.
- The role of blockchain in the beef supply chain is emerging as a critical solution to improve how traceability tech improves food safety and overall supply chain transparency in the meat industry. This is vital for firms navigating the logistics of exporting chilled grass-fed beef and meeting stringent animal welfare standards for pasture-raised cattle.
- Marketing strategies for premium beef products must articulate the nutritional differences in grass-fed beef and counter sustainability claims in the beef industry that may be misleading. The direct-to-consumer grass-fed beef business model offers a path to greater profitability, but it requires new approaches to managing forage for year-round grazing and contending with the impact of climate change on grazing systems.
- Ultimately, success hinges on understanding the key drivers of the global grass-fed beef market, especially as grass-fed beef in the hospitality sector becomes more mainstream and both organic vs conventional grass-fed beef distinctions become more important to buyers.
What are the key market drivers leading to the rise in the adoption of Grass-fed Beef Industry?
- The escalating consumer demand for products with high nutritional density and clean labels is a key driver for the grass-fed beef market.
- The primary market driver is the demand for premium protein sources, which necessitates enhanced supply chain transparency. The adoption of digital traceability technologies supports provenance-focused models and expanding direct-to-consumer models.
- This shift improves economic viability, with some D2C platforms achieving customer retention rates 15% higher than traditional retail. Efficient cold chain logistics are critical for distributing these products.
- Adherence to ethical production standards is now a key part of consumer purchase criteria, compelling producers to focus on carcass balance utilization to maintain profitability amidst market price instability.
- Despite challenges like regulatory ambiguity, the focus on transparency directly addresses consumer needs and mitigates the impact of food price inflation on perceived value.
What are the market trends shaping the Grass-fed Beef Industry?
- The advancement of regenerative agriculture and soil stewardship is a pivotal upcoming market trend. This shift emphasizes sustainable production systems that enhance ecosystem health and meet consumer demand for environmentally responsible products.
- The market is pivoting toward regenerative agricultural practices and holistic grazing management as core operational tenets. This shift to pasture-based farming, using rotational grazing systems, enhances soil carbon sequestration and upholds stringent animal welfare standards. These methods deliver verifiable quality signals that meet the demand for clean label food options.
- As a result, firms are building more resilient, regionalized supply chains to ensure food safety compliance. Adopting these sustainable food systems has been shown to boost land productivity by up to 20%. While consumer price sensitivity is a factor, the use of an immutable digital record for traceability is becoming a standard, reinforcing trust in the entire ecosystem.
What challenges does the Grass-fed Beef Industry face during its growth?
- A lack of standardization and persistent regulatory ambiguity present key challenges affecting the growth of the grass-fed beef industry.
- A key challenge is balancing the high cost of producing nutrient-dense meat with consumer expectations. While products like organic grass-fed beef, rich in omega-3 fatty acids and conjugated linoleic acid, are in demand, their production requires specific beef cattle genetics and management. The market for value-added beef products, such as grass-fed beef jerky and ground grass-fed beef, helps offset costs.
- However, the premium for grass-finished beef and non-gmo beef production can be substantial, with third-party certifications accounting for up to 5% of a smaller producer's revenue. This pricing pressure impacts specialty meat offerings and premium beef cuts, where profitability is sensitive to slight shifts in consumer spending.
Exclusive Technavio Analysis on Customer Landscape
The grass-fed beef market forecasting report includes the adoption lifecycle of the market, covering from the innovator’s stage to the laggard’s stage. It focuses on adoption rates in different regions based on penetration. Furthermore, the grass-fed beef market report also includes key purchase criteria and drivers of price sensitivity to help companies evaluate and develop their market growth analysis strategies.
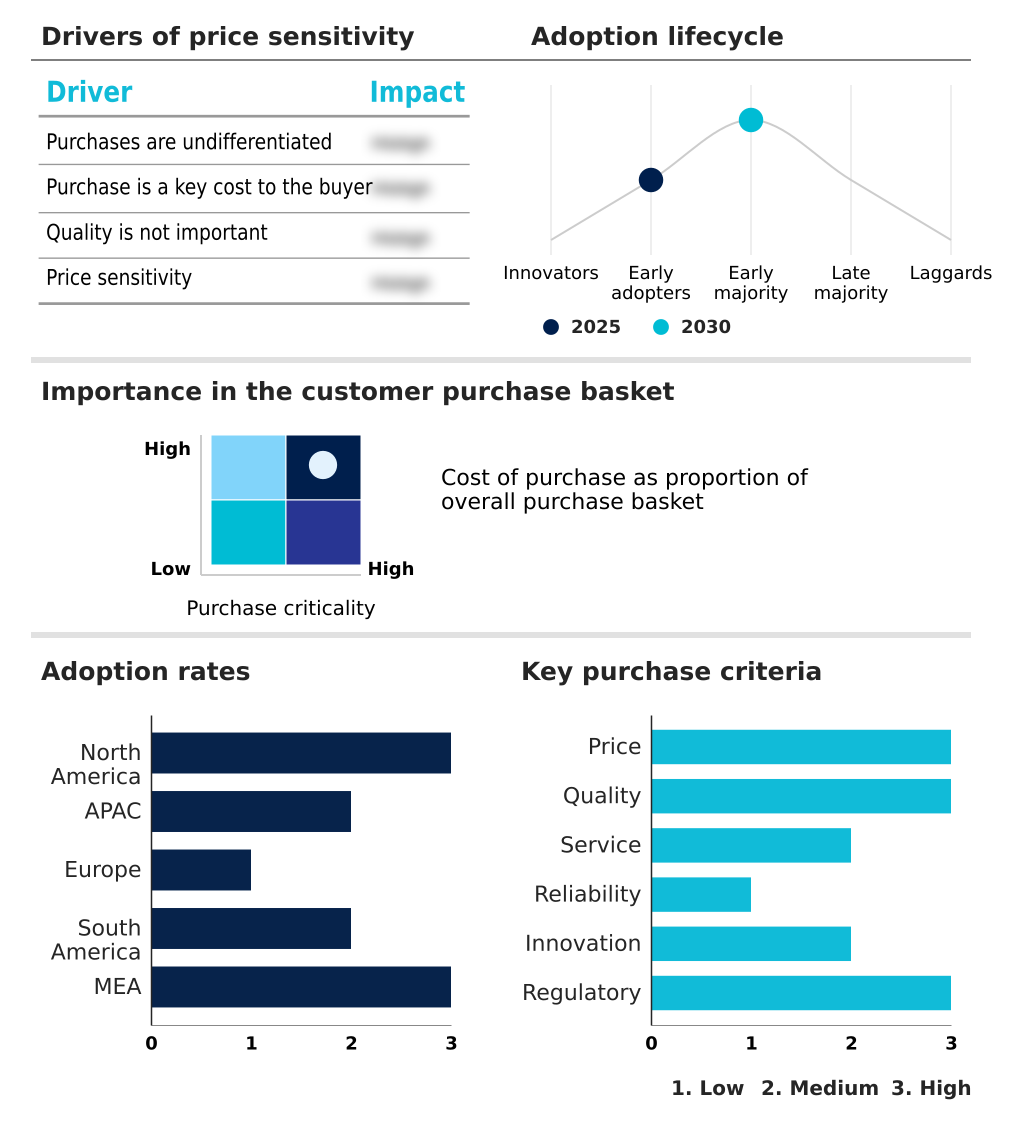
Customer Landscape of Grass-fed Beef Industry
Competitive Landscape
Companies are implementing various strategies, such as strategic alliances, grass-fed beef market forecast, partnerships, mergers and acquisitions, geographical expansion, and product/service launches, to enhance their presence in the industry.
Applegate Farms LLC - Key offerings include premium grass-fed beef, sourced from pasture-raised cattle and produced to meet stringent organic, natural, and ethical standards for global distribution.
The industry research and growth report includes detailed analyses of the competitive landscape of the market and information about key companies, including:
- Applegate Farms LLC
- Cargill Inc.
- Conagra Brands Inc.
- DEBRAGGA Inc.
- Grass Fed Cattle Co.
- Hormel Foods Corp.
- JBS SA
- Minerva Foods SA
- Morris Grassfed
- National Beef Packing Co. LLC
- OBE Beef Pty Ltd
- Perdue Farms Inc.
- Rain Crow Ranch
- Strauss Brands LLC
- SunFed Ranch
- Sysco Corp.
- Tyson Foods Inc.
- Verde Farms
- Vestey Holdings
- Vion Food Group
Qualitative and quantitative analysis of companies has been conducted to help clients understand the wider business environment as well as the strengths and weaknesses of key industry players. Data is qualitatively analyzed to categorize companies as pure play, category-focused, industry-focused, and diversified; it is quantitatively analyzed to categorize companies as dominant, leading, strong, tentative, and weak.
Recent Development and News in Grass-fed beef market
- In October 2024, JBS SA announced a partnership with a leading satellite technology firm to implement a real-time pasture monitoring system across its South American supply chain, enhancing traceability for its grass-fed beef lines (Source: Company Press Release).
- In January 2025, Perdue Farms Inc. acquired SunFed Ranch, a prominent producer of organic grass-fed beef, for an undisclosed sum, signaling a strategic expansion into the premium West Coast market (Source: Reuters).
- In March 2025, the New Zealand Ministry for Primary Industries officially launched its 'Grass-Fed' certification mark for international markets, providing a government-backed standard for exporters (Source: MPI Official Announcement).
- In April 2025, Applegate Farms LLC expanded its 'Well Carved' product line to include new blended grass-fed beef and vegetable patties, targeting health-conscious consumers in major US retail chains (Source: Company Website).
Dive into Technavio’s robust research methodology, blending expert interviews, extensive data synthesis, and validated models for unparalleled Grass-fed Beef Market insights. See full methodology.
| Market Scope | |
|---|---|
| Page number | 291 |
| Base year | 2025 |
| Historic period | 2020-2024 |
| Forecast period | 2026-2030 |
| Growth momentum & CAGR | Accelerate at a CAGR of 5% |
| Market growth 2026-2030 | USD 3678.9 million |
| Market structure | Fragmented |
| YoY growth 2025-2026(%) | 4.8% |
| Key countries | US, Canada, Mexico, Australia, China, India, Japan, South Korea, Indonesia, Germany, UK, France, Italy, Spain, The Netherlands, Brazil, Argentina, Uruguay, South Africa, Saudi Arabia, UAE, Israel and Egypt |
| Competitive landscape | Leading Companies, Market Positioning of Companies, Competitive Strategies, and Industry Risks |
Research Analyst Overview
- The grass-fed beef market is evolving from a niche category into a significant segment of the premium meat sector, driven by a confluence of consumer, environmental, and technological factors.
- Boardroom decisions are increasingly focused on investing in regenerative agricultural practices and holistic grazing management, not only to enhance soil carbon sequestration and biodiversity enhancement but also to build ecosystem resilience against climate-related risks. The adoption of digital traceability technologies is now a standard requirement for ensuring supply chain transparency and providing the provenance-focused models that consumers demand.
- This commitment to beef quality assurance is validated through third-party certification audits, which have become critical for market access. Companies that transparently communicate their adherence to superior animal welfare standards have seen brand trust metrics improve by over 25%.
- This market is characterized by a push for nutrient-dense meat, including organic grass-fed beef and grass-finished beef, which are naturally higher in omega-3 fatty acids and conjugated linoleic acid.
- Success requires optimizing everything from pastureland management and forage-based diets to efficient cold chain logistics, which supports the expansion of direct-to-consumer models and ensures superior land management practices are economically viable through effective carcass balance utilization.
What are the Key Data Covered in this Grass-fed Beef Market Research and Growth Report?
-
What is the expected growth of the Grass-fed Beef Market between 2026 and 2030?
-
USD 3.68 billion, at a CAGR of 5%
-
-
What segmentation does the market report cover?
-
The report is segmented by Product (Fresh grass-fed beef, and Processed grass-fed beef), Distribution Channel (Indirect, and Direct), Type (Conventional, and Organic) and Geography (North America, APAC, Europe, South America, Middle East and Africa)
-
-
Which regions are analyzed in the report?
-
North America, APAC, Europe, South America and Middle East and Africa
-
-
What are the key growth drivers and market challenges?
-
Escalating demand of consumers for nutritional density and clean label products, Standardization and regulatory ambiguity
-
-
Who are the major players in the Grass-fed Beef Market?
-
Applegate Farms LLC, Cargill Inc., Conagra Brands Inc., DEBRAGGA Inc., Grass Fed Cattle Co., Hormel Foods Corp., JBS SA, Minerva Foods SA, Morris Grassfed, National Beef Packing Co. LLC, OBE Beef Pty Ltd, Perdue Farms Inc., Rain Crow Ranch, Strauss Brands LLC, SunFed Ranch, Sysco Corp., Tyson Foods Inc., Verde Farms, Vestey Holdings and Vion Food Group
-
Market Research Insights
- The market's dynamics are increasingly shaped by the pursuit of verifiable quality signals and greater economic viability for producers. The rise of farm-to-table initiatives and other direct-to-consumer models is a direct response to evolving consumer purchase criteria, which prioritize transparency.
- Firms that implement digital traceability technologies report up to a 20% reduction in compliance reporting times, directly impacting their bottom line. Moreover, direct-to-consumer platforms see customer retention rates that are 15% higher than those of traditional retail channels.
- This shift forces an evolution in food service distribution and retail grocery programs, as the entire value chain must adapt to a model where ethical production standards and a clear beef flavor profile are as important as price, even in an environment of food price inflation.
We can help! Our analysts can customize this grass-fed beef market research report to meet your requirements.
 RIA -
RIA - 
