
Vitamin E Market Size 2024-2028
The vitamin Emarket size is forecast to increase by USD 513.5 billion at a CAGR of 4.5% between 2023 and 2028. The market is experiencing significant growth due to the increasing awareness of its essential role in human and animal nutrition. With the rising prevalence of chronic diseases such as nerve issues, oxidative damage, cholestasis, primary biliary cirrhosis, and short bowel syndrome, the demand for Vitamin E as an antioxidant is surging. The beverage industry and pharmaceuticals industry are major consumers of Vitamin E due to its biological activity in reducing LDL cholesterol levels and offering regulatory support for cardiovascular disorders.
Geographical segmentation reveals that the market is thriving in urbanized regions with growing disposable incomes. In the animal nutrition sector, the poultry industry is a significant consumer due to its role in improving livestock health. Traditional medicine practices continue to fuel demand for Vitamin E in various regions. However, strategic initiatives by market players and the lower consumer demand for synthetic Vitamin E supplements pose challenges to the market growth.

Vitamin E, a powerful antioxidant, is primarily known as tocopherols. In the US market, tocopherols have gained significant attention due to their antioxidant properties that help prevent lipid peroxidation. The animal feed industry is a major consumer of vitamin E, using it to enhance the nutritional value of animal feed, improve animal health, and boost productivity. Cereals, vegetable oils, fruits, nuts, seeds, spreads, and beverages are common food sources of vitamin E for humans. Sunflower, olive, corn, rapeseed, soybean, and nut oils are rich sources of this essential nutrient.
Moreover, in the food industry, vitamin E is used as a food additive to fortify food products and preserve their freshness. The beverage industry also utilizes vitamin E as a food additive, particularly in the production of beverages that undergo oxidative processes. In the pharmaceutical industry, vitamin E is used in the production of dietary supplements and pharmaceutical formulations. The poultry industry also benefits from vitamin E, as it helps maintain the health and productivity of poultry and improves the quality of poultry eggs. Vitamin E plays a crucial role in the human body by acting as a potent antioxidant, protecting LDL cholesterol from oxidative damage. Its antioxidant properties make it an essential nutrient for maintaining overall health and wellness.
Market Segmentation
The market research report provides comprehensive data (region-wise segment analysis), with forecasts and estimates in "USD million" for the period 2024-2028, as well as historical data from 2018-2022 for the following segments.
- Type
- Natural
- Synthetic
- Geography
- North America
- US
- Europe
- Germany
- UK
- APAC
- China
- India
- South America
- Middle East and Africa
- North America
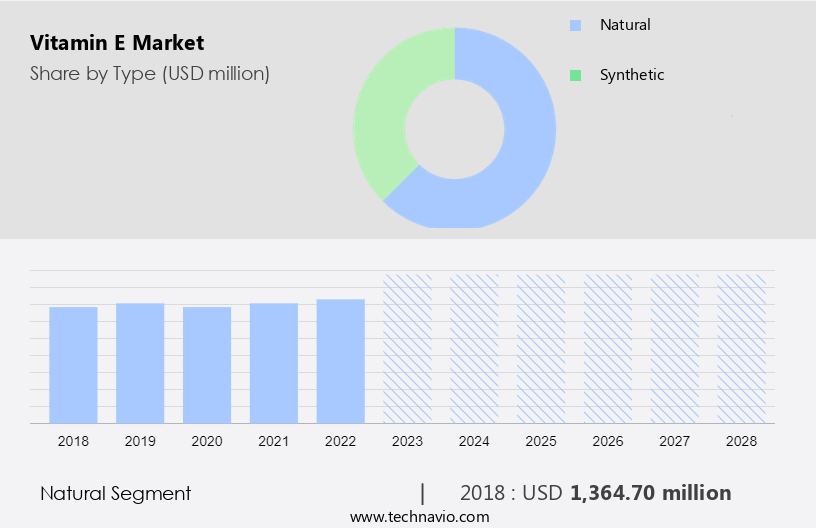
By Type Insights
The natural segment is estimated to witness significant growth during the forecast period. Vitamin E, a naturally occurring fat-soluble antioxidant, is sourced from plant oils, contrasting synthetic vitamin E derived from petroleum. The natural form of vitamin E comprises various tocopherols, such as d-alpha tocopherol, d-alpha tocopherol acetate, d-alpha tocopherol succinate, and mixed tocopherols. Mixed tocopherols consist of natural combinations of beta, gamma, and delta tocopherols. Natural vitamin E is superiorly absorbed by the body due to its intricate molecular structure, which enables specific liver transport proteins to bind more effectively. These proteins facilitate the transportation of vitamin E to other body tissues, contributing to its multifaceted functions, including antioxidant capabilities, immunostimulant, and cholesterol reduction.
Moreover, in the context of health and wellness, vitamin E is incorporated into various applications, including dietary supplements, functional foods, and animal feed additives. Its antioxidant properties aid in preventing blood clots and reducing inflammation, offering medicinal potential for chronic diseases like macular degeneration, Crohn's disease, and cystic fibrosis. Furthermore, vitamin E acts as a calorie reduction agent and an enzyme activity regulator. Its role as a ferroptosis modulator adds to its significance in health and nutrition. The market is influenced by several factors, including supply chain disruptions and raw material costs. Despite these challenges, the demand for natural vitamin E continues to grow due to its health benefits and versatility in various applications.
As consumers increasingly seek out natural ingredients for their dietary supplements and functional foods, the market for natural vitamin E is expected to expand. Additionally, research into the potential therapeutic applications of vitamin E in the prevention and treatment of chronic diseases further strengthens its market position.
Get a glance at the market share of various segments Request Free Sample
The natural segment was valued at USD 1.36 billion in 2018 and showed a gradual increase during the forecast period.
Regional Insights
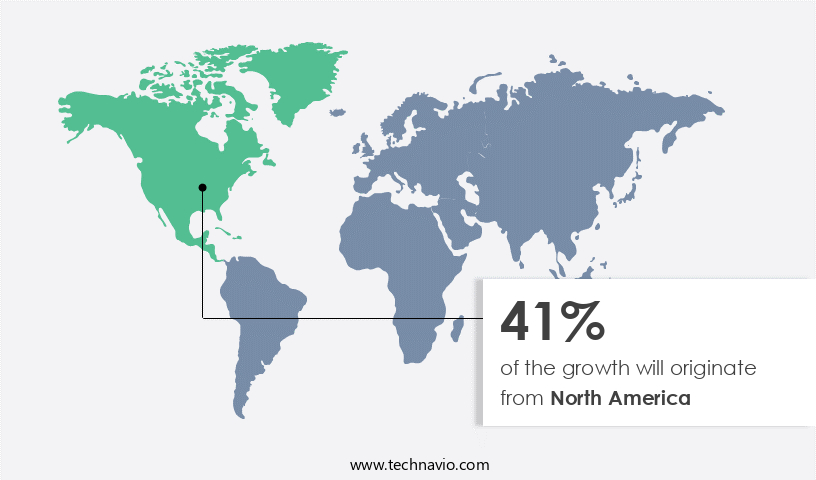
North America is estimated to contribute 41% to the growth of the global market during the forecast period. Technavio's analysts have elaborately explained the regional trends and drivers that shape the market during the forecast period.
For more insights on the market share of various regions Request Free Sample
The North American market is experiencing significant growth due to increasing consumer awareness of the health benefits of this essential nutrient in the US, Mexico, and Canada. The United States is a major producer of vitamin E in North America, with its market expansion driven primarily by the thriving pharmaceutical and dietary supplement industries. Rising health concerns, including the growing prevalence of chronic diseases and vitamin E deficiencies, are fueling demand for vitamin E supplements. Functional foods and natural ingredients containing vitamin E are gaining popularity as consumers seek calorie and cholesterol reduction, as well as immunostimulation and antioxidant capabilities.
Moreover, vitamin E also serves as a ferroptosis modulator and enzyme activity regulator, making it a valuable addition to various industries. In addition to its use as a dietary supplement and functional food ingredient, vitamin E is also employed as an animal feed additive. Vitamin E's medicinal potential extends to the prevention of blood clots, anti-inflammation, and the treatment of conditions such as macular degeneration, Crohn's disease, and cystic fibrosis. However, supply chain disruptions and raw material costs may pose challenges to the market's growth. Despite these obstacles, the market in North America is expected to continue expanding due to its numerous applications and health benefits.
Our researchers analyzed the data with 2023 as the base year, along with the key drivers, trends, and challenges. A holistic analysis of drivers will help companies refine their marketing strategies to gain a competitive advantage.
Market Driver
Growing prevalence of chronic diseases is the key driver of the market. Vitamin E, specifically its tocopherol forms, plays a significant role in various industries, particularly the animal feed sector, due to its antioxidant properties. This vitamin helps prevent lipid peroxidation, a process that can negatively impact animal health. In human consumption, vitamin E is found in cereals, vegetable oils, meat, poultry eggs, fruits, and vegetables. However, with the rise of sedentary lifestyles, desk occupations, and unhealthy eating habits, vitamin E deficiency has become increasingly common. Consequently, there is a growing demand for vitamin E supplements, which offer benefits such as cardiovascular disease prevention, hair loss prevention, and skin care. The market for vitamin E supplements is projected to expand due to the increasing prevalence of chronic diseases, including diabetes, obesity, and cardiovascular diseases, in developed countries like the US, Canada, the UK, Australia, France, and Germany.
Market Trends
Strategic initiatives by market players is the upcoming trend in the market. The market, primarily comprised of tocopherols, is a significant industry, particularly in the animal feed sector, due to its antioxidant properties that help prevent lipid peroxidation in feedstuffs. In human consumption, Vitamin E is found in various food sources like cereals, vegetable oils, meat, poultry eggs, fruits, and vegetables. With the rise of sedentary lifestyles, desk occupations, and unhealthy eating habits, the demand for Vitamin E supplements has surged. Vitamin E deficiency can lead to various health issues, including hair loss prevention, cardiovascular diseases, and skin care. Market players, such as BASF, Kensing, and Prinova, are innovating and expanding their product offerings, including wheat germ oil, to cater to the growing demand for natural Vitamin E components. The competitive landscape is dynamic, with companies adopting strategies like mergers and acquisitions and strategic alliances to strengthen their market position.
Market Challenge
Lower consumer demand for synthetic vitamin E supplements is a key challenge affecting the market growth. The market, specifically the segment of tocopherols, has gained significant attention in the nutraceutical industry due to its antioxidant properties. This vitamin is essential for animals in the feed industry as well as for human consumption in cereals, vegetable oils, meat, poultry eggs, fruits, vegetables, and wheat germ oil. The antioxidant properties of Vitamin E help prevent lipid peroxidation, which is a major cause of cell damage. With sedentary lifestyles, desk occupations, and unhealthy eating habits becoming increasingly common, the demand for Vitamin E supplements has surged. However, consumers are increasingly preferring natural sources of Vitamin E over synthetic supplements due to concerns about side effects. Natural Vitamin E can be derived from vegetable oils, making it a safer and more desirable option. Vitamin E deficiency can lead to hair loss prevention, cardiovascular diseases, and skin care concerns. As a result, the market for natural Vitamin E is expected to grow steadily in the coming years.
Exclusive Customer Landscape
The market forecasting report includes the adoption lifecycle of the market, covering from the innovator's stage to the laggard's stage. It focuses on adoption rates in different regions based on penetration. Furthermore, the report also includes key purchase criteria and drivers of price sensitivity to help companies evaluate and develop their market growth analysis strategies.

Customer Landscape
Key Companies & Market Insights
Companies are implementing various strategies, such as strategic alliances, partnerships, mergers and acquisitions, geographical expansion, and product/service launches, to enhance their presence in the market.
Advanced Organic Materials, SA. - The company offers Vitamin E that includes Sunvolec Sunflower Lecithin which is used for cholesterol reduction, weight loss, Glutamine absorption, and neurological function.
The market research and growth report includes detailed analyses of the competitive landscape of the market and information about key companies, including:
- American River Nutrition LLC
- Amway Corp.
- Antares Health Products, Inc.
- Archer Daniels Midland Co.
- BASF SE
- Beijing Gingko Group
- BIOTECNOLOGIAS APLICADAS SL
- Cargill Inc.
- Herbalife International of America Inc.
- Jilin Beisha Pharmaceutical Co. Ltd.
- Kensing LLC
- Koninklijke DSM NV
- Matrix Life Science
- Merck KGaA
- N. S. Chemicals
- Natures Bounty
- Orah Nutrichem Pvt. Ltd.
- Orochem Technologies Inc.
- PMC Isochem
Qualitative and quantitative analysis of companies has been conducted to help clients understand the wider business environment as well as the strengths and weaknesses of key market players. Data is qualitatively analyzed to categorize companies as pure play, category-focused, industry-focused, and diversified; it is quantitatively analyzed to categorize companies as dominant, leading, strong, tentative, and weak.
Research Analyst Overview
Vitamin E, a powerful antioxidant, is primarily composed of tocopherols. In the animal feed industry, vitamin E functions as an immunostimulant and antioxidant additive, preventing lipid peroxidation and enhancing the immune system in livestock. Tocopherols are also integral to the production of functional foods, dietary supplements, and natural ingredients in various industries. Sedentary lifestyles, desk occupations, and unhealthy eating habits have led to an increased demand for vitamin E in human nutrition. Vitamin E is essential for healthy eyes, skin, and cells, and has been linked to the prevention of chronic diseases such as cardiovascular diseases, diabetes, and certain cancers.
Moreover, vitamin E is found naturally in various foods including cereals, vegetable oils, fruits, vegetables, nuts, and seeds. Wheat germ oil is a rich source of vitamin E. In the cosmetics industry, vitamin E is used in skincare products due to its anti-inflammatory and antioxidant capabilities. Vitamin E acetate is a common form used in sunscreen with high SPF levels. The market is driven by the increasing awareness of health and wellness, and the clean label movement. The market is segmented into cosmetics, human nutrition, and animal nutrition. The production of vitamin E involves the extraction of tocopherols from natural sources, which can be costly.
Further, the market is also subject to supply chain disruptions and regulatory support. Adverse effects of vitamin E include bleeding, lethargy, headaches, and nausea. However, the medicinal potential of vitamin E is vast, with applications in the prevention of blood clots, macular degeneration, Crohn's disease, and cystic fibrosis. The market for vitamin E is expected to grow significantly in the coming years due to its antioxidant capabilities and potential health benefits.
|
Market Scope |
|
|
Report Coverage |
Details |
|
Page number |
138 |
|
Base year |
2023 |
|
Historic period |
2018-2022 |
|
Forecast period |
2024-2028 |
|
Growth momentum & CAGR |
Accelerate at a CAGR of 4.5% |
|
Market growth 2024-2028 |
USD 513.5 million |
|
Market structure |
Fragmented |
|
YoY growth 2023-2024(%) |
4.23 |
|
Regional analysis |
North America, Europe, APAC, South America, and Middle East and Africa |
|
Performing market contribution |
North America at 41% |
|
Key countries |
US, Germany, China, UK, and India |
|
Competitive landscape |
Leading Companies, Market Positioning of Companies, Competitive Strategies, and Industry Risks |
|
Key companies profiled |
Advanced Organic Materials, SA., American River Nutrition LLC, Amway Corp., Antares Health Products, Inc., Archer Daniels Midland Co., BASF SE, Beijing Gingko Group, BIOTECNOLOGIAS APLICADAS SL, Cargill Inc., Herbalife International of America Inc., Jilin Beisha Pharmaceutical Co. Ltd., Kensing LLC, Koninklijke DSM NV, Matrix Life Science, Merck KGaA, N. S. Chemicals, Natures Bounty, Orah Nutrichem Pvt. Ltd., Orochem Technologies Inc., and PMC Isochem |
|
Market dynamics |
Parent market analysis, market growth inducers and obstacles, market forecast, fast-growing and slow-growing segment analysis, COVID-19 impact and recovery analysis and future consumer dynamics, market condition analysis for the forecast period |
|
Customization purview |
If our market report has not included the data that you are looking for, you can reach out to our analysts and get segments customized. |
What are the Key Data Covered in this Market Research and Growth Report?
- CAGR of the market during the forecast period
- Detailed information on factors that will drive the market growth and forecasting between 2024 and 2028
- Precise estimation of the size of the market and its contribution of the market in focus to the parent market
- Accurate predictions about upcoming market growth and trends and changes in consumer behaviour
- Growth of the market across North America, Europe, APAC, South America, and Middle East and Africa
- Thorough analysis of the market's competitive landscape and detailed information about companies
- Comprehensive analysis of factors that will challenge the growth of market companies
We can help! Our analysts can customize this market research report to meet your requirements. Get in touch
 RIA -
RIA - 
