Green Logistics Certification Services Market Analysis, Size, and Forecast 2026-2030: APAC (China, India, and Japan), North America (US, Canada, and Mexico), Europe (Germany, UK, and France), Middle East and Africa (Saudi Arabia, UAE, and South Africa), South America (Brazil, Argentina, and Colombia), and Rest of World (ROW)

Green Logistics Certification Services Market Analysis, Size, and Forecast 2026-2030:
APAC (China, India, and Japan), North America (US, Canada, and Mexico), Europe (Germany, UK, and France), Middle East and Africa (Saudi Arabia, UAE, and South Africa), South America (Brazil, Argentina, and Colombia), and Rest of World (ROW)

Published: Mar 2026 305 Pages SKU: IRTNTR81274

Market Overview at a Glance

$574.4 Mn
Market Opportunity
7.2%
CAGR 2025 - 2030
37.9%
APAC Growth
$641 Mn
Road freight logistics segment 2024

Green Logistics Certification Services Market Size 2026-2030

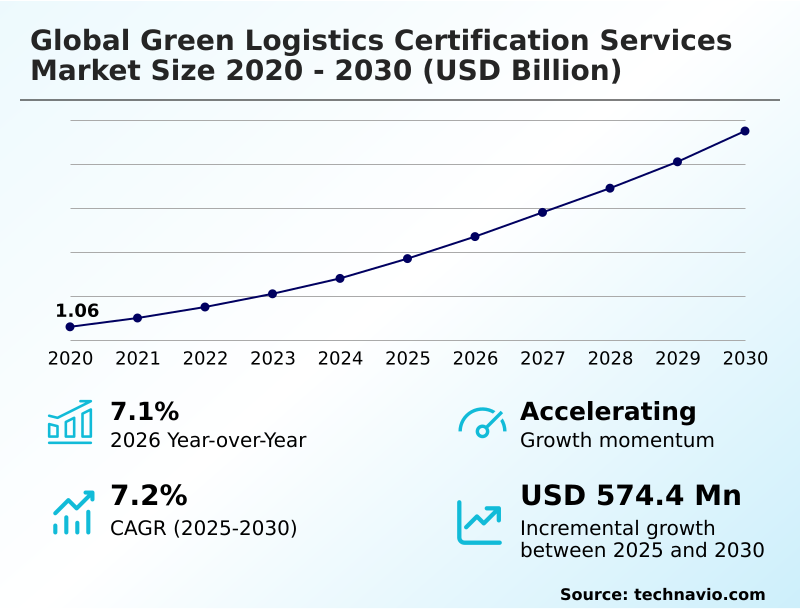
The green logistics certification services market size is valued to increase by USD 574.4 million, at a CAGR of 7.2% from 2025 to 2030. Escalating regulatory pressures and global decarbonization mandates will drive the green logistics certification services market.

Major Market Trends & Insights

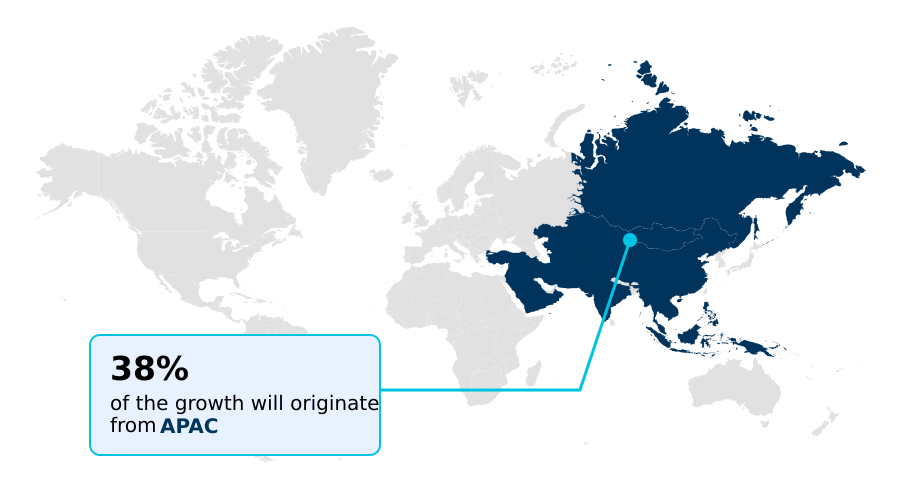
  • APAC dominated the market and accounted for a 37.9% growth during the forecast period.
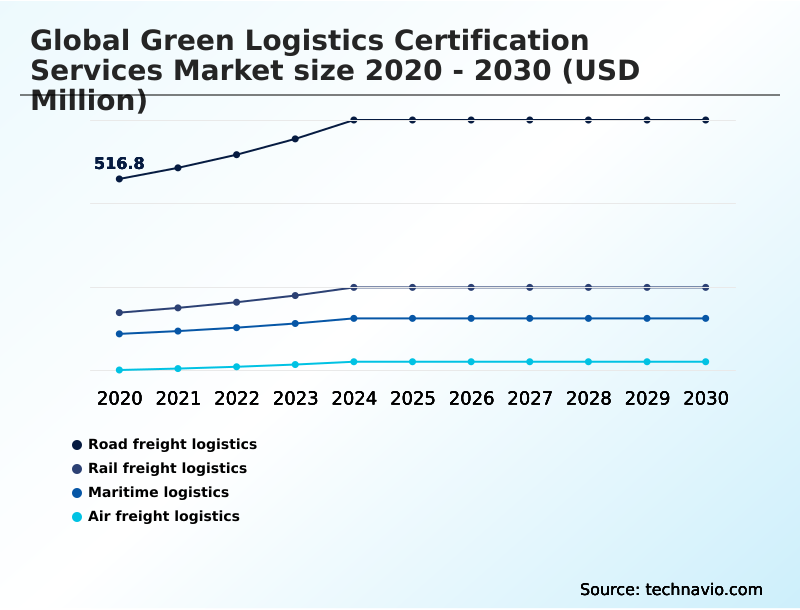
  • By Mode of Transportation - Road freight logistics segment was valued at USD 641 million in 2024
  • By End-user - Logistics service providers segment accounted for the largest market revenue share in 2024

Market Size & Forecast

  • Market Opportunities: USD 891.8 million
  • Market Future Opportunities: USD 574.4 million
  • CAGR from 2025 to 2030 : 7.2%

Market Summary

  • The Green Logistics Certification Services Market is undergoing a significant transformation, propelled by a convergence of stringent regulatory mandates and corporate ESG strategies. Escalating pressures for transparency in scope 3 emissions reporting are compelling organizations to move beyond self-assessment toward independent, third-party validation of their environmental performance.
  • This shift is creating a critical need for services that can provide credible carbon footprint verification and ensure compliance with frameworks like the logistics emissions council (GLEC) framework. Key trends include the integration of technology for predictive compliance monitoring and the expansion of certification to cover circular economy principles and reverse logistics capabilities.
  • For example, a multinational retailer seeking to offer carbon neutral labeling on its products must ensure its entire supply chain, including last-mile delivery emissions, is certified. This involves a comprehensive green logistics audit of its partners, verifying everything from fleet emissions validation to warehouse sustainability assessment.
  • However, the market's progress is moderated by the fragmentation of standards and the high implementation costs, which pose significant barriers for smaller logistics operators. This dynamic creates a landscape where certification is both a prerequisite for market access and a catalyst for operational efficiency.

What will be the Size of the Green Logistics Certification Services Market during the forecast period?

Get Key Insights on Market Forecast (PDF) Request Free Sample

How is the Green Logistics Certification Services Market Segmented?

The green logistics certification services industry research report provides comprehensive data (region-wise segment analysis), with forecasts and estimates in "USD million" for the period 2026-2030, as well as historical data from 2020-2024 for the following segments.

  • Mode of transportation
    • Road freight logistics
    • Rail freight logistics
    • Maritime logistics
    • Air freight logistics
  • End-user
    • Logistics service providers
    • Retail and e-commerce companies
    • Manufacturers and exporters
  • Service type
    • Carbon footprint certification
    • Energy efficiency certification
    • Sustainable supply chain certification
  • Geography
    • APAC
      • China
      • India
      • Japan
    • North America
      • US
      • Canada
      • Mexico
    • Europe
      • Germany
      • UK
      • France
    • Middle East and Africa
      • Saudi Arabia
      • UAE
      • South Africa
    • South America
      • Brazil
      • Argentina
      • Colombia
    • Rest of World (ROW)

By Mode of Transportation Insights

The road freight logistics segment is estimated to witness significant growth during the forecast period.

The road freight logistics segment is central to the certification market, driven by intense scrutiny of greenhouse gas emissions.

Logistics operators seek third-party decarbonization verification to comply with evolving standards, such as those outlined in the freight decarbonization directive, and to provide sustainable supply chain assurance to clients.

The focus is on validating road freight logistics emissions through precise GHG emissions calculation and transparent reporting of environmental performance data.

Certification services assess a range of initiatives, from fleet emissions validation to the efficacy of eco-driving program validation, which has shown to improve fuel efficiency.

Frameworks like the smartway transport partnership are pivotal, offering scalable solutions for carbon footprint calculation that enable both large and small carriers to benchmark performance.

Request Free Sample

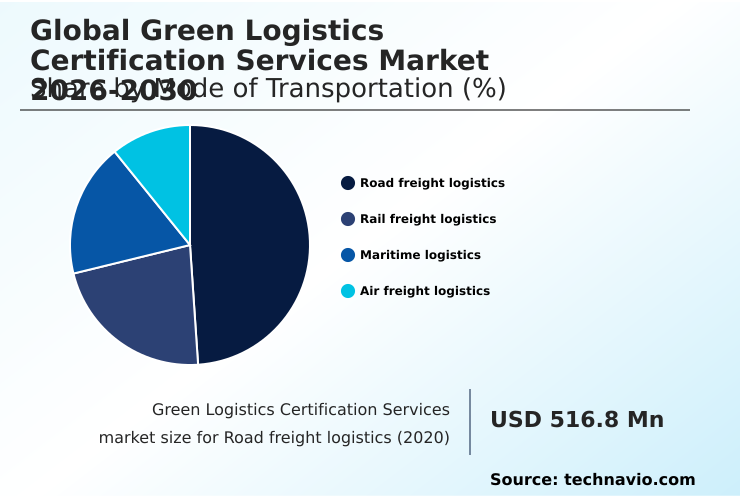
The Road freight logistics segment was valued at USD 641 million in 2024 and showed a gradual increase during the forecast period.

Request Free Sample

Regional Analysis

APAC is estimated to contribute 37.9% to the growth of the global market during the forecast period.Technavio’s analysts have elaborately explained the regional trends and drivers that shape the market during the forecast period.

See How Green Logistics Certification Services Market Demand is Rising in APAC Request Free Sample

The geographic landscape is led by the APAC region, which is set to account for over 37% of the market's incremental growth, driven by its role as a global manufacturing hub. In this region, maritime and aviation certifications are critical.

Compliance with the carbon intensity indicator (CII) and energy efficiency existing ship index (EEXI) is essential for market access. Green shipping corridor standards are also promoting alternative marine fuels certification.

Similarly, demand for verifying sustainable aviation fuel (SAF) usage through book-and-claim systems is rising. In contrast, Europe's mature market focuses on rail freight decarbonization and stringent port emissions certification.

Across all regions, the demand for services like carbon neutral labeling and verification for emerging areas like green hydrogen logistics is growing, reflecting a global trend toward specialized, verifiable sustainability claims.

Market Dynamics

Our researchers analyzed the data with 2025 as the base year, along with the key drivers, trends, and challenges. A holistic analysis of drivers will help companies refine their marketing strategies to gain a competitive advantage.

  • The demand for specialized verification services highlights the market's increasing maturity and complexity. Companies are moving beyond broad environmental statements to seek validation for highly specific operational activities. This includes services for verifying sustainable aviation fuel book-and-claim systems and auditing carbon intensity indicator compliance for maritime fleets.
  • The focus on the complete product journey is evident in the need for certifying circular economy reverse logistics and meticulously assessing scope 3 supply chain emissions. For logistics providers, obtaining an ISO 14001 certification for freight forwarders has become a competitive necessity, with adoption rates in this segment being nearly double that of smaller, regional carriers.
  • In infrastructure, securing a LEED certification for distribution centers is now a standard expectation for institutional investors. As consumer-facing pressures mount, there is a growing need for validating carbon neutrality for e-commerce delivery and obtaining certification for low-emission urban logistics zones.
  • The market is also addressing future-facing and niche requirements, such as establishing green hydrogen transport safety certification protocols and conducting energy efficiency audits for cold chain logistics. Cross-border trade complexities are driving demand for services ensuring compliance with carbon border taxes. Specialized commodity chains require services like sustainable palm oil logistics certification.
  • Technologically, the industry is leveraging blockchain for supply chain data integrity and AI for predictive emissions monitoring while also focusing on asset-specific needs like verifying emissions for dual-fuel vessels.

What are the key market drivers leading to the rise in the adoption of Green Logistics Certification Services Industry?

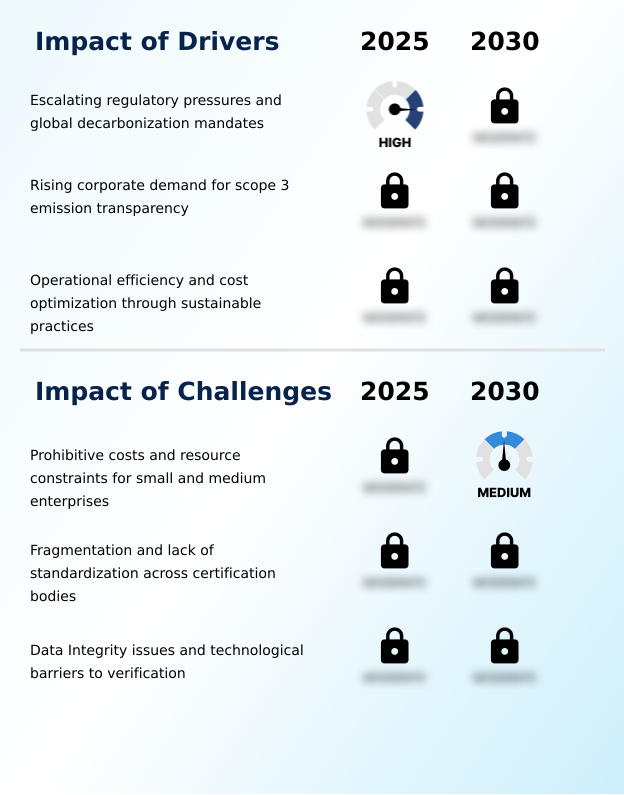
  • Market growth is primarily driven by escalating regulatory pressures for mandatory reporting and global corporate mandates for decarbonizing entire supply chains.

  • Intensifying regulatory frameworks are a primary market driver, with mandates like the corporate sustainability reporting directive (CSRD) compelling organizations to seek independent validation.
  • This creates strong demand for sustainable transport certification to ensure compliance and avoid penalties under schemes like the carbon border adjustment mechanism (CBAM).
  • The corporate focus on scope 3 emissions reporting is another significant factor, as companies now require their logistics partners to provide auditable carbon footprint verification. Utilizing the logistics emissions council (GLEC) framework has become a standard for this process.
  • This pressure for supply chain traceability extends to sustainable packaging verification and carbon offset validation services, with certified providers gaining preferential status in procurement processes, often securing contracts over non-certified competitors.

What are the market trends shaping the Green Logistics Certification Services Industry?

  • The market is fundamentally shifting toward integrating blockchain technology to ensure data integrity. This move addresses the risk of greenwashing by creating an immutable and transparent record of carbon data across the supply chain.

  • Market trends are shifting from reactive audits to proactive validation through technology. The integration of blockchain is delivering immutable carbon transparency, which improves the accuracy of supply chain carbon accounting by over 25%. Concurrently, predictive compliance monitoring powered by AI is reducing compliance breaches by up to 30%, transforming the traditional green logistics audit.
  • There is also an expanding focus on circular economy principles, where certification now includes a comprehensive lifecycle assessment of reverse logistics capabilities. This circular logistics verification is critical for managing last-mile delivery emissions and improving overall logistics ESG metrics, as companies adopting these models have demonstrated significant reductions in packaging waste.

What challenges does the Green Logistics Certification Services Industry face during its growth?

  • Prohibitive costs and significant resource constraints for small and medium-sized enterprises represent a key challenge affecting widespread industry adoption and growth.

  • Significant challenges persist, particularly the high cost of compliance for smaller operators, which can increase operational overhead by 15-20%. Pursuing green building certifications (LEED/BREEAM) or implementing ISO 50001 energy management systems requires substantial capital investment. This is also true for conducting a warehouse sustainability assessment against sustainable warehousing standards.
  • Furthermore, the fragmentation of standards complicates validation; a logistics provider may need separate ISO 14001 environmental management certification and ISO 14064 greenhouse gas verification for different regions. This complexity is amplified in specialized areas like cold chain sustainability audit and biofuel usage verification, where data integrity for energy efficiency auditing across different modes hinders improvements in intermodal transport efficiency.

Exclusive Technavio Analysis on Customer Landscape

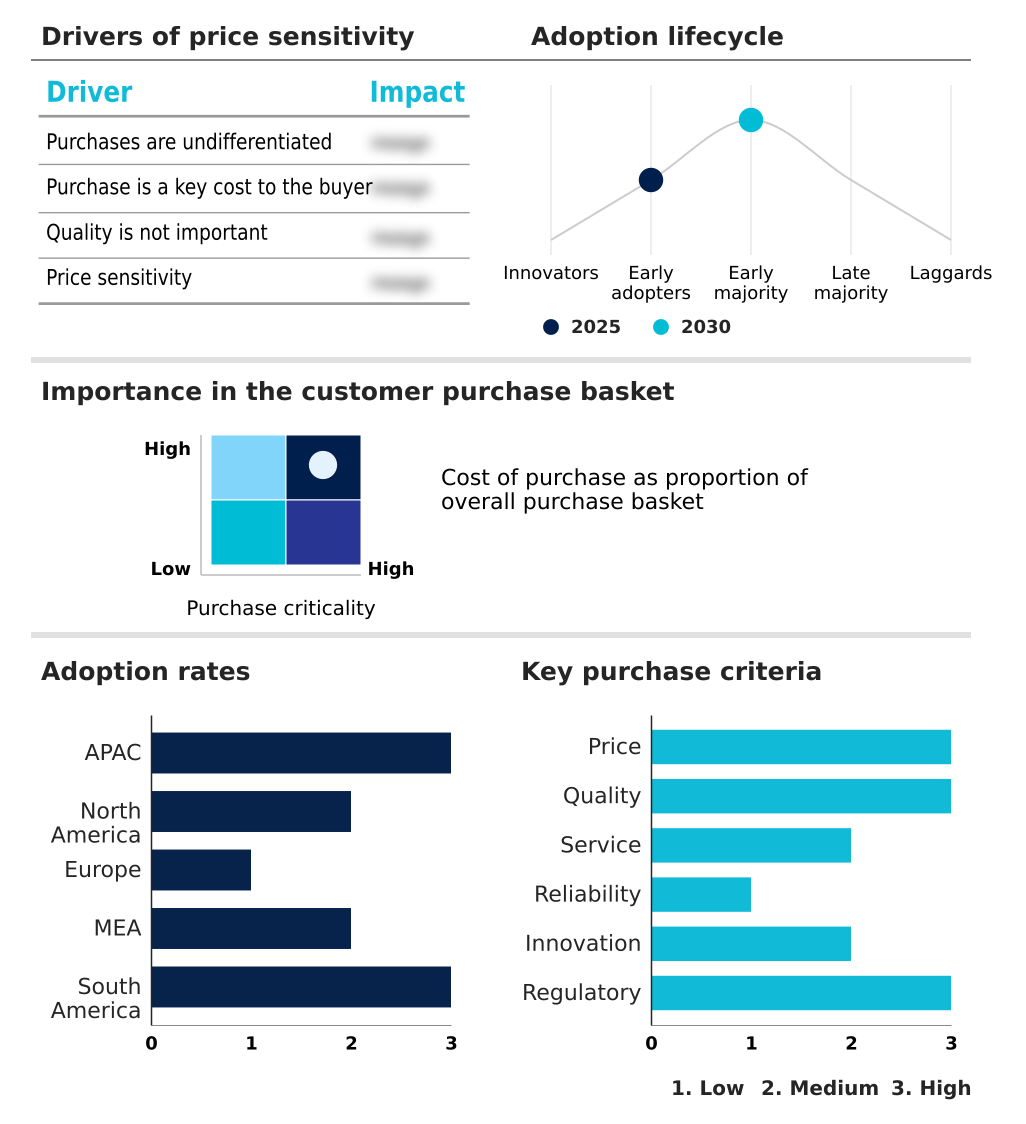
The green logistics certification services market forecasting report includes the adoption lifecycle of the market, covering from the innovator’s stage to the laggard’s stage. It focuses on adoption rates in different regions based on penetration. Furthermore, the green logistics certification services market report also includes key purchase criteria and drivers of price sensitivity to help companies evaluate and develop their market growth analysis strategies.

Customer Landscape of Green Logistics Certification Services Industry

Competitive Landscape

Companies are implementing various strategies, such as strategic alliances, green logistics certification services market forecast, partnerships, mergers and acquisitions, geographical expansion, and product/service launches, to enhance their presence in the industry.

ABS Group of Companies Inc. - Provides maritime decarbonization auditing and sustainable shipping performance verification, addressing key risks for entities engaged in global logistics.

The industry research and growth report includes detailed analyses of the competitive landscape of the market and information about key companies, including:

  • ABS Group of Companies Inc.
  • BRE Group
  • British Standards Institution
  • Bureau Veritas
  • Clearyst GBB LLC
  • Control union
  • Cotecna Inspection SA
  • DEKRA SE
  • DHL International GmbH
  • DNV Group AS
  • EcoVadis
  • Intertek Group Plc
  • Jones Lang LaSalle Inc.
  • LRQA Group Ltd.
  • Peterson
  • SGS SA
  • The Carbon Trust
  • Toitu Envirocare
  • TUV Rheinland Group
  • TUV SUD AG

Qualitative and quantitative analysis of companies has been conducted to help clients understand the wider business environment as well as the strengths and weaknesses of key industry players. Data is qualitatively analyzed to categorize companies as pure play, category-focused, industry-focused, and diversified; it is quantitatively analyzed to categorize companies as dominant, leading, strong, tentative, and weak.

Recent Development and News in Green logistics certification services market

  • In May, 2025, DNV launched a strategic initiative to integrate AI-driven remote auditing tools for maritime logistics certifications, aiming to enhance the credibility of continuous performance claims.
  • In April, 2025, the International Standards Organization released updated guidance specifically for circular logistics flows, prompting increased demand for certifications validating reverse logistics and material recovery systems.
  • In March, 2025, a coalition of major international e-commerce platforms announced a joint requirement that all last-mile logistics partners must achieve a specified tier of green certification to maintain their status on preferred company lists.
  • In February, 2025, the Global Maritime Decarbonization Alliance introduced a unified certification standard for dual-fuel vessels on Trans-Pacific routes, seeking to harmonize various regional eco-labels into a single framework.

Dive into Technavio’s robust research methodology, blending expert interviews, extensive data synthesis, and validated models for unparalleled Green Logistics Certification Services Market insights. See full methodology.

Market Scope
Page number 305
Base year 2025
Historic period 2020-2024
Forecast period 2026-2030
Growth momentum & CAGR Accelerate at a CAGR of 7.2%
Market growth 2026-2030 USD 574.4 million
Market structure Fragmented
YoY growth 2025-2026(%) 7.1%
Key countries China, India, Japan, South Korea, Australia, Indonesia, US, Canada, Mexico, Germany, UK, France, The Netherlands, Italy, Spain, Saudi Arabia, UAE, South Africa, Turkey, Israel, Brazil, Argentina and Colombia
Competitive landscape Leading Companies, Market Positioning of Companies, Competitive Strategies, and Industry Risks

Request Free Sample

Research Analyst Overview

  • The market is evolving into an essential component of corporate risk management and strategic planning. Boardroom decisions on capital allocation are increasingly influenced by the need for credible decarbonization verification to mitigate risks associated with the carbon border adjustment mechanism (CBAM) and the corporate sustainability reporting directive (CSRD).
  • Achieving sustainable supply chain assurance now requires meticulous scope 3 emissions reporting, validated through independent carbon footprint verification. Firms achieving ISO 14001 environmental management certification demonstrate a commitment that resonates with investors. The process involves detailed GHG emissions calculation and energy efficiency auditing, often leading to ISO 50001 energy management adoption.
  • For instance, obtaining green building certifications (LEED/BREEAM) has shown to increase asset valuation by up to 10%. Technology is enabling immutable carbon transparency and predictive compliance monitoring, enhancing supply chain traceability and the integrity of environmental performance data. Certification extends to circular economy principles by assessing reverse logistics capabilities via a lifecycle assessment.
  • Specific standards like the smartway transport partnership, maritime's carbon intensity indicator (CII) and energy efficiency existing ship index (EEXI), and aviation's use of sustainable aviation fuel (SAF) with book-and-claim systems, are becoming mandatory. This drive for authenticity is also fueling demand for carbon neutral labeling, backed by ISO 14064 greenhouse gas verification.

What are the Key Data Covered in this Green Logistics Certification Services Market Research and Growth Report?

  • What is the expected growth of the Green Logistics Certification Services Market between 2026 and 2030?

    • USD 574.4 million, at a CAGR of 7.2%

  • What segmentation does the market report cover?

    • The report is segmented by Mode of Transportation (Road freight logistics, Rail freight logistics, Maritime logistics, and Air freight logistics), End-user (Logistics service providers, Retail and e-commerce companies, and Manufacturers and exporters), Service Type (Carbon footprint certification, Energy efficiency certification, and Sustainable supply chain certification) and Geography (APAC, North America, Europe, Middle East and Africa, South America)

  • Which regions are analyzed in the report?

    • APAC, North America, Europe, Middle East and Africa and South America

  • What are the key growth drivers and market challenges?

    • Escalating regulatory pressures and global decarbonization mandates, Prohibitive costs and resource constraints for small and medium enterprises

  • Who are the major players in the Green Logistics Certification Services Market?

    • ABS Group of Companies Inc., BRE Group, British Standards Institution, Bureau Veritas, Clearyst GBB LLC, Control union, Cotecna Inspection SA, DEKRA SE, DHL International GmbH, DNV Group AS, EcoVadis, Intertek Group Plc, Jones Lang LaSalle Inc., LRQA Group Ltd., Peterson, SGS SA, The Carbon Trust, Toitu Envirocare, TUV Rheinland Group and TUV SUD AG

Market Research Insights

  • The market's dynamism is driven by a comprehensive need for validation across the entire supply chain. A green logistics audit now includes precise supply chain carbon accounting and reporting on logistics ESG metrics. Demand for sustainable transport certification is surging, with a focus on fleet emissions validation and verifying road freight logistics emissions to comply with the freight decarbonization directive.
  • The logistics emissions council (GLEC) framework guides carbon footprint calculation. A warehouse sustainability assessment against sustainable warehousing standards has shown to reduce energy costs by over 10%. Verification extends to sustainable packaging verification, last-mile delivery emissions, and circular logistics verification. Specialized audits like a cold chain sustainability audit, biofuel usage verification, and eco-driving program validation are also key.
  • In maritime, port emissions certification, alternative marine fuels certification, and adherence to green shipping corridor standards are critical. Meanwhile, sectors are preparing for green hydrogen logistics and rail freight decarbonization, while relying on carbon offset validation services to meet interim goals, improving intermodal transport efficiency.

We can help! Our analysts can customize this green logistics certification services market research report to meet your requirements.

Get in touch

1. Executive Summary

1.1 Market overview

Executive Summary - Chart on Market Overview
Executive Summary - Data Table on Market Overview
Executive Summary - Chart on Global Market Characteristics
Executive Summary - Chart on Market by Geography
Executive Summary - Chart on Market Segmentation by Mode of Transportation
Executive Summary - Chart on Market Segmentation by End-user
Executive Summary - Chart on Market Segmentation by Service Type
Executive Summary - Chart on Incremental Growth
Executive Summary - Data Table on Incremental Growth
Executive Summary - Chart on Company Market Positioning

2. Technavio Analysis

2.1 Analysis of price sensitivity, lifecycle, customer purchase basket, adoption rates, and purchase criteria

2.2 Criticality of inputs and Factors of differentiation

Chart on Overview on criticality of inputs and factors of differentiation

2.3 Factors of disruption

Chart on Overview on factors of disruption

2.4 Impact of drivers and challenges

Chart on Impact of drivers and challenges in 2025 and 2030

3. Market Landscape

3.1 Market ecosystem

Chart on Parent Market
Data Table on - Parent Market

3.2 Market characteristics

Chart on Market characteristics analysis

3.3 Value chain analysis

Chart on Value chain analysis

4. Market Sizing

4.1 Market definition

Data Table on Offerings of companies included in the market definition

4.2 Market segment analysis

Market segments

4.3 Market size 2025

4.4 Market outlook: Forecast for 2025-2030

Chart on Global - Market size and forecast 2025-2030 ($ million)
Data Table on Global - Market size and forecast 2025-2030 ($ million)
Chart on Global Market: Year-over-year growth 2025-2030 (%)
Data Table on Global Market: Year-over-year growth 2025-2030 (%)

5. Historic Market Size

5.1 Global Green Logistics Certification Services Market 2020 - 2024

Historic Market Size - Data Table on Global Green Logistics Certification Services Market 2020 - 2024 ($ million)

5.2 Mode of Transportation segment analysis 2020 - 2024

Historic Market Size - Mode of Transportation Segment 2020 - 2024 ($ million)

5.3 End-user segment analysis 2020 - 2024

Historic Market Size - End-user Segment 2020 - 2024 ($ million)

5.4 Service Type segment analysis 2020 - 2024

Historic Market Size - Service Type Segment 2020 - 2024 ($ million)

5.5 Geography segment analysis 2020 - 2024

Historic Market Size - Geography Segment 2020 - 2024 ($ million)

5.6 Country segment analysis 2020 - 2024

Historic Market Size - Country Segment 2020 - 2024 ($ million)

6. Qualitative Analysis

6.1 Impact of AI Global Green Logistics Certification Services Market

7. Five Forces Analysis

7.1 Five forces summary

Five forces analysis - Comparison between 2025 and 2030

7.2 Bargaining power of buyers

Bargaining power of buyers - Impact of key factors 2025 and 2030

7.3 Bargaining power of suppliers

Bargaining power of suppliers - Impact of key factors in 2025 and 2030

7.4 Threat of new entrants

Threat of new entrants - Impact of key factors in 2025 and 2030

7.5 Threat of substitutes

Threat of substitutes - Impact of key factors in 2025 and 2030

7.6 Threat of rivalry

Threat of rivalry - Impact of key factors in 2025 and 2030

7.7 Market condition

Chart on Market condition - Five forces 2025 and 2030

8. Market Segmentation by Mode of Transportation

8.1 Market segments

Chart on Mode of Transportation - Market share 2025-2030 (%)
Data Table on Mode of Transportation - Market share 2025-2030 (%)

8.2 Comparison by Mode of Transportation

Chart on Comparison by Mode of Transportation
Data Table on Comparison by Mode of Transportation

8.3 Road freight logistics - Market size and forecast 2025-2030

Chart on Road freight logistics - Market size and forecast 2025-2030 ($ million)
Data Table on Road freight logistics - Market size and forecast 2025-2030 ($ million)
Chart on Road freight logistics - Year-over-year growth 2025-2030 (%)
Data Table on Road freight logistics - Year-over-year growth 2025-2030 (%)

8.4 Rail freight logistics - Market size and forecast 2025-2030

Chart on Rail freight logistics - Market size and forecast 2025-2030 ($ million)
Data Table on Rail freight logistics - Market size and forecast 2025-2030 ($ million)
Chart on Rail freight logistics - Year-over-year growth 2025-2030 (%)
Data Table on Rail freight logistics - Year-over-year growth 2025-2030 (%)

8.5 Maritime logistics - Market size and forecast 2025-2030

Chart on Maritime logistics - Market size and forecast 2025-2030 ($ million)
Data Table on Maritime logistics - Market size and forecast 2025-2030 ($ million)
Chart on Maritime logistics - Year-over-year growth 2025-2030 (%)
Data Table on Maritime logistics - Year-over-year growth 2025-2030 (%)

8.6 Air freight logistics - Market size and forecast 2025-2030

Chart on Air freight logistics - Market size and forecast 2025-2030 ($ million)
Data Table on Air freight logistics - Market size and forecast 2025-2030 ($ million)
Chart on Air freight logistics - Year-over-year growth 2025-2030 (%)
Data Table on Air freight logistics - Year-over-year growth 2025-2030 (%)

8.7 Market opportunity by Mode of Transportation

Market opportunity by Mode of Transportation ($ million)
Data Table on Market opportunity by Mode of Transportation ($ million)

9. Market Segmentation by End-user

9.1 Market segments

Chart on End-user - Market share 2025-2030 (%)
Data Table on End-user - Market share 2025-2030 (%)

9.2 Comparison by End-user

Chart on Comparison by End-user
Data Table on Comparison by End-user

9.3 Logistics service providers - Market size and forecast 2025-2030

Chart on Logistics service providers - Market size and forecast 2025-2030 ($ million)
Data Table on Logistics service providers - Market size and forecast 2025-2030 ($ million)
Chart on Logistics service providers - Year-over-year growth 2025-2030 (%)
Data Table on Logistics service providers - Year-over-year growth 2025-2030 (%)

9.4 Retail and e-commerce companies - Market size and forecast 2025-2030

Chart on Retail and e-commerce companies - Market size and forecast 2025-2030 ($ million)
Data Table on Retail and e-commerce companies - Market size and forecast 2025-2030 ($ million)
Chart on Retail and e-commerce companies - Year-over-year growth 2025-2030 (%)
Data Table on Retail and e-commerce companies - Year-over-year growth 2025-2030 (%)

9.5 Manufacturers and exporters - Market size and forecast 2025-2030

Chart on Manufacturers and exporters - Market size and forecast 2025-2030 ($ million)
Data Table on Manufacturers and exporters - Market size and forecast 2025-2030 ($ million)
Chart on Manufacturers and exporters - Year-over-year growth 2025-2030 (%)
Data Table on Manufacturers and exporters - Year-over-year growth 2025-2030 (%)

9.6 Market opportunity by End-user

Market opportunity by End-user ($ million)
Data Table on Market opportunity by End-user ($ million)

10. Market Segmentation by Service Type

10.1 Market segments

Chart on Service Type - Market share 2025-2030 (%)
Data Table on Service Type - Market share 2025-2030 (%)

10.2 Comparison by Service Type

Chart on Comparison by Service Type
Data Table on Comparison by Service Type

10.3 Carbon footprint certification - Market size and forecast 2025-2030

Chart on Carbon footprint certification - Market size and forecast 2025-2030 ($ million)
Data Table on Carbon footprint certification - Market size and forecast 2025-2030 ($ million)
Chart on Carbon footprint certification - Year-over-year growth 2025-2030 (%)
Data Table on Carbon footprint certification - Year-over-year growth 2025-2030 (%)

10.4 Energy efficiency certification - Market size and forecast 2025-2030

Chart on Energy efficiency certification - Market size and forecast 2025-2030 ($ million)
Data Table on Energy efficiency certification - Market size and forecast 2025-2030 ($ million)
Chart on Energy efficiency certification - Year-over-year growth 2025-2030 (%)
Data Table on Energy efficiency certification - Year-over-year growth 2025-2030 (%)

10.5 Sustainable supply chain certification - Market size and forecast 2025-2030

Chart on Sustainable supply chain certification - Market size and forecast 2025-2030 ($ million)
Data Table on Sustainable supply chain certification - Market size and forecast 2025-2030 ($ million)
Chart on Sustainable supply chain certification - Year-over-year growth 2025-2030 (%)
Data Table on Sustainable supply chain certification - Year-over-year growth 2025-2030 (%)

10.6 Market opportunity by Service Type

Market opportunity by Service Type ($ million)
Data Table on Market opportunity by Service Type ($ million)

11. Customer Landscape

11.1 Customer landscape overview

Analysis of price sensitivity, lifecycle, customer purchase basket, adoption rates, and purchase criteria

12. Geographic Landscape

12.1 Geographic segmentation

Chart on Market share by geography 2025-2030 (%)
Data Table on Market share by geography 2025-2030 (%)

12.2 Geographic comparison

Chart on Geographic comparison
Data Table on Geographic comparison

12.3 APAC - Market size and forecast 2025-2030

Chart on APAC - Market size and forecast 2025-2030 ($ million)
Data Table on APAC - Market size and forecast 2025-2030 ($ million)
Chart on APAC - Year-over-year growth 2025-2030 (%)
Data Table on APAC - Year-over-year growth 2025-2030 (%)
Chart on Regional Comparison - APAC
Data Table on Regional Comparison - APAC

12.3.1 China - Market size and forecast 2025-2030

Chart on China - Market size and forecast 2025-2030 ($ million)
Data Table on China - Market size and forecast 2025-2030 ($ million)
Chart on China - Year-over-year growth 2025-2030 (%)
Data Table on China - Year-over-year growth 2025-2030 (%)

12.3.2 India - Market size and forecast 2025-2030

Chart on India - Market size and forecast 2025-2030 ($ million)
Data Table on India - Market size and forecast 2025-2030 ($ million)
Chart on India - Year-over-year growth 2025-2030 (%)
Data Table on India - Year-over-year growth 2025-2030 (%)

12.3.3 Japan - Market size and forecast 2025-2030

Chart on Japan - Market size and forecast 2025-2030 ($ million)
Data Table on Japan - Market size and forecast 2025-2030 ($ million)
Chart on Japan - Year-over-year growth 2025-2030 (%)
Data Table on Japan - Year-over-year growth 2025-2030 (%)

12.3.4 South Korea - Market size and forecast 2025-2030

Chart on South Korea - Market size and forecast 2025-2030 ($ million)
Data Table on South Korea - Market size and forecast 2025-2030 ($ million)
Chart on South Korea - Year-over-year growth 2025-2030 (%)
Data Table on South Korea - Year-over-year growth 2025-2030 (%)

12.3.5 Australia - Market size and forecast 2025-2030

Chart on Australia - Market size and forecast 2025-2030 ($ million)
Data Table on Australia - Market size and forecast 2025-2030 ($ million)
Chart on Australia - Year-over-year growth 2025-2030 (%)
Data Table on Australia - Year-over-year growth 2025-2030 (%)

12.3.6 Indonesia - Market size and forecast 2025-2030

Chart on Indonesia - Market size and forecast 2025-2030 ($ million)
Data Table on Indonesia - Market size and forecast 2025-2030 ($ million)
Chart on Indonesia - Year-over-year growth 2025-2030 (%)
Data Table on Indonesia - Year-over-year growth 2025-2030 (%)

12.4 North America - Market size and forecast 2025-2030

Chart on North America - Market size and forecast 2025-2030 ($ million)
Data Table on North America - Market size and forecast 2025-2030 ($ million)
Chart on North America - Year-over-year growth 2025-2030 (%)
Data Table on North America - Year-over-year growth 2025-2030 (%)
Chart on Regional Comparison - North America
Data Table on Regional Comparison - North America

12.4.1 US - Market size and forecast 2025-2030

Chart on US - Market size and forecast 2025-2030 ($ million)
Data Table on US - Market size and forecast 2025-2030 ($ million)
Chart on US - Year-over-year growth 2025-2030 (%)
Data Table on US - Year-over-year growth 2025-2030 (%)

12.4.2 Canada - Market size and forecast 2025-2030

Chart on Canada - Market size and forecast 2025-2030 ($ million)
Data Table on Canada - Market size and forecast 2025-2030 ($ million)
Chart on Canada - Year-over-year growth 2025-2030 (%)
Data Table on Canada - Year-over-year growth 2025-2030 (%)

12.4.3 Mexico - Market size and forecast 2025-2030

Chart on Mexico - Market size and forecast 2025-2030 ($ million)
Data Table on Mexico - Market size and forecast 2025-2030 ($ million)
Chart on Mexico - Year-over-year growth 2025-2030 (%)
Data Table on Mexico - Year-over-year growth 2025-2030 (%)

12.5 Europe - Market size and forecast 2025-2030

Chart on Europe - Market size and forecast 2025-2030 ($ million)
Data Table on Europe - Market size and forecast 2025-2030 ($ million)
Chart on Europe - Year-over-year growth 2025-2030 (%)
Data Table on Europe - Year-over-year growth 2025-2030 (%)
Chart on Regional Comparison - Europe
Data Table on Regional Comparison - Europe

12.5.1 Germany - Market size and forecast 2025-2030

Chart on Germany - Market size and forecast 2025-2030 ($ million)
Data Table on Germany - Market size and forecast 2025-2030 ($ million)
Chart on Germany - Year-over-year growth 2025-2030 (%)
Data Table on Germany - Year-over-year growth 2025-2030 (%)

12.5.2 UK - Market size and forecast 2025-2030

Chart on UK - Market size and forecast 2025-2030 ($ million)
Data Table on UK - Market size and forecast 2025-2030 ($ million)
Chart on UK - Year-over-year growth 2025-2030 (%)
Data Table on UK - Year-over-year growth 2025-2030 (%)

12.5.3 France - Market size and forecast 2025-2030

Chart on France - Market size and forecast 2025-2030 ($ million)
Data Table on France - Market size and forecast 2025-2030 ($ million)
Chart on France - Year-over-year growth 2025-2030 (%)
Data Table on France - Year-over-year growth 2025-2030 (%)

12.5.4 The Netherlands - Market size and forecast 2025-2030

Chart on The Netherlands - Market size and forecast 2025-2030 ($ million)
Data Table on The Netherlands - Market size and forecast 2025-2030 ($ million)
Chart on The Netherlands - Year-over-year growth 2025-2030 (%)
Data Table on The Netherlands - Year-over-year growth 2025-2030 (%)

12.5.5 Italy - Market size and forecast 2025-2030

Chart on Italy - Market size and forecast 2025-2030 ($ million)
Data Table on Italy - Market size and forecast 2025-2030 ($ million)
Chart on Italy - Year-over-year growth 2025-2030 (%)
Data Table on Italy - Year-over-year growth 2025-2030 (%)

12.5.6 Spain - Market size and forecast 2025-2030

Chart on Spain - Market size and forecast 2025-2030 ($ million)
Data Table on Spain - Market size and forecast 2025-2030 ($ million)
Chart on Spain - Year-over-year growth 2025-2030 (%)
Data Table on Spain - Year-over-year growth 2025-2030 (%)

12.6 Middle East and Africa - Market size and forecast 2025-2030

Chart on Middle East and Africa - Market size and forecast 2025-2030 ($ million)
Data Table on Middle East and Africa - Market size and forecast 2025-2030 ($ million)
Chart on Middle East and Africa - Year-over-year growth 2025-2030 (%)
Data Table on Middle East and Africa - Year-over-year growth 2025-2030 (%)
Chart on Regional Comparison - Middle East and Africa
Data Table on Regional Comparison - Middle East and Africa

12.6.1 Saudi Arabia - Market size and forecast 2025-2030

Chart on Saudi Arabia - Market size and forecast 2025-2030 ($ million)
Data Table on Saudi Arabia - Market size and forecast 2025-2030 ($ million)
Chart on Saudi Arabia - Year-over-year growth 2025-2030 (%)
Data Table on Saudi Arabia - Year-over-year growth 2025-2030 (%)

12.6.2 UAE - Market size and forecast 2025-2030

Chart on UAE - Market size and forecast 2025-2030 ($ million)
Data Table on UAE - Market size and forecast 2025-2030 ($ million)
Chart on UAE - Year-over-year growth 2025-2030 (%)
Data Table on UAE - Year-over-year growth 2025-2030 (%)

12.6.3 South Africa - Market size and forecast 2025-2030

Chart on South Africa - Market size and forecast 2025-2030 ($ million)
Data Table on South Africa - Market size and forecast 2025-2030 ($ million)
Chart on South Africa - Year-over-year growth 2025-2030 (%)
Data Table on South Africa - Year-over-year growth 2025-2030 (%)

12.6.4 Turkey - Market size and forecast 2025-2030

Chart on Turkey - Market size and forecast 2025-2030 ($ million)
Data Table on Turkey - Market size and forecast 2025-2030 ($ million)
Chart on Turkey - Year-over-year growth 2025-2030 (%)
Data Table on Turkey - Year-over-year growth 2025-2030 (%)

12.6.5 Israel - Market size and forecast 2025-2030

Chart on Israel - Market size and forecast 2025-2030 ($ million)
Data Table on Israel - Market size and forecast 2025-2030 ($ million)
Chart on Israel - Year-over-year growth 2025-2030 (%)
Data Table on Israel - Year-over-year growth 2025-2030 (%)

12.7 South America - Market size and forecast 2025-2030

Chart on South America - Market size and forecast 2025-2030 ($ million)
Data Table on South America - Market size and forecast 2025-2030 ($ million)
Chart on South America - Year-over-year growth 2025-2030 (%)
Data Table on South America - Year-over-year growth 2025-2030 (%)
Chart on Regional Comparison - South America
Data Table on Regional Comparison - South America

12.7.1 Brazil - Market size and forecast 2025-2030

Chart on Brazil - Market size and forecast 2025-2030 ($ million)
Data Table on Brazil - Market size and forecast 2025-2030 ($ million)
Chart on Brazil - Year-over-year growth 2025-2030 (%)
Data Table on Brazil - Year-over-year growth 2025-2030 (%)

12.7.2 Argentina - Market size and forecast 2025-2030

Chart on Argentina - Market size and forecast 2025-2030 ($ million)
Data Table on Argentina - Market size and forecast 2025-2030 ($ million)
Chart on Argentina - Year-over-year growth 2025-2030 (%)
Data Table on Argentina - Year-over-year growth 2025-2030 (%)

12.7.3 Colombia - Market size and forecast 2025-2030

Chart on Colombia - Market size and forecast 2025-2030 ($ million)
Data Table on Colombia - Market size and forecast 2025-2030 ($ million)
Chart on Colombia - Year-over-year growth 2025-2030 (%)
Data Table on Colombia - Year-over-year growth 2025-2030 (%)

12.8 Market opportunity by geography

Market opportunity by geography ($ million)
Data Tables on Market opportunity by geography ($ million)

13. Drivers, Challenges, and Opportunity

13.1 Market drivers

Escalating regulatory pressures and global decarbonization mandates
Rising corporate demand for scope 3 emission transparency
Operational efficiency and cost optimization through sustainable practices

13.2 Market challenges

Prohibitive costs and resource constraints for small and medium enterprises
Fragmentation and lack of standardization across certification bodies
Data Integrity issues and technological barriers to verification

13.3 Impact of drivers and challenges

Impact of drivers and challenges in 2025 and 2030

13.4 Market opportunities

Integration of blockchain for immutable carbon transparency
Rise of AI-driven predictive compliance monitoring
Expansion of certification scope to circular economy and reverse logistics

14. Competitive Landscape

14.1 Overview

14.2

Overview on criticality of inputs and factors of differentiation

14.3 Landscape disruption

Overview on factors of disruption

14.4 Industry risks

Impact of key risks on business

15. Competitive Analysis

15.1 Companies profiled

Companies covered

15.2 Company ranking index

15.3 Market positioning of companies

Matrix on companies position and classification

15.4 ABS Group of Companies Inc.

ABS Group of Companies Inc. - Overview
ABS Group of Companies Inc. - Product / Service
ABS Group of Companies Inc. - Key offerings
SWOT

15.5 BRE Group

BRE Group - Overview
BRE Group - Product / Service
BRE Group - Key offerings
SWOT

15.6 Bureau Veritas

Bureau Veritas - Overview
Bureau Veritas - Business segments
Bureau Veritas - Key offerings
Bureau Veritas - Segment focus
SWOT

15.7 Control union

Control union - Overview
Control union - Product / Service
Control union - Key offerings
SWOT

15.8 DEKRA SE

DEKRA SE - Overview
DEKRA SE - Product / Service
DEKRA SE - Key offerings
SWOT

15.9 DHL International GmbH

DHL International GmbH - Overview
DHL International GmbH - Business segments
DHL International GmbH - Key news
DHL International GmbH - Key offerings
DHL International GmbH - Segment focus
SWOT

15.10 DNV Group AS

DNV Group AS - Overview
DNV Group AS - Business segments
DNV Group AS - Key offerings
DNV Group AS - Segment focus
SWOT

15.11 EcoVadis

EcoVadis - Overview
EcoVadis - Product / Service
EcoVadis - Key offerings
SWOT

15.12 Intertek Group Plc

Intertek Group Plc - Overview
Intertek Group Plc - Business segments
Intertek Group Plc - Key offerings
Intertek Group Plc - Segment focus
SWOT

15.13 Jones Lang LaSalle Inc.

Jones Lang LaSalle Inc. - Overview
Jones Lang LaSalle Inc. - Business segments
Jones Lang LaSalle Inc. - Key offerings
Jones Lang LaSalle Inc. - Segment focus
SWOT

15.14 LRQA Group Ltd.

LRQA Group Ltd. - Overview
LRQA Group Ltd. - Product / Service
LRQA Group Ltd. - Key offerings
SWOT

15.15 SGS SA

SGS SA - Overview
SGS SA - Business segments
SGS SA - Key offerings
SGS SA - Segment focus
SWOT

15.16 The Carbon Trust

The Carbon Trust - Overview
The Carbon Trust - Product / Service
The Carbon Trust - Key offerings
SWOT

15.17 TUV Rheinland Group

TUV Rheinland Group - Overview
TUV Rheinland Group - Product / Service
TUV Rheinland Group - Key offerings
SWOT

15.18 TUV SUD AG

TUV SUD AG - Overview
TUV SUD AG - Product / Service
TUV SUD AG - Key offerings
SWOT

16. Appendix

16.1 Scope of the report

Market definition
Objectives
Notes and caveats

16.2 Inclusions and exclusions checklist

Inclusions checklist
Exclusions checklist

16.3 Currency conversion rates for US$

16.4 Research methodology

16.5 Data procurement

Information sources

16.6 Data validation

16.7 Validation techniques employed for market sizing

16.8 Data synthesis

16.9 360 degree market analysis

16.10 List of abbreviations

Research Methodology

Technavio presents a detailed picture of the market by way of study, synthesis, and summation of data from multiple sources. The analysts have presented the various facets of the market with a particular focus on identifying the key industry influencers. The data thus presented is comprehensive, reliable, and the result of extensive research, both primary and secondary.

INFORMATION SOURCES

Primary sources

  • Manufacturers and suppliers
  • Channel partners
  • Industry experts
  • Strategic decision makers

Secondary sources

  • Industry journals and periodicals
  • Government data
  • Financial reports of key industry players
  • Historical data
  • Press releases

DATA ANALYSIS

Data Synthesis

  • Collation of data
  • Estimation of key figures
  • Analysis of derived insights

Data Validation

  • Triangulation with data models
  • Reference against proprietary databases
  • Corroboration with industry experts

REPORT WRITING

Qualitative

  • Market drivers
  • Market challenges
  • Market trends
  • Five forces analysis

Quantitative

  • Market size and forecast
  • Market segmentation
  • Geographical insights
  • Competitive landscape

Interested in this report?

Get your sample now to see our research methodology and insights!

Download Now

Frequently Asked Questions

Green Logistics Certification Services market growth will increase by USD 574.4 million during 2026-2030.

The Green Logistics Certification Services market is expected to grow at a CAGR of 7.2% during 2026-2030.

Green Logistics Certification Services market is segmented by Mode of transportation (Road freight logistics, Rail freight logistics, Maritime logistics, Air freight logistics) End-user (Logistics service providers, Retail and e-commerce companies, Manufacturers and exporters) Service type (Carbon footprint certification, Energy efficiency certification, Sustainable supply chain certification)

ABS Group of Companies Inc., BRE Group, British Standards Institution, Bureau Veritas, Clearyst GBB LLC, Control union, Cotecna Inspection SA, DEKRA SE, DHL International GmbH, DNV Group AS, EcoVadis, Intertek Group Plc, Jones Lang LaSalle Inc., LRQA Group Ltd., Peterson, SGS SA, The Carbon Trust, Toitu Envirocare, TUV Rheinland Group, TUV SUD AG are a few of the key vendors in the Green Logistics Certification Services market.

APAC will register the highest growth rate of 37.9% among the other regions. Therefore, the Green Logistics Certification Services market in APAC is expected to garner significant business opportunities for the vendors during the forecast period.

China, India, Japan, South Korea, Australia, Indonesia, US, Canada, Mexico, Germany, UK, France, The Netherlands, Italy, Spain, Saudi Arabia, UAE, South Africa, Turkey, Israel, Brazil, Argentina, Colombia

  • Escalating regulatory pressures and global decarbonization mandates is the driving factor this market.

The Green Logistics Certification Services market vendors should focus on grabbing business opportunities from the Mode of transportation segment as it accounted for the largest market share in the base year.
RIA - Research AI Assistant
Ask RIA