Gynecological Cancers Therapeutics Market Analysis North America, Europe, Asia, Rest of World (ROW) - US, Canada, Germany, UK, China - Size and Forecast 2024-2028

Gynecological Cancers Therapeutics Market Analysis North America, Europe, Asia, Rest of World (ROW) - US, Canada, Germany, UK, China - Size and Forecast 2024-2028

Published: Feb 2024 173 Pages SKU: IRTNTR73551

Market Overview at a Glance

$19.15 B
Market Opportunity
15.83%
CAGR
13.17
YoY growth 2023-2024(%)

Gynecological Cancers Therapeutics Market Size 2024-2028

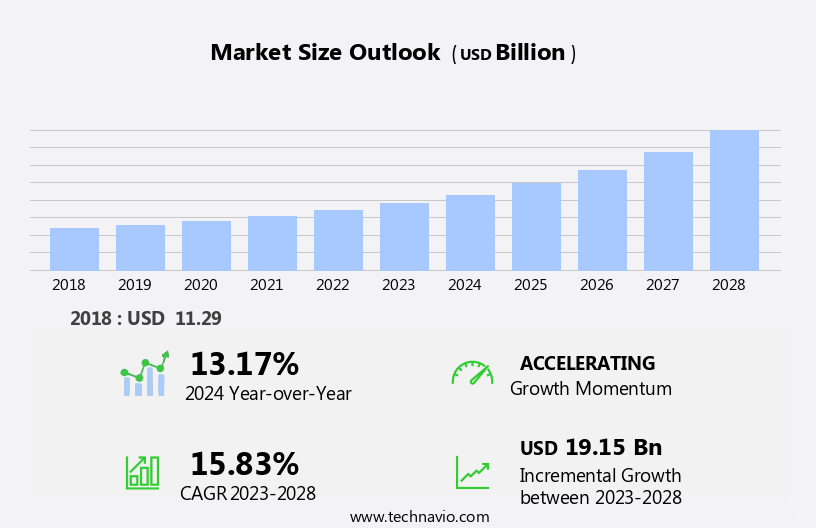
The gynecological cancers therapeutics market size is forecast to increase by USD 19.15 billion at a CAGR of 15.83% between 2023 and 2028.

  • The market is witnessing significant growth due to the increasing incidence of gynecological cancers. According to the World Health Organization, an estimated 389,000 new cases and 129,000 deaths occurred in 2020. This trend is expected to continue, driven by factors such as aging populations, rising awareness, and improved diagnostic methods. Another key driver in the market is the emergence of novel therapies. The development of targeted therapies, immunotherapies, and gene therapies is providing new treatment options for patients, leading to improved outcomes and increased survival rates. However, the high cost of these advanced therapies poses a significant challenge for both patients and healthcare systems.
  • Affordability remains a critical concern, particularly in developing countries where access to healthcare is limited. In conclusion, the market is experiencing robust growth due to the rising incidence of gynecological cancers and the emergence of innovative therapies. However, the high cost of treatment remains a significant challenge that must be addressed to ensure accessibility and affordability for patients. Companies seeking to capitalize on market opportunities and navigate challenges effectively should focus on developing cost-effective treatment options while maintaining therapeutic efficacy.

What will be the Size of the Gynecological Cancers Therapeutics Market during the forecast period?

Gynecological Cancers Therapeutics Market Size

 Request Free Sample

  • The market is characterized by continuous evolution and dynamic market activities. genetic testing plays a pivotal role in identifying the genetic predisposition to various gynecological cancers, driving research funding towards precision medicine and personalized treatment plans. Patient support organizations are increasingly focusing on improving quality of life for patients undergoing cancer diagnosis and treatment. Cancer screening initiatives, including Molecular Diagnostics, are essential for early detection and prevention of gynecological cancers such as uterine, ovarian, cervical, vaginal, and vulvar cancers. Clinical trials and drug development are ongoing, with a focus on targeted therapy and hormonal treatments. Healthcare policy and regulatory frameworks are evolving to accommodate the needs of women's reproductive health, with a growing emphasis on patient care and patient advocacy.
  • Machine learning and Data Analytics are transforming cancer diagnosis and treatment, enabling healthcare providers to deliver more accurate and effective care. Drug discovery and approval processes are underway for various gynecological cancers, with a focus on improving cancer survival rates and reducing recurrence. Digital health technologies, including telemedicine and remote monitoring, are enhancing patient care and access to healthcare services. The landscape of gynecological cancers therapeutics is ever-changing, with ongoing research and innovation in areas such as drug development, cancer prevention, and precision oncology. The future holds great promise for improving patient outcomes and advancing women's health.

How is this Gynecological Cancers Therapeutics Industry segmented?

The gynecological cancers therapeutics industry research report provides comprehensive data (region-wise segment analysis), with forecasts and estimates in "USD billion" for the period 2024-2028, as well as historical data from 2018-2022 for the following segments.

  • Type
    • Uterine cancer
    • Ovarian cancer
    • Cervical cancer
    • Others
  • Modality
    • Chemotherapy
    • Targeted therapy
    • Hormonal therapy
  • Geography
    • North America
      • US
      • Canada
    • Europe
      • Germany
      • UK
    • APAC
      • China
    • Rest of World (ROW)

By Type Insights

The uterine cancer segment is estimated to witness significant growth during the forecast period.

Uterine cancer, specifically endometrial cancer, arises from the inner lining of the uterus and is the fourth most common cancer among women in the US, with approximately 65,950 new cases expected to be diagnosed in 2022, according to the American Cancer Society. Genetic testing plays a crucial role in identifying the underlying causes and potential risk factors for uterine cancer. Research funding from various organizations and healthcare policy initiatives drives advancements in molecular diagnostics and clinical trials for early cancer detection and precision medicine. Patient support groups and advocacy organizations provide essential resources for patients, ensuring quality of life during cancer diagnosis and treatment.

Drug development and approval processes prioritize targeted therapy and hormonal treatments for uterine cancer, while machine learning and artificial intelligence facilitate data analytics and personalized medicine. Healthcare providers and Medical Devices contribute to improved patient care and reproductive health, with a focus on cancer prevention, screening, and cancer recurrence management. Ovarian and vaginal cancers, along with cervical and vulvar cancers, are also significant concerns within gynecological cancers. Clinical research and drug discovery efforts continue to advance our understanding of these complex diseases and pave the way for innovative treatments and improved cancer survival rates.

Gynecological Cancers Therapeutics Market Size

Request Free Sample

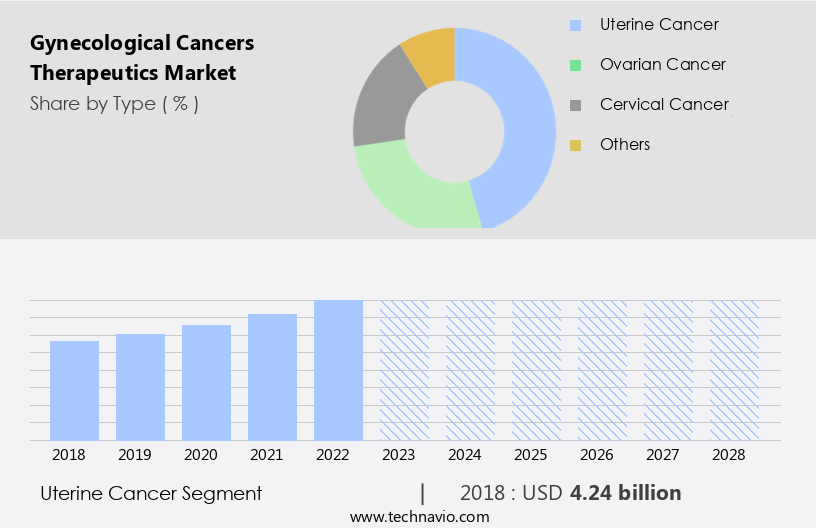
The Uterine cancer segment was valued at USD 4.24 billion in 2018 and showed a gradual increase during the forecast period.

Regional Analysis

North America is estimated to contribute 43% to the growth of the global market during the forecast period.Technavio's analysts have elaborately explained the regional trends and drivers that shape the market during the forecast period.

Gynecological Cancers Therapeutics Market Share by Geography

 Request Free Sample

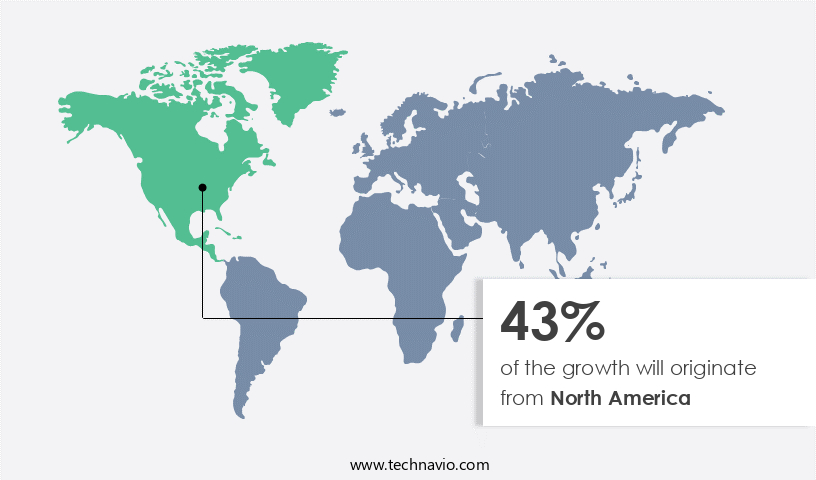
In North America, the market is experiencing significant growth due to several key factors. The increasing incidence of gynecological cancers, such as ovarian and cervical cancers, is a major driver of market expansion. For instance, in the US alone, it is estimated that over 14,000 women will be diagnosed with cervical cancer, and over 4,000 may succumb to the disease in 2022, despite undergoing screening and treatment. Similarly, ovarian cancer, which causes more deaths than any other gynecological cancer, is a significant concern. Government initiatives and favorable reimbursement schemes are also contributing to market growth. For example, the US National Cancer Institute (NCI) has launched several initiatives to improve cancer diagnosis and treatment, including the Precision Medicine Initiative and the Cancer Moonshot program.

Additionally, the availability of new drugs for gynecological cancers, such as targeted therapies and hormonal treatments, is driving market growth. Furthermore, advancements in technology, such as machine learning and artificial intelligence, are enabling the development of more effective diagnostic tools and personalized treatment plans. Molecular diagnostics and genetic testing are becoming increasingly important in the diagnosis and treatment of gynecological cancers, as they allow for more precise identification of cancer types and subtypes. Patient advocacy groups and healthcare providers are also playing a crucial role in raising awareness about gynecological cancers and improving patient care. Clinical trials and research funding are essential for advancing cancer treatment and improving patient outcomes.

The focus on precision medicine and personalized treatment plans is leading to better quality of life for patients and increased cancer survival rates. The market for gynecological cancers therapeutics is also being shaped by regulatory developments, such as drug approvals and drug regulations. For instance, the US Food and Drug Administration (FDA) has approved several new drugs for gynecological cancers in recent years, including drugs for ovarian, cervical, and endometrial cancers. In conclusion, the market in North America is experiencing significant growth due to the increasing incidence of gynecological cancers, government initiatives, favorable reimbursement schemes, and technological advancements. The availability of new drugs and regulatory approvals, as well as the focus on precision medicine and patient care, are also contributing to market expansion.

Market Dynamics

Our researchers analyzed the data with 2023 as the base year, along with the key drivers, trends, and challenges. A holistic analysis of drivers will help companies refine their marketing strategies to gain a competitive advantage.

What are the key market drivers leading to the rise in the adoption of Gynecological Cancers Therapeutics Industry?

  • The rising prevalence of gynecological cancers serves as the primary market driver. 
  • Gynecological cancers, which include cervical, ovarian, uterine, vaginal, and vulvar cancers, are among the most common types of cancer diagnosed in women after breast cancer in the US. According to the Centers for Disease Control and Prevention (CDC), approximately 71,500 new cases and 26,500 deaths are attributed to gynecological cancers annually in the US. The risk of developing these cancers increases with age. Advancements in genetic testing, molecular diagnostics, and cancer screening are crucial in early detection and improving the quality of life for patients. Research funding and patient support organizations play a significant role in advancing precision medicine and developing new treatments for gynecological cancers.
  • The increasing incidence of gynecological cancers, particularly cervical, uterine, and ovarian cancer, can be attributed to risk factors such as obesity, viral infections, smoking, and immune system deficiency. It is essential to prioritize cancer prevention and early detection through regular screenings and lifestyle modifications to reduce the risk of developing gynecological cancers. In conclusion, the advancements in cancer research and diagnostics, coupled with increased awareness and funding, offer hope for improving the lives of those affected by gynecological cancers. By focusing on early detection and prevention, we can reduce the number of new cases and deaths attributed to these cancers.

What are the market trends shaping the Gynecological Cancers Therapeutics Industry?

  • The emergence of novel therapies is a significant market trend, reflecting the ongoing advancements in healthcare and scientific research. Innovative treatments are increasingly shaping the industry landscape, offering new hope for patients and driving growth in various sectors.
  • Gynecological cancers, including uterine and ovarian varieties, pose significant challenges in patient care and reproductive health. However, the landscape of therapeutics is evolving, with a focus on cancer prevention and innovative treatments. Clinical trials are ongoing to discover and develop safer drugs for gynecological cancers, leading to the emergence of advanced therapies such as gene therapy, hormonal therapy, and chimeric antigen receptor (CAR) T-Cell Therapy. Gene therapy holds great promise against gynecological cancers, particularly ovarian cancer. This approach utilizes various strategies, such as immunopotentiation, angiogenesis inhibition, pharmacological resistance alteration, gene restoration or destruction, suicide genes, and oncolytic virotherapy.
  • These strategies aim to combat gynecological cancers more effectively and with fewer side effects. Machine learning and healthcare policy initiatives are also playing crucial roles in advancing gynecological cancer therapeutics. By analyzing vast amounts of data, machine learning algorithms can help identify potential drug targets and personalized treatment plans for patients. Additionally, healthcare policies that prioritize cancer research and patient care contribute to the overall progress in this field. In conclusion, the ongoing research and development efforts in gynecological cancer therapeutics are yielding significant advancements. Innovative therapies like gene therapy, hormonal therapy, and CAR T-cell therapy are emerging as promising options for treating gynecological cancers, such as ovarian and uterine cancer.
  • The integration of technologies like machine learning and healthcare policy initiatives is further accelerating progress in this field.

What challenges does the Gynecological Cancers Therapeutics Industry face during its growth?

  • The escalating costs of treatment represent a significant obstacle to the expansion and growth of the industry. 
  • Gynecological cancers, including cervical and vulvar cancers, necessitate prolonged treatment, leading to substantial economic burdens for patients. The high cost is primarily due to the advanced procedures involved in the development of targeted therapies, such as Monoclonal Antibodies. These therapies, which include biologics, undergo intricate manufacturing processes that significantly increase their production costs and, consequently, their sales prices. Patient advocacy groups are pushing for more affordable treatment options and increased drug regulation to ensure the approval of cost-effective alternatives.
  • Precision oncology, a key area of focus in cancer treatment, is expected to bring about more targeted and effective therapies, potentially reducing overall treatment costs. Despite these efforts, the financial burden on patients with gynecological cancers remains a significant challenge.

Exclusive Customer Landscape

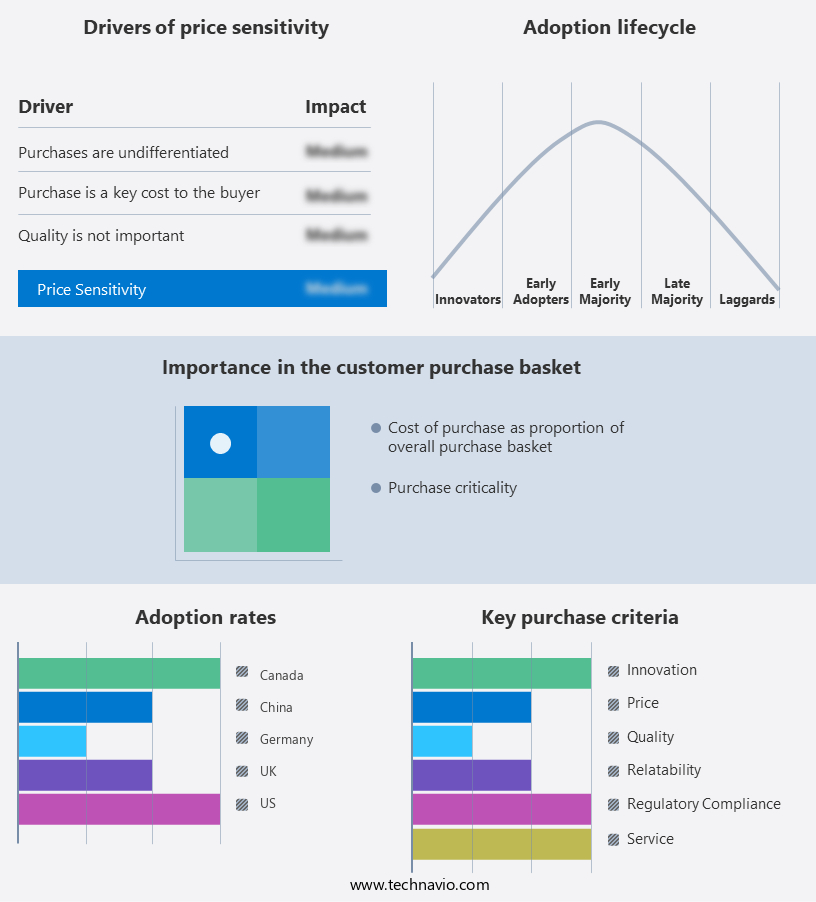
The gynecological cancers therapeutics market forecasting report includes the adoption lifecycle of the market, covering from the innovator's stage to the laggard's stage. It focuses on adoption rates in different regions based on penetration. Furthermore, the gynecological cancers therapeutics market report also includes key purchase criteria and drivers of price sensitivity to help companies evaluate and develop their market growth analysis strategies.

Gynecological Cancers Therapeutics Market Share by Geography

 Customer Landscape

Key Companies & Market Insights

Companies are implementing various strategies, such as strategic alliances, gynecological cancers therapeutics market forecast, partnerships, mergers and acquisitions, geographical expansion, and product/service launches, to enhance their presence in the industry.

AbbVie Inc. - The company specializes in gynecological cancers therapeutics, including Elahere (mirvetuximab soravtansine-gynx), an innovative antibody-drug conjugate (ADC) approved for platinum-resistant ovarian cancer (PROC). This first-in-class ADC targets folate receptor alpha (FolR?), a protein overexpressed in many gynecological cancers. By selectively binding to FolR?, Elahere delivers a potent cytotoxic payload, enhancing tumor cell destruction while minimizing harm to healthy cells. This targeted approach offers a promising solution for women with PROC, who have limited treatment options and poor prognosis. Elahere's approval marks a significant milestone in the ongoing fight against gynecological cancers, demonstrating the company's commitment to advancing cancer care through groundbreaking therapies.

The industry research and growth report includes detailed analyses of the competitive landscape of the market and information about key companies, including:

  • AbbVie Inc.
  • Amgen Inc.
  • Apotex Inc.
  • AstraZeneca Plc
  • Bayer AG
  • Bristol Myers Squibb Co.
  • Cipla Ltd.
  • Eli Lilly and Co.
  • F. Hoffmann La Roche Ltd.
  • GlaxoSmithKline Plc
  • Hikma Pharmaceuticals Plc
  • Merck and Co. Inc.
  • Novartis AG
  • Pfizer Inc.
  • Sanofi SA
  • Takeda Pharmaceutical Co. Ltd.
  • Teva Pharmaceutical Industries Ltd.

Qualitative and quantitative analysis of companies has been conducted to help clients understand the wider business environment as well as the strengths and weaknesses of key industry players. Data is qualitatively analyzed to categorize companies as pure play, category-focused, industry-focused, and diversified; it is quantitatively analyzed to categorize companies as dominant, leading, strong, tentative, and weak.

Recent Development and News in Gynecological Cancers Therapeutics Market

  • In February 2024, Roche Holding AG announced the US Food and Drug Administration (FDA) approval of its new targeted therapy, Polatuzumab Vedotin-piiq, in combination with bendamustine and a rituximab regimen for the treatment of relapsed or refractory diffuse large B-cell lymphoma (DLBCL) in adult patients. This approval expanded the company's oncology portfolio and addressed an unmet medical need in the market (Roche Press Release, 2024).
  • In March 2025, Pfizer Inc. And Merck KGaA, Darmstadt, Germany, entered into a strategic collaboration to develop and commercialize avelumab, an investigational fully human anti-programmed death-ligand 1 (PD-L1) antibody, for the treatment of various gynecological cancers, including ovarian and endometrial cancers. This collaboration combined Pfizer's commercial capabilities with Merck KGaA's expertise in immuno-oncology, aiming to bring innovative treatments to patients (Pfizer Press Release, 2025).
  • In June 2024, AstraZeneca plc completed the acquisition of Alexion Pharmaceuticals Inc. For approximately USD30 billion. This acquisition granted AstraZeneca access to Alexion's portfolio of complement-dependent therapeutic products, including Ultomiris, a long-acting C5 complement inhibitor for the prevention of paroxysmal nocturnal hemoglobinuria (PNH) and atypical hemolytic uremic syndrome (aHUS) in adult and pediatric patients. This acquisition expanded AstraZeneca's presence in the market, particularly in the area of rare diseases (AstraZeneca Press Release, 2024).
  • In October 2025, the European Commission approved the use of Keytruda (pembrolizumab), an anti-PD-1 therapy from Merck & Co. Inc., for the treatment of recurrent or advanced endometrial carcinoma that has progressed following prior platinum-containing chemotherapy. This approval marked the first PD-1 inhibitor to receive approval for this indication in Europe and represented a significant advancement in the treatment landscape for endometrial cancer patients (Merck Press Release, 2025).

Research Analyst Overview

The market is witnessing significant advancements, driven by the integration of disease management strategies and patient education. Neoadjuvant therapy, a crucial component of disease management, is gaining traction due to its ability to improve treatment outcomes and reduce the need for extensive surgeries. Tumor heterogeneity poses a challenge in developing effective therapies, leading to the exploration of immune checkpoint inhibitors and car T-cell therapy. However, managing side effects and drug interactions remains a concern. The tumor microenvironment and cancer stem cells are increasingly being recognized as key targets for novel therapies, including cytotoxic agents, parp inhibitors, and angiogenesis inhibitors. Personalized treatment plans, enabled by cancer genomics and next-generation sequencing, are revolutionizing care.

Health outcomes, including quality-adjusted life years, are the ultimate goal, with adjuvant therapy and palliative care playing essential roles in improving patient empowerment and survival rates. Liquid biopsies offer promising opportunities for early detection and monitoring disease progression. Overall, the market is dynamic, with ongoing research and innovation shaping the future of cancer care.

Dive into Technavio's robust research methodology, blending expert interviews, extensive data synthesis, and validated models for unparalleled Gynecological Cancers Therapeutics Market insights. See full methodology.

Market Scope

Report Coverage

Details

Page number

173

Base year

2023

Historic period

2018-2022

Forecast period

2024-2028

Growth momentum & CAGR

Accelerate at a CAGR of 15.83%

Market growth 2024-2028

USD 19.15 billion

Market structure

Fragmented

YoY growth 2023-2024(%)

13.17

Key countries

US, Canada, Germany, UK, and China

Competitive landscape

Leading Companies, Market Positioning of Companies, Competitive Strategies, and Industry Risks

Request Free Sample

What are the Key Data Covered in this Gynecological Cancers Therapeutics Market Research and Growth Report?

  • CAGR of the Gynecological Cancers Therapeutics industry during the forecast period
  • Detailed information on factors that will drive the growth and forecasting between 2024 and 2028
  • Precise estimation of the size of the market and its contribution of the industry in focus to the parent market
  • Accurate predictions about upcoming growth and trends and changes in consumer behaviour
  • Growth of the market across North America, Europe, Asia, and Rest of World (ROW)
  • Thorough analysis of the market's competitive landscape and detailed information about companies
  • Comprehensive analysis of factors that will challenge the gynecological cancers therapeutics market growth of industry companies

We can help! Our analysts can customize this gynecological cancers therapeutics market research report to meet your requirements.

Get in touch

1 Executive Summary

  • 1.1 Market overview
    • Exhibit 01: Executive Summary – Chart on Market Overview
    • Exhibit 02: Executive Summary – Data Table on Market Overview
    • Exhibit 03: Executive Summary – Chart on Global Market Characteristics
    • Exhibit 04: Executive Summary – Chart on Market by Geography
    • Exhibit 05: Executive Summary – Chart on Market Segmentation by Type
    • Exhibit 06: Executive Summary – Chart on Market Segmentation by Modality
    • Exhibit 07: Executive Summary – Chart on Incremental Growth
    • Exhibit 08: Executive Summary – Data Table on Incremental Growth
    • Exhibit 09: Executive Summary – Chart on Vendor Market Positioning

2 Market Landscape

  • 2.1 Market ecosystem
    • Exhibit 10: Parent market
    • Exhibit 11: Market Characteristics

3 Market Sizing

  • 3.1 Market definition
    • Exhibit 12: Offerings of vendors included in the market definition
  • 3.2 Market segment analysis
    • Exhibit 13: Market segments
  • 3.3 Market size 2023
    • 3.4 Market outlook: Forecast for 2023-2028
      • Exhibit 14: Chart on Global - Market size and forecast 2023-2028 ($ billion)
      • Exhibit 15: Data Table on Global - Market size and forecast 2023-2028 ($ billion)
      • Exhibit 16: Chart on Global Market: Year-over-year growth 2023-2028 (%)
      • Exhibit 17: Data Table on Global Market: Year-over-year growth 2023-2028 (%)

    4 Historic Market Size

    • 4.1 Global gynecological cancers therapeutics market 2018 - 2022
      • Exhibit 18: Historic Market Size – Data Table on global gynecological cancers therapeutics market 2018 - 2022 ($ billion)
    • 4.2 Type Segment Analysis 2018 - 2022
      • Exhibit 19: Historic Market Size – Type Segment 2018 - 2022 ($ billion)
    • 4.3 Modality Segment Analysis 2018 - 2022
      • Exhibit 20: Historic Market Size – Modality Segment 2018 - 2022 ($ billion)
    • 4.4 Geography Segment Analysis 2018 - 2022
      • Exhibit 21: Historic Market Size – Geography Segment 2018 - 2022 ($ billion)
    • 4.5 Country Segment Analysis 2018 - 2022
      • Exhibit 22: Historic Market Size – Country Segment 2018 - 2022 ($ billion)

    5 Five Forces Analysis

    • 5.1 Five forces summary
      • Exhibit 23: Five forces analysis - Comparison between 2023 and 2028
    • 5.2 Bargaining power of buyers
      • Exhibit 24: Chart on Bargaining power of buyers – Impact of key factors 2023 and 2028
    • 5.3 Bargaining power of suppliers
      • Exhibit 25: Bargaining power of suppliers – Impact of key factors in 2023 and 2028
    • 5.4 Threat of new entrants
      • Exhibit 26: Threat of new entrants – Impact of key factors in 2023 and 2028
    • 5.5 Threat of substitutes
      • Exhibit 27: Threat of substitutes – Impact of key factors in 2023 and 2028
    • 5.6 Threat of rivalry
      • Exhibit 28: Threat of rivalry – Impact of key factors in 2023 and 2028
    • 5.7 Market condition
      • Exhibit 29: Chart on Market condition - Five forces 2023 and 2028

    6 Market Segmentation by Type

    • 6.1 Market segments
      • Exhibit 30: Chart on Type - Market share 2023-2028 (%)
      • Exhibit 31: Data Table on Type - Market share 2023-2028 (%)
    • 6.2 Comparison by Type
      • Exhibit 32: Chart on Comparison by Type
      • Exhibit 33: Data Table on Comparison by Type
    • 6.3 Uterine cancer - Market size and forecast 2023-2028
      • Exhibit 34: Chart on Uterine cancer - Market size and forecast 2023-2028 ($ billion)
      • Exhibit 35: Data Table on Uterine cancer - Market size and forecast 2023-2028 ($ billion)
      • Exhibit 36: Chart on Uterine cancer - Year-over-year growth 2023-2028 (%)
      • Exhibit 37: Data Table on Uterine cancer - Year-over-year growth 2023-2028 (%)
    • 6.4 Ovarian cancer - Market size and forecast 2023-2028
      • Exhibit 38: Chart on Ovarian cancer - Market size and forecast 2023-2028 ($ billion)
      • Exhibit 39: Data Table on Ovarian cancer - Market size and forecast 2023-2028 ($ billion)
      • Exhibit 40: Chart on Ovarian cancer - Year-over-year growth 2023-2028 (%)
      • Exhibit 41: Data Table on Ovarian cancer - Year-over-year growth 2023-2028 (%)
    • 6.5 Cervical cancer - Market size and forecast 2023-2028
      • Exhibit 42: Chart on Cervical cancer - Market size and forecast 2023-2028 ($ billion)
      • Exhibit 43: Data Table on Cervical cancer - Market size and forecast 2023-2028 ($ billion)
      • Exhibit 44: Chart on Cervical cancer - Year-over-year growth 2023-2028 (%)
      • Exhibit 45: Data Table on Cervical cancer - Year-over-year growth 2023-2028 (%)
    • 6.6 Others - Market size and forecast 2023-2028
      • Exhibit 46: Chart on Others - Market size and forecast 2023-2028 ($ billion)
      • Exhibit 47: Data Table on Others - Market size and forecast 2023-2028 ($ billion)
      • Exhibit 48: Chart on Others - Year-over-year growth 2023-2028 (%)
      • Exhibit 49: Data Table on Others - Year-over-year growth 2023-2028 (%)
    • 6.7 Market opportunity by Type
      • Exhibit 50: Market opportunity by Type ($ billion)
      • Exhibit 51: Data Table on Market opportunity by Type ($ billion)

    7 Market Segmentation by Modality

    • 7.1 Market segments
      • Exhibit 52: Chart on Modality - Market share 2023-2028 (%)
      • Exhibit 53: Data Table on Modality - Market share 2023-2028 (%)
    • 7.2 Comparison by Modality
      • Exhibit 54: Chart on Comparison by Modality
      • Exhibit 55: Data Table on Comparison by Modality
    • 7.3 Chemotherapy - Market size and forecast 2023-2028
      • Exhibit 56: Chart on Chemotherapy - Market size and forecast 2023-2028 ($ billion)
      • Exhibit 57: Data Table on Chemotherapy - Market size and forecast 2023-2028 ($ billion)
      • Exhibit 58: Chart on Chemotherapy - Year-over-year growth 2023-2028 (%)
      • Exhibit 59: Data Table on Chemotherapy - Year-over-year growth 2023-2028 (%)
    • 7.4 Targeted therapy - Market size and forecast 2023-2028
      • Exhibit 60: Chart on Targeted therapy - Market size and forecast 2023-2028 ($ billion)
      • Exhibit 61: Data Table on Targeted therapy - Market size and forecast 2023-2028 ($ billion)
      • Exhibit 62: Chart on Targeted therapy - Year-over-year growth 2023-2028 (%)
      • Exhibit 63: Data Table on Targeted therapy - Year-over-year growth 2023-2028 (%)
    • 7.5 Hormonal therapy - Market size and forecast 2023-2028
      • Exhibit 64: Chart on Hormonal therapy - Market size and forecast 2023-2028 ($ billion)
      • Exhibit 65: Data Table on Hormonal therapy - Market size and forecast 2023-2028 ($ billion)
      • Exhibit 66: Chart on Hormonal therapy - Year-over-year growth 2023-2028 (%)
      • Exhibit 67: Data Table on Hormonal therapy - Year-over-year growth 2023-2028 (%)
    • 7.6 Market opportunity by Modality
      • Exhibit 68: Market opportunity by Modality ($ billion)
      • Exhibit 69: Data Table on Market opportunity by Modality ($ billion)

    8 Customer Landscape

    • 8.1 Customer landscape overview
      • Exhibit 70: Analysis of price sensitivity, lifecycle, customer purchase basket, adoption rates, and purchase criteria

    9 Geographic Landscape

    • 9.1 Geographic segmentation
      • Exhibit 71: Chart on Market share by geography 2023-2028 (%)
      • Exhibit 72: Data Table on Market share by geography 2023-2028 (%)
    • 9.2 Geographic comparison
      • Exhibit 73: Chart on Geographic comparison
      • Exhibit 74: Data Table on Geographic comparison
    • 9.3 North America - Market size and forecast 2023-2028
      • Exhibit 75: Chart on North America - Market size and forecast 2023-2028 ($ billion)
      • Exhibit 76: Data Table on North America - Market size and forecast 2023-2028 ($ billion)
      • Exhibit 77: Chart on North America - Year-over-year growth 2023-2028 (%)
      • Exhibit 78: Data Table on North America - Year-over-year growth 2023-2028 (%)
    • 9.4 Europe - Market size and forecast 2023-2028
      • Exhibit 79: Chart on Europe - Market size and forecast 2023-2028 ($ billion)
      • Exhibit 80: Data Table on Europe - Market size and forecast 2023-2028 ($ billion)
      • Exhibit 81: Chart on Europe - Year-over-year growth 2023-2028 (%)
      • Exhibit 82: Data Table on Europe - Year-over-year growth 2023-2028 (%)
    • 9.5 Asia - Market size and forecast 2023-2028
      • Exhibit 83: Chart on Asia - Market size and forecast 2023-2028 ($ billion)
      • Exhibit 84: Data Table on Asia - Market size and forecast 2023-2028 ($ billion)
      • Exhibit 85: Chart on Asia - Year-over-year growth 2023-2028 (%)
      • Exhibit 86: Data Table on Asia - Year-over-year growth 2023-2028 (%)
    • 9.6 Rest of World (ROW) - Market size and forecast 2023-2028
      • Exhibit 87: Chart on Rest of World (ROW) - Market size and forecast 2023-2028 ($ billion)
      • Exhibit 88: Data Table on Rest of World (ROW) - Market size and forecast 2023-2028 ($ billion)
      • Exhibit 89: Chart on Rest of World (ROW) - Year-over-year growth 2023-2028 (%)
      • Exhibit 90: Data Table on Rest of World (ROW) - Year-over-year growth 2023-2028 (%)
    • 9.7 US - Market size and forecast 2023-2028
      • Exhibit 91: Chart on US - Market size and forecast 2023-2028 ($ billion)
      • Exhibit 92: Data Table on US - Market size and forecast 2023-2028 ($ billion)
      • Exhibit 93: Chart on US - Year-over-year growth 2023-2028 (%)
      • Exhibit 94: Data Table on US - Year-over-year growth 2023-2028 (%)
    • 9.8 Germany - Market size and forecast 2023-2028
      • Exhibit 95: Chart on Germany - Market size and forecast 2023-2028 ($ billion)
      • Exhibit 96: Data Table on Germany - Market size and forecast 2023-2028 ($ billion)
      • Exhibit 97: Chart on Germany - Year-over-year growth 2023-2028 (%)
      • Exhibit 98: Data Table on Germany - Year-over-year growth 2023-2028 (%)
    • 9.9 China - Market size and forecast 2023-2028
      • Exhibit 99: Chart on China - Market size and forecast 2023-2028 ($ billion)
      • Exhibit 100: Data Table on China - Market size and forecast 2023-2028 ($ billion)
      • Exhibit 101: Chart on China - Year-over-year growth 2023-2028 (%)
      • Exhibit 102: Data Table on China - Year-over-year growth 2023-2028 (%)
    • 9.10 Canada - Market size and forecast 2023-2028
      • Exhibit 103: Chart on Canada - Market size and forecast 2023-2028 ($ billion)
      • Exhibit 104: Data Table on Canada - Market size and forecast 2023-2028 ($ billion)
      • Exhibit 105: Chart on Canada - Year-over-year growth 2023-2028 (%)
      • Exhibit 106: Data Table on Canada - Year-over-year growth 2023-2028 (%)
    • 9.11 UK - Market size and forecast 2023-2028
      • Exhibit 107: Chart on UK - Market size and forecast 2023-2028 ($ billion)
      • Exhibit 108: Data Table on UK - Market size and forecast 2023-2028 ($ billion)
      • Exhibit 109: Chart on UK - Year-over-year growth 2023-2028 (%)
      • Exhibit 110: Data Table on UK - Year-over-year growth 2023-2028 (%)
    • 9.12 Market opportunity by geography
      • Exhibit 111: Market opportunity by geography ($ billion)
      • Exhibit 112: Data Tables on Market opportunity by geography ($ billion)

    10 Drivers, Challenges, and Trends

    • 10.1 Market drivers
      • 10.2 Market challenges
        • 10.3 Impact of drivers and challenges
          • Exhibit 113: Impact of drivers and challenges in 2023 and 2028
        • 10.4 Market trends

          11 Vendor Landscape

          • 11.1 Overview
            • 11.2 Vendor landscape
              • Exhibit 114: Overview on Criticality of inputs and Factors of differentiation
            • 11.3 Landscape disruption
              • Exhibit 115: Overview on factors of disruption
            • 11.4 Industry risks
              • Exhibit 116: Impact of key risks on business

            12 Vendor Analysis

            • 12.1 Vendors covered
              • Exhibit 117: Vendors covered
            • 12.2 Market positioning of vendors
              • Exhibit 118: Matrix on vendor position and classification
            • 12.3 AbbVie Inc.
              • Exhibit 119: AbbVie Inc. - Overview
              • Exhibit 120: AbbVie Inc. - Product / Service
              • Exhibit 121: AbbVie Inc. - Key news
              • Exhibit 122: AbbVie Inc. - Key offerings
            • 12.4 Amgen Inc.
              • Exhibit 123: Amgen Inc. - Overview
              • Exhibit 124: Amgen Inc. - Product / Service
              • Exhibit 125: Amgen Inc. - Key offerings
            • 12.5 Apotex Inc.
              • Exhibit 126: Apotex Inc. - Overview
              • Exhibit 127: Apotex Inc. - Product / Service
              • Exhibit 128: Apotex Inc. - Key offerings
            • 12.6 AstraZeneca Plc
              • Exhibit 129: AstraZeneca Plc - Overview
              • Exhibit 130: AstraZeneca Plc - Product / Service
              • Exhibit 131: AstraZeneca Plc - Key news
              • Exhibit 132: AstraZeneca Plc - Key offerings
            • 12.7 Bayer AG
              • Exhibit 133: Bayer AG - Overview
              • Exhibit 134: Bayer AG - Business segments
              • Exhibit 135: Bayer AG - Key news
              • Exhibit 136: Bayer AG - Key offerings
              • Exhibit 137: Bayer AG - Segment focus
            • 12.8 Bristol Myers Squibb Co.
              • Exhibit 138: Bristol Myers Squibb Co. - Overview
              • Exhibit 139: Bristol Myers Squibb Co. - Product / Service
              • Exhibit 140: Bristol Myers Squibb Co. - Key news
              • Exhibit 141: Bristol Myers Squibb Co. - Key offerings
            • 12.9 Cipla Ltd.
              • Exhibit 142: Cipla Ltd. - Overview
              • Exhibit 143: Cipla Ltd. - Business segments
              • Exhibit 144: Cipla Ltd. - Key news
              • Exhibit 145: Cipla Ltd. - Key offerings
              • Exhibit 146: Cipla Ltd. - Segment focus
            • 12.10 Eli Lilly and Co.
              • Exhibit 147: Eli Lilly and Co. - Overview
              • Exhibit 148: Eli Lilly and Co. - Product / Service
              • Exhibit 149: Eli Lilly and Co. - Key news
              • Exhibit 150: Eli Lilly and Co. - Key offerings
            • 12.11 F. Hoffmann La Roche Ltd.
              • Exhibit 151: F. Hoffmann La Roche Ltd. - Overview
              • Exhibit 152: F. Hoffmann La Roche Ltd. - Business segments
              • Exhibit 153: F. Hoffmann La Roche Ltd. - Key news
              • Exhibit 154: F. Hoffmann La Roche Ltd. - Key offerings
              • Exhibit 155: F. Hoffmann La Roche Ltd. - Segment focus
            • 12.12 GlaxoSmithKline Plc
              • Exhibit 156: GlaxoSmithKline Plc - Overview
              • Exhibit 157: GlaxoSmithKline Plc - Business segments
              • Exhibit 158: GlaxoSmithKline Plc - Key news
              • Exhibit 159: GlaxoSmithKline Plc - Key offerings
              • Exhibit 160: GlaxoSmithKline Plc - Segment focus
            • 12.13 Hikma Pharmaceuticals Plc
              • Exhibit 161: Hikma Pharmaceuticals Plc - Overview
              • Exhibit 162: Hikma Pharmaceuticals Plc - Business segments
              • Exhibit 163: Hikma Pharmaceuticals Plc - Key offerings
              • Exhibit 164: Hikma Pharmaceuticals Plc - Segment focus
            • 12.14 Merck and Co. Inc.
              • Exhibit 165: Merck and Co. Inc. - Overview
              • Exhibit 166: Merck and Co. Inc. - Business segments
              • Exhibit 167: Merck and Co. Inc. - Key news
              • Exhibit 168: Merck and Co. Inc. - Key offerings
              • Exhibit 169: Merck and Co. Inc. - Segment focus
            • 12.15 Novartis AG
              • Exhibit 170: Novartis AG - Overview
              • Exhibit 171: Novartis AG - Business segments
              • Exhibit 172: Novartis AG - Key offerings
              • Exhibit 173: Novartis AG - Segment focus
            • 12.16 Pfizer Inc.
              • Exhibit 174: Pfizer Inc. - Overview
              • Exhibit 175: Pfizer Inc. - Product / Service
              • Exhibit 176: Pfizer Inc. - Key news
              • Exhibit 177: Pfizer Inc. - Key offerings
            • 12.17 Sanofi SA
              • Exhibit 178: Sanofi SA - Overview
              • Exhibit 179: Sanofi SA - Business segments
              • Exhibit 180: Sanofi SA - Key news
              • Exhibit 181: Sanofi SA - Key offerings
              • Exhibit 182: Sanofi SA - Segment focus

            13 Appendix

            • 13.1 Scope of the report
              • 13.2 Inclusions and exclusions checklist
                • Exhibit 183: Inclusions checklist
                • Exhibit 184: Exclusions checklist
              • 13.3 Currency conversion rates for US$
                • Exhibit 185: Currency conversion rates for US$
              • 13.4 Research methodology
                • Exhibit 186: Research methodology
                • Exhibit 187: Validation techniques employed for market sizing
                • Exhibit 188: Information sources
              • 13.5 List of abbreviations
                • Exhibit 189: List of abbreviations

              Research Methodology

              Technavio presents a detailed picture of the market by way of study, synthesis, and summation of data from multiple sources. The analysts have presented the various facets of the market with a particular focus on identifying the key industry influencers. The data thus presented is comprehensive, reliable, and the result of extensive research, both primary and secondary.

              INFORMATION SOURCES

              Primary sources

              • Manufacturers and suppliers
              • Channel partners
              • Industry experts
              • Strategic decision makers

              Secondary sources

              • Industry journals and periodicals
              • Government data
              • Financial reports of key industry players
              • Historical data
              • Press releases

              DATA ANALYSIS

              Data Synthesis

              • Collation of data
              • Estimation of key figures
              • Analysis of derived insights

              Data Validation

              • Triangulation with data models
              • Reference against proprietary databases
              • Corroboration with industry experts

              REPORT WRITING

              Qualitative

              • Market drivers
              • Market challenges
              • Market trends
              • Five forces analysis

              Quantitative

              • Market size and forecast
              • Market segmentation
              • Geographical insights
              • Competitive landscape

              Interested in this report?

              Get your sample now to see our research methodology and insights!

              Download Now

              Frequently Asked Questions

              Gynecological Cancers Therapeutics market growth will increase by $ 19.15 bn during 2024-2028 .

              The Gynecological Cancers Therapeutics market is expected to grow at a CAGR of 15.83% during 2024-2028 .

              Gynecological Cancers Therapeutics market is segmented by Type( Uterine cancer, Ovarian cancer, Cervical cancer, Others) Modality( Chemotherapy, Targeted therapy, Hormonal therapy, Rest of World (ROW))

              AbbVie Inc., Amgen Inc., Apotex Inc., AstraZeneca Plc, Bayer AG, Bristol Myers Squibb Co., Cipla Ltd., Eli Lilly and Co., F. Hoffmann La Roche Ltd., GlaxoSmithKline Plc, Hikma Pharmaceuticals Plc, Merck and Co. Inc., Novartis AG, Pfizer Inc., Sanofi SA, Takeda Pharmaceutical Co. Ltd., Teva Pharmaceutical Industries Ltd. are a few of the key vendors in the Gynecological Cancers Therapeutics market.

              North America will register the highest growth rate of 43% among the other regions. Therefore, the Gynecological Cancers Therapeutics market in North America is expected to garner significant business opportunities for the vendors during the forecast period.

              US, Canada, Germany, UK, China

              • Increasing incidence of gynecological cancersGynecological cancers are one of the most frequently diagnosed cancers in women after breast cancer. As per the CDC is the driving factor this market.
              • in the US is the driving factor this market.
              • all women have a high risk of developing gynecological cancers is the driving factor this market.
              • which increase with age. As per the CDC is the driving factor this market.
              • it has been estimated that each year in the US is the driving factor this market.
              • about 71 is the driving factor this market.
              • 500 new cases of gynecological cancers are diagnosed is the driving factor this market.
              • and about 26 is the driving factor this market.
              • 500 deaths are attributed to gynecological cancers is the driving factor this market.
              • including cervical is the driving factor this market.
              • ovarian is the driving factor this market.
              • uterine is the driving factor this market.
              • vaginal is the driving factor this market.
              • and vulvar cancers. At present is the driving factor this market.
              • the incidence of gynecological cancers such as cervical is the driving factor this market.
              • uterine is the driving factor this market.
              • and ovarian cancer is dramatically increasing throughout the world. The increasing incidence can be attributed to risk factors such as obesity is the driving factor this market.
              • viral infections is the driving factor this market.
              • smoking is the driving factor this market.
              • and immune system deficiency. For instance is the driving factor this market.
              • the incidence of endometrial cancer is the driving factor this market.
              • the most common type of uterine cancer is the driving factor this market.
              • has been increasing because of the obesity epidemic. Hence is the driving factor this market.
              • the incidence rate of uterine cancer increased by 12% in 2021 at an average of 1% per year. In 2020 is the driving factor this market.
              • 417 is the driving factor this market.
              • 367 people were diagnosed with uterine cancer in the world. The second-most common type of gynecological cancer is ovarian cancer is the driving factor this market.
              • and the incidence of this cancer has been declining in many regions owing to improved prevention techniques and early detection. Despite this is the driving factor this market.
              • as per the CDC is the driving factor this market.
              • each year is the driving factor this market.
              • about 20 is the driving factor this market.
              • 000 women in the US are diagnosed with ovarian cancer. Regional disparities exist in the incidence of gynecological cancers. In low and middle-income countries is the driving factor this market.
              • the incidence of gynecological cancers is increasing due to the non-availability of or limited access to advanced diagnostic facilities. For instance is the driving factor this market.
              • the incidence of cervical cancer is rapidly increasing in Africa due to the huge prevalence of HPV infections is the driving factor this market.
              • which is a major risk factor for cervical cancer is the driving factor this market.
              • and because of poor diagnosis. On the other hand is the driving factor this market.
              • as per the CDC is the driving factor this market.
              • the incidence of cervical cancer has declined significantly in developed countries such as the US due to the increased use of regular Pap tests by women. Such factors are expected to drive the growth of the global gynecological cancers therapeutics market during the forecast period. is the driving factor this market.

              The Gynecological Cancers Therapeutics market vendors should focus on grabbing business opportunities from the Uterine cancer segment as it accounted for the largest market share in the base year.