Hand Tools Market Analysis North America, Europe, APAC, South America, Middle East and Africa - US, China, Germany, UK, France - Size and Forecast 2024-2028

Hand Tools Market Analysis North America, Europe, APAC, South America, Middle East and Africa - US, China, Germany, UK, France - Size and Forecast 2024-2028

Published: Mar 2024 167 Pages SKU: IRTNTR40224

Market Overview at a Glance

$2.66 B
Market Opportunity
4.45%
CAGR
4.15
YoY growth 2023-2024(%)

Hand Tools Market Size 2024-2028

The hand tools market size is forecast to increase by USD 2.66 billion at a CAGR of 4.45% between 2023 and 2028.

  • The hand tools market is driven by the demand for hand tools from developing economies, where rapid urbanization and industrialization are fueling construction and manufacturing activities. An upcoming trend in the market is the introduction of ergonomically designed hand tools. As consumer awareness increases regarding health and safety, there is a rising demand for power tools that offer greater comfort and reduce the risk of strain or injury, enhancing productivity and user satisfaction in both professional and DIY settings. 
  • However, the market is also facing challenges such as the fluctuating prices of raw materials used in manufacturing hand tools. These price fluctuations can impact the profitability of hand tool manufacturers and suppliers. Despite these challenges, the market is expected to continue its growth trajectory, driven by the increasing demand for hand tools, including non-ferrous industrial hand tools, in various industries and the ongoing innovation in hand tool design and technology.

What will be the Size of the Hand Tools Market During the Forecast Period?

Hand Tools Market Size

 Request Free Sample

  • The market encompasses a diverse range of instruments, including screwdrivers, pliers, wrenches, hammers, saws, and various specialized tools, catering to both industrial and household applications. This market is characterized by continuous innovation, with a focus on hand tool design manipulations, robustness, and reliable performance to meet the evolving needs of various industries and DIY enthusiasts. 
  • Customizations, extended tips, and lightweight tools are increasingly popular trends, enabling users to tackle a wider range of tasks with ease. The labor force and infrastructure supporting building activities continue to drive demand for hand tools, particularly in sectors such as automotive and construction. The market is further influenced by the rise of automation, sustainability, and digital platforms, including e-commerce sites and mobile apps, which facilitate convenient access to an expansive selection of hand tools.
  • Despite increasing material costs, the hand tools industry remains dynamic and responsive to market demands.

How is this Hand Tools Industry segmented and which is the largest segment?

The hand tools industry research report provides comprehensive data (region-wise segment analysis), with forecasts and estimates in "USD billion" for the period 2024-2028, as well as historical data from 2018-2022 for the following segments. 

  • Application
    • General-purpose
    • Metal cutting
    • Taps and dies and others
  • End-user
    • Industrial
    • Household
  • Distribution Channel
    • In Store
    • Online
  • Geography
    • North America
      • US
    • Europe
      • Germany
      • UK
      • France
    • APAC
      • China
    • South America
      • Brazil
    • Middle East and Africa
      • UAE

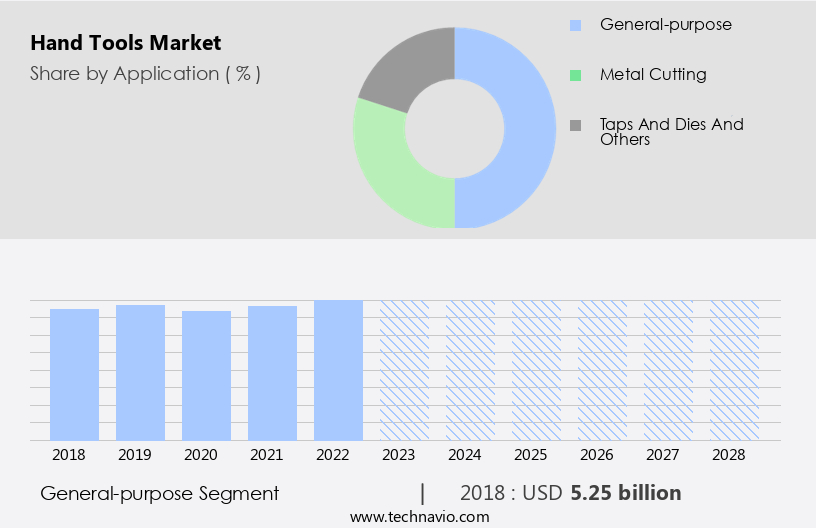
By Application Insights

  • The general-purpose segment is estimated to witness significant growth during the forecast period.

The market encompasses a wide range of instruments, including hammers, nail guns, screwdrivers, pliers, wrenches, and saws. These tools cater to various applications within the industrial, household, and DIY sectors. Hammers are utilized for tasks such as driving, shaping, and breaking, while screwdrivers are essential for turning different types of screws. Wrenches offer support in applying torque to turn objects, and pliers are used for gripping, turning, twisting, and cutting. Mallets provide a soft striking force and positive drive for objects on any surface.

The growth of this market is influenced by factors such as the increasing labor force, infrastructure development, building activities, consumer disposable income, and renovation activities. Additionally, the rise in material costs, online sales channels, and the DIY culture have contributed to the market's expansion. The market is further characterized by the emergence of multi-function tools, clear view toolboxes, cost-effectiveness, aftermarket repair services, and the increasing popularity of lightweight and cordless tools. The market is expected to continue growing due to automation, sustainability, digital platforms, and e-commerce sites.

Hand Tools Market Size

Get a glance at the  Hand Tools Industry report of share of various segments Request Free Sample

The General-purpose segment was valued at USD 5.25 billion in 2018 and showed a gradual increase during the forecast period.

Regional Analysis

  • North America is estimated to contribute 32% to the growth of the global market during the forecast period.

Technavio's analysts have elaborately explained the regional trends and drivers that shape the market during the forecast period.

Hand Tools Market Share by Geography

For more insights on the market share of various regions, Request Free Sample

The North American the market is projected to expand steadily over the forecast period, with the US being a significant contributor to its revenue growth. Factors driving this expansion include the thriving construction sector, commercial and industrial development, and the presence of a substantial customer base for global hand tool manufacturers In the US. However, the US's economic saturation may hinder market growth during the forecast period. Key product categories include screwdrivers, pliers, wrenches, hammers, saws, power tool accessories, and automotive hand tools, used extensively in DIY projects and the automotive industry. The market is characterized by a diverse range of offerings, from industrial-grade tools to lightweight, cordless, and multi-function tools.

Consumer disposable income, renovation activities, and the vacancy rate of houses also influence market dynamics. The market's growth is further influenced by trends such as automation, sustainability, digital platforms, and e-commerce sites. Despite these opportunities, cost effectiveness and aftermarket repair services remain crucial considerations for both small and large players.

Market Dynamics

Our  researchers analyzed the data with 2023 as the base year, along with the key drivers, trends, and challenges. A holistic analysis of drivers will help companies refine their marketing strategies to gain a competitive advantage.

What are the key market drivers leading to the rise In the adoption of Hand Tools Industry?

Huge demand for hand tools from developing economies is the key driver of the market.

  • The market has experienced notable growth in developing economies, including India, Brazil, South Africa, and Indonesia, due to the expansion of industries such as automobiles and construction. This growth is fueled by increasing economic activities and rising consumer disposable income. Hand tools are essential for various applications In these industries, including the assembly of automotive parts and building activities like renovation projects and the development of infrastructure. These tools are multifunctional, serving purposes such as tightening screws, bending pipes, and cutting materials. The labor force In these industries relies on hand tools for their efficiency and cost-effectiveness. The market for hand tools encompasses a wide range of products, including screwdrivers, pliers, wrenches, hammers, saws, and automotive hand tools.
  • As the DIY industry continues to gain popularity, there is a rising demand for lightweight, cordless, and multi-function tools. Additionally, the increasing focus on automation, sustainability, and digital platforms In the industrial sector is influencing the market. The market dynamics are further shaped by factors such as material costs, employment opportunities in technical jobs, and the availability of aftermarket repair and service providers. The market offers quality products at competitive prices, making them a valuable investment for both industrial and household use.

What are the market trends shaping the Hand Tools Industry?

Introduction of ergonomically designed hand tools is the upcoming market trend.

  • Hand tools continue to evolve with innovative designs and enhanced features, catering to the demands of various industries and consumers. companies prioritize the production of hand tools that boost the productivity of commercial and industrial facilities. Ergonomics is a significant focus, with electricians seeking lightweight, ergonomically designed tools with a comfortable grip for optimal muscle engagement. Customizations, extended tips, and multi-functionality are also essential aspects of modern hand tools. The labor force relies on hand tools for infrastructure building activities, renovation projects, and maintaining production units. Consumer disposable income, DIY culture, and the growing popularity of vacant houses have fueled the demand for hand tools In the household sector.
  • The DIY industry thrives on the availability of a wide range of hand tools, from screwdrivers and pliers to hammers and saws. Automotive hand tools are essential for the automotive sector, while cordless and lightweight tools cater to the needs of DIY enthusiasts. The market dynamics also include factors like pricing, efficiency, cost-effectiveness, aftermarket repair, and service providers. The hand tool market encompasses a diverse range of materials, including metal and wood, and caters to both industrial and household applications. The market is further influenced by sustainability, digital platforms, e-commerce sites, mobile apps, and the rising material costs. Employment opportunities in technical jobs continue to grow in this sector, with an emphasis on quality and efficiency.

What challenges does the Hand Tools Industry face during its growth?

Fluctuating raw material prices of hand tools is a key challenge affecting the industry growth.

  • Hand tools are essential instruments used in various building activities, renovation projects, and DIY initiatives. The market for hand tools is influenced by several factors, including the labor force, infrastructure development, and consumer disposable income. The demand for hand tools is driven by the increasing number of construction projects and the DIY industry's growth. Manufacturers use substrates such as iron, steel, aluminum, plastic, and carbon fibers to produce hand tools. However, the prices of these raw materials are subject to volatility due to fluctuations in crude oil prices and the availability of natural forest products. This volatility, coupled with increasing competition from local manufacturers, particularly in emerging economies, poses a significant challenge to hand tool companies.
  • Hand tools include a range of instruments, including screwdrivers, pliers, wrenches, hammers, saws, and automotive hand tools. Multi-function tools, lightweight tools, cordless tools, and automation are gaining popularity due to their efficiency and cost-effectiveness. The aftermarket repair and service providers play a crucial role in maintaining the reliability and durability of hand tools. The hand tool market is witnessing the emergence of digital platforms, e-commerce sites, and mobile apps as significant sales channels. The DIY culture is driving the demand for hand tools online, and the rising material costs are increasing the importance of cost-effective production units and technical jobs.
  • Sustainability and efficiency are becoming essential considerations for hand tool manufacturers, leading to innovations in tool design manipulations and extended tips.

Exclusive Customer Landscape

The hand tools market forecasting report includes the adoption lifecycle of the market, covering from the innovator's stage to the laggard's stage. It focuses on adoption rates in different regions based on penetration. Furthermore, the hand tools market report also includes key purchase criteria and drivers of price sensitivity to help companies evaluate and develop their market growth analysis strategies.

Hand Tools Market Share by Geography

 Customer Landscape

Key Companies & Market Insights

Companies are implementing various strategies, such as strategic alliances, hand tools market forecast, partnerships, mergers and acquisitions, geographical expansion, and product/service launches, to enhance their presence In the industry.

Akar Auto Industries Ltd. - The market encompasses a range of essential instruments, including spanners, wrenches, and ring spanners. These tools are indispensable for various applications across industries, enabling efficient and precise fastening and loosening of bolts and nuts. The hand tools sector continues to evolve, driven by advancements in materials, design, and manufacturing processes. Market growth is underpinned by increasing industrialization, infrastructure development, and DIY culture. Manufacturers focus on enhancing product durability, ergonomics, and functionality to cater to evolving customer needs and preferences.

The industry research and growth report includes detailed analyses of the competitive landscape of the market and information about key companies, including:

  • Akar Auto Industries Ltd.
  • Apex Tool Group LLC
  • Cementex Products Inc.
  • Channellock Inc.
  • Emerson Electric Co.
  • Estwing Manufacturing Co.
  • IDEAL Industries Inc
  • Ingersoll Rand Inc.
  • JCBL Group
  • Klein Tools Inc.
  • Malco Tools Inc.
  • Martin Sprocket and Gear Inc.
  • Snap On Inc.
  • STAHLWILLE Eduard Wille GmbH and Co. KG
  • Stanley Black and Decker Inc.
  • Swanson Tool Co. Inc.
  • Taparia Tools Ltd.
  • Techtronic Industries Co. Ltd.
  • The L.S. Starrett Co.
  • Toughbuilt Industries Inc.
  • TOYA S.A.
  • Vaughan Manufacturing
  • Wera

Qualitative and quantitative analysis of companies has been conducted to help clients understand the wider business environment as well as the strengths and weaknesses of key industry players. Data is qualitatively analyzed to categorize companies as pure play, category-focused, industry-focused, and diversified; it is quantitatively analyzed to categorize companies as dominant, leading, strong, tentative, and weak.

Research Analyst Overview

The market encompasses a wide range of instruments designed to manipulate various materials for building activities, maintenance, and DIY projects. These tools are essential for both industrial and household applications, with their robustness and reliable performance being crucial factors In their demand. Customizations and extended tips are becoming increasingly popular In the market, as users seek to optimize their tools for specific tasks. The labor force and infrastructure required for hand tool production are significant, with the number of employment opportunities in technical jobs related to tool design and manufacturing continuing to grow. The market is influenced by several factors, including consumer disposable income, renovation activities, and the availability of vacant houses for DIY projects.

The demand for hand tools is also driven by the need for efficient and cost-effective solutions for various industries. Quality and pricing are key considerations for consumers In the market. Multi-function tools, clear view toolboxes, and lightweight tools are popular choices due to their durability, efficiency, and cost-effectiveness. Aftermarket repair and service providers play a vital role in maintaining the longevity of hand tools, ensuring they continue to perform optimally. Power tools and hand tools share some similarities but serve distinct purposes. While power tools rely on electricity or batteries for operation, hand tools require no external power source.

Hand tools are typically used for precision work, while power tools are preferred for heavy-duty tasks. Materials such as metal and wood are common In the market, with the product price being a significant factor In their adoption. Industrial hand tools are typically more expensive due to their larger size and increased durability, while household hand tools are more affordable and compact. The market is undergoing significant changes due to automation, sustainability, and digital platforms. Automation is leading to the development of more efficient production processes, while sustainability is driving the adoption of eco-friendly materials and manufacturing practices.

Digital platforms, including e-commerce sites and mobile apps, are making it easier for consumers to purchase hand tools online, leading to rising material costs and increased competition among small sized players. In conclusion, the market is a dynamic and evolving industry, driven by factors such as consumer demand, technological advancements, and economic conditions. The market is expected to continue growing, with a focus on cost-effectiveness, efficiency, and sustainability.

Market Scope

Report Coverage

Details

Page number

167

Base year

2023

Historic period

2018-2022

Forecast period

2024-2028

Growth momentum & CAGR

Accelerate at a CAGR of 4.45%

Market growth 2024-2028

USD 2.66 billion

Market structure

Fragmented

YoY growth 2023-2024(%)

4.15

Key countries

US, China, Germany, UK, and France

Competitive landscape

Leading Companies, Market Positioning of Companies, Competitive Strategies, and Industry Risks

Request Free Sample

What are the Key Data Covered in this Hand Tools Market Research and Growth Report?

  • CAGR of the Hand Tools industry during the forecast period
  • Detailed information on factors that will drive the growth and forecasting between 2024 and 2028
  • Precise estimation of the size of the market and its contribution of the industry in focus to the parent market
  • Accurate predictions about upcoming growth and trends and changes in consumer behaviour
  • Growth of the market across North America, Europe, APAC, South America, and Middle East and Africa
  • Thorough analysis of the market's competitive landscape and detailed information about companies
  • Comprehensive analysis of factors that will challenge the hand tools market growth of industry companies

We can help! Our analysts can customize this hand tools market research report to meet your requirements.

Get in touch

1 Executive Summary

  • 1.1 Market overview
    • Exhibit 01: Executive Summary – Chart on Market Overview
    • Exhibit 02: Executive Summary – Data Table on Market Overview
    • Exhibit 03: Executive Summary – Chart on Global Market Characteristics
    • Exhibit 04: Executive Summary – Chart on Market by Geography
    • Exhibit 05: Executive Summary – Chart on Market Segmentation by Application
    • Exhibit 06: Executive Summary – Chart on Market Segmentation by End-user
    • Exhibit 07: Executive Summary – Chart on Incremental Growth
    • Exhibit 08: Executive Summary – Data Table on Incremental Growth
    • Exhibit 09: Executive Summary – Chart on Vendor Market Positioning

2 Market Landscape

  • 2.1 Market ecosystem
    • Exhibit 10: Parent market
    • Exhibit 11: Market Characteristics

3 Market Sizing

  • 3.1 Market definition
    • Exhibit 12: Offerings of vendors included in the market definition
  • 3.2 Market segment analysis
    • Exhibit 13: Market segments
  • 3.3 Market size 2023
    • 3.4 Market outlook: Forecast for 2023-2028
      • Exhibit 14: Chart on Global - Market size and forecast 2023-2028 ($ million)
      • Exhibit 15: Data Table on Global - Market size and forecast 2023-2028 ($ million)
      • Exhibit 16: Chart on Global Market: Year-over-year growth 2023-2028 (%)
      • Exhibit 17: Data Table on Global Market: Year-over-year growth 2023-2028 (%)

    4 Historic Market Size

    • 4.1 Global hand tools market 2018 - 2022
      • Exhibit 18: Historic Market Size – Data Table on global hand tools market 2018 - 2022 ($ million)
    • 4.2 Application Segment Analysis 2018 - 2022
      • Exhibit 19: Historic Market Size – Application Segment 2018 - 2022 ($ million)
    • 4.3 End-user Segment Analysis 2018 - 2022
      • Exhibit 20: Historic Market Size – End-user Segment 2018 - 2022 ($ million)
    • 4.4 Geography Segment Analysis 2018 - 2022
      • Exhibit 21: Historic Market Size – Geography Segment 2018 - 2022 ($ million)
    • 4.5 Country Segment Analysis 2018 - 2022
      • Exhibit 22: Historic Market Size – Country Segment 2018 - 2022 ($ million)

    5 Five Forces Analysis

    • 5.1 Five forces summary
      • Exhibit 23: Five forces analysis - Comparison between 2023 and 2028
    • 5.2 Bargaining power of buyers
      • Exhibit 24: Chart on Bargaining power of buyers – Impact of key factors 2023 and 2028
    • 5.3 Bargaining power of suppliers
      • Exhibit 25: Bargaining power of suppliers – Impact of key factors in 2023 and 2028
    • 5.4 Threat of new entrants
      • Exhibit 26: Threat of new entrants – Impact of key factors in 2023 and 2028
    • 5.5 Threat of substitutes
      • Exhibit 27: Threat of substitutes – Impact of key factors in 2023 and 2028
    • 5.6 Threat of rivalry
      • Exhibit 28: Threat of rivalry – Impact of key factors in 2023 and 2028
    • 5.7 Market condition
      • Exhibit 29: Chart on Market condition - Five forces 2023 and 2028

    6 Market Segmentation by Application

    • 6.1 Market segments
      • Exhibit 30: Chart on Application - Market share 2023-2028 (%)
      • Exhibit 31: Data Table on Application - Market share 2023-2028 (%)
    • 6.2 Comparison by Application
      • Exhibit 32: Chart on Comparison by Application
      • Exhibit 33: Data Table on Comparison by Application
    • 6.3 General-purpose - Market size and forecast 2023-2028
      • Exhibit 34: Chart on General-purpose - Market size and forecast 2023-2028 ($ million)
      • Exhibit 35: Data Table on General-purpose - Market size and forecast 2023-2028 ($ million)
      • Exhibit 36: Chart on General-purpose - Year-over-year growth 2023-2028 (%)
      • Exhibit 37: Data Table on General-purpose - Year-over-year growth 2023-2028 (%)
    • 6.4 Metal cutting - Market size and forecast 2023-2028
      • Exhibit 38: Chart on Metal cutting - Market size and forecast 2023-2028 ($ million)
      • Exhibit 39: Data Table on Metal cutting - Market size and forecast 2023-2028 ($ million)
      • Exhibit 40: Chart on Metal cutting - Year-over-year growth 2023-2028 (%)
      • Exhibit 41: Data Table on Metal cutting - Year-over-year growth 2023-2028 (%)
    • 6.5 Taps and dies and others - Market size and forecast 2023-2028
      • Exhibit 42: Chart on Taps and dies and others - Market size and forecast 2023-2028 ($ million)
      • Exhibit 43: Data Table on Taps and dies and others - Market size and forecast 2023-2028 ($ million)
      • Exhibit 44: Chart on Taps and dies and others - Year-over-year growth 2023-2028 (%)
      • Exhibit 45: Data Table on Taps and dies and others - Year-over-year growth 2023-2028 (%)
    • 6.6 Market opportunity by Application
      • Exhibit 46: Market opportunity by Application ($ million)
      • Exhibit 47: Data Table on Market opportunity by Application ($ million)

    7 Market Segmentation by End-user

    • 7.1 Market segments
      • Exhibit 48: Chart on End-user - Market share 2023-2028 (%)
      • Exhibit 49: Data Table on End-user - Market share 2023-2028 (%)
    • 7.2 Comparison by End-user
      • Exhibit 50: Chart on Comparison by End-user
      • Exhibit 51: Data Table on Comparison by End-user
    • 7.3 Industrial - Market size and forecast 2023-2028
      • Exhibit 52: Chart on Industrial - Market size and forecast 2023-2028 ($ million)
      • Exhibit 53: Data Table on Industrial - Market size and forecast 2023-2028 ($ million)
      • Exhibit 54: Chart on Industrial - Year-over-year growth 2023-2028 (%)
      • Exhibit 55: Data Table on Industrial - Year-over-year growth 2023-2028 (%)
    • 7.4 Household - Market size and forecast 2023-2028
      • Exhibit 56: Chart on Household - Market size and forecast 2023-2028 ($ million)
      • Exhibit 57: Data Table on Household - Market size and forecast 2023-2028 ($ million)
      • Exhibit 58: Chart on Household - Year-over-year growth 2023-2028 (%)
      • Exhibit 59: Data Table on Household - Year-over-year growth 2023-2028 (%)
    • 7.5 Market opportunity by End-user
      • Exhibit 60: Market opportunity by End-user ($ million)
      • Exhibit 61: Data Table on Market opportunity by End-user ($ million)

    8 Market Segmentation by Distribution Channel

    • 8.1 Market segments
      • Chart on Distribution Channel - Market share (2023-2028) (%)
      • Data Table on Distribution Channel - Market share (2023-2028) (%)
    • 8.2 Comparison by Distribution Channel
      • Chart on Comparison by Distribution Channel
      • Data Table on Comparison by Distribution Channel
    • 8.3 In Store - Market size and forecast (2023-2028)
      • Chart on In Store - Market size and forecast (2023-2028) ($ million)
      • Data Table on In Store - Market size and forecast (2023-2028) ($ million)
      • Chart on In Store - Year-over-year growth (2023-2028) (%)
      • Data Table on In Store - Year-over-year growth (2023-2028) (%)
    • 8.4 Online - Market size and forecast (2023-2028)
      • Chart on Online - Market size and forecast (2023-2028) ($ million)
      • Data Table on Online - Market size and forecast (2023-2028) ($ million)
      • Chart on Online - Year-over-year growth (2023-2028) (%)
      • Data Table on Online - Year-over-year growth (2023-2028) (%)
    • 8.5 Market opportunity by Distribution Channel
      • Market opportunity by $segment_name ($ million)
      • Data Table on Market opportunity by $segment_name ($ million)

    8 Customer Landscape

    • 8.1 Customer landscape overview
      • Exhibit 62: Analysis of price sensitivity, lifecycle, customer purchase basket, adoption rates, and purchase criteria

    9 Geographic Landscape

    • 9.1 Geographic segmentation
      • Exhibit 63: Chart on Market share by geography 2023-2028 (%)
      • Exhibit 64: Data Table on Market share by geography 2023-2028 (%)
    • 9.2 Geographic comparison
      • Exhibit 65: Chart on Geographic comparison
      • Exhibit 66: Data Table on Geographic comparison
    • 9.3 North America - Market size and forecast 2023-2028
      • Exhibit 67: Chart on North America - Market size and forecast 2023-2028 ($ million)
      • Exhibit 68: Data Table on North America - Market size and forecast 2023-2028 ($ million)
      • Exhibit 69: Chart on North America - Year-over-year growth 2023-2028 (%)
      • Exhibit 70: Data Table on North America - Year-over-year growth 2023-2028 (%)
    • 9.4 Europe - Market size and forecast 2023-2028
      • Exhibit 71: Chart on Europe - Market size and forecast 2023-2028 ($ million)
      • Exhibit 72: Data Table on Europe - Market size and forecast 2023-2028 ($ million)
      • Exhibit 73: Chart on Europe - Year-over-year growth 2023-2028 (%)
      • Exhibit 74: Data Table on Europe - Year-over-year growth 2023-2028 (%)
    • 9.5 APAC - Market size and forecast 2023-2028
      • Exhibit 75: Chart on APAC - Market size and forecast 2023-2028 ($ million)
      • Exhibit 76: Data Table on APAC - Market size and forecast 2023-2028 ($ million)
      • Exhibit 77: Chart on APAC - Year-over-year growth 2023-2028 (%)
      • Exhibit 78: Data Table on APAC - Year-over-year growth 2023-2028 (%)
    • 9.6 South America - Market size and forecast 2023-2028
      • Exhibit 79: Chart on South America - Market size and forecast 2023-2028 ($ million)
      • Exhibit 80: Data Table on South America - Market size and forecast 2023-2028 ($ million)
      • Exhibit 81: Chart on South America - Year-over-year growth 2023-2028 (%)
      • Exhibit 82: Data Table on South America - Year-over-year growth 2023-2028 (%)
    • 9.7 Middle East and Africa - Market size and forecast 2023-2028
      • Exhibit 83: Chart on Middle East and Africa - Market size and forecast 2023-2028 ($ million)
      • Exhibit 84: Data Table on Middle East and Africa - Market size and forecast 2023-2028 ($ million)
      • Exhibit 85: Chart on Middle East and Africa - Year-over-year growth 2023-2028 (%)
      • Exhibit 86: Data Table on Middle East and Africa - Year-over-year growth 2023-2028 (%)
    • 9.8 US - Market size and forecast 2023-2028
      • Exhibit 87: Chart on US - Market size and forecast 2023-2028 ($ million)
      • Exhibit 88: Data Table on US - Market size and forecast 2023-2028 ($ million)
      • Exhibit 89: Chart on US - Year-over-year growth 2023-2028 (%)
      • Exhibit 90: Data Table on US - Year-over-year growth 2023-2028 (%)
    • 9.9 Germany - Market size and forecast 2023-2028
      • Exhibit 91: Chart on Germany - Market size and forecast 2023-2028 ($ million)
      • Exhibit 92: Data Table on Germany - Market size and forecast 2023-2028 ($ million)
      • Exhibit 93: Chart on Germany - Year-over-year growth 2023-2028 (%)
      • Exhibit 94: Data Table on Germany - Year-over-year growth 2023-2028 (%)
    • 9.10 UK - Market size and forecast 2023-2028
      • Exhibit 95: Chart on UK - Market size and forecast 2023-2028 ($ million)
      • Exhibit 96: Data Table on UK - Market size and forecast 2023-2028 ($ million)
      • Exhibit 97: Chart on UK - Year-over-year growth 2023-2028 (%)
      • Exhibit 98: Data Table on UK - Year-over-year growth 2023-2028 (%)
    • 9.11 China - Market size and forecast 2023-2028
      • Exhibit 99: Chart on China - Market size and forecast 2023-2028 ($ million)
      • Exhibit 100: Data Table on China - Market size and forecast 2023-2028 ($ million)
      • Exhibit 101: Chart on China - Year-over-year growth 2023-2028 (%)
      • Exhibit 102: Data Table on China - Year-over-year growth 2023-2028 (%)
    • 9.12 France - Market size and forecast 2023-2028
      • Exhibit 103: Chart on France - Market size and forecast 2023-2028 ($ million)
      • Exhibit 104: Data Table on France - Market size and forecast 2023-2028 ($ million)
      • Exhibit 105: Chart on France - Year-over-year growth 2023-2028 (%)
      • Exhibit 106: Data Table on France - Year-over-year growth 2023-2028 (%)
    • 9.13 Market opportunity by geography
      • Exhibit 107: Market opportunity by geography ($ million)
      • Exhibit 108: Data Tables on Market opportunity by geography ($ million)

    10 Drivers, Challenges, and Trends

    • 10.1 Market drivers
      • 10.2 Market challenges
        • 10.3 Impact of drivers and challenges
          • Exhibit 109: Impact of drivers and challenges in 2023 and 2028
        • 10.4 Market trends

          11 Vendor Landscape

          • 11.1 Overview
            • 11.2 Vendor landscape
              • Exhibit 110: Overview on Criticality of inputs and Factors of differentiation
            • 11.3 Landscape disruption
              • Exhibit 111: Overview on factors of disruption
            • 11.4 Industry risks
              • Exhibit 112: Impact of key risks on business

            12 Vendor Analysis

            • 12.1 Vendors covered
              • Exhibit 113: Vendors covered
            • 12.2 Market positioning of vendors
              • Exhibit 114: Matrix on vendor position and classification
            • 12.3 Akar Auto Industries Ltd.
              • Exhibit 115: Akar Auto Industries Ltd. - Overview
              • Exhibit 116: Akar Auto Industries Ltd. - Product / Service
              • Exhibit 117: Akar Auto Industries Ltd. - Key offerings
            • 12.4 Apex Tool Group LLC
              • Exhibit 118: Apex Tool Group LLC - Overview
              • Exhibit 119: Apex Tool Group LLC - Product / Service
              • Exhibit 120: Apex Tool Group LLC - Key offerings
            • 12.5 Channellock Inc.
              • Exhibit 121: Channellock Inc. - Overview
              • Exhibit 122: Channellock Inc. - Product / Service
              • Exhibit 123: Channellock Inc. - Key offerings
            • 12.6 Emerson Electric Co.
              • Exhibit 124: Emerson Electric Co. - Overview
              • Exhibit 125: Emerson Electric Co. - Business segments
              • Exhibit 126: Emerson Electric Co. - Key news
              • Exhibit 127: Emerson Electric Co. - Key offerings
              • Exhibit 128: Emerson Electric Co. - Segment focus
            • 12.7 IDEAL Industries Inc
              • Exhibit 129: IDEAL Industries Inc - Overview
              • Exhibit 130: IDEAL Industries Inc - Product / Service
              • Exhibit 131: IDEAL Industries Inc - Key offerings
            • 12.8 Ingersoll Rand Inc.
              • Exhibit 132: Ingersoll Rand Inc. - Overview
              • Exhibit 133: Ingersoll Rand Inc. - Business segments
              • Exhibit 134: Ingersoll Rand Inc. - Key offerings
              • Exhibit 135: Ingersoll Rand Inc. - Segment focus
            • 12.9 JCBL Group
              • Exhibit 136: JCBL Group - Overview
              • Exhibit 137: JCBL Group - Product / Service
              • Exhibit 138: JCBL Group - Key offerings
            • 12.10 Klein Tools Inc.
              • Exhibit 139: Klein Tools Inc. - Overview
              • Exhibit 140: Klein Tools Inc. - Product / Service
              • Exhibit 141: Klein Tools Inc. - Key offerings
            • 12.11 Martin Sprocket and Gear Inc.
              • Exhibit 142: Martin Sprocket and Gear Inc. - Overview
              • Exhibit 143: Martin Sprocket and Gear Inc. - Product / Service
              • Exhibit 144: Martin Sprocket and Gear Inc. - Key offerings
            • 12.12 Snap On Inc.
              • Exhibit 145: Snap On Inc. - Overview
              • Exhibit 146: Snap On Inc. - Business segments
              • Exhibit 147: Snap On Inc. - Key offerings
              • Exhibit 148: Snap On Inc. - Segment focus
            • 12.13 Stanley Black and Decker Inc.
              • Exhibit 149: Stanley Black and Decker Inc. - Overview
              • Exhibit 150: Stanley Black and Decker Inc. - Business segments
              • Exhibit 151: Stanley Black and Decker Inc. - Key news
              • Exhibit 152: Stanley Black and Decker Inc. - Key offerings
              • Exhibit 153: Stanley Black and Decker Inc. - Segment focus
            • 12.14 Taparia Tools Ltd.
              • Exhibit 154: Taparia Tools Ltd. - Overview
              • Exhibit 155: Taparia Tools Ltd. - Product / Service
              • Exhibit 156: Taparia Tools Ltd. - Key offerings
            • 12.15 Techtronic Industries Co. Ltd.
              • Exhibit 157: Techtronic Industries Co. Ltd. - Overview
              • Exhibit 158: Techtronic Industries Co. Ltd. - Business segments
              • Exhibit 159: Techtronic Industries Co. Ltd. - Key offerings
              • Exhibit 160: Techtronic Industries Co. Ltd. - Segment focus
            • 12.16 TOYA S.A.
              • Exhibit 161: TOYA S.A. - Overview
              • Exhibit 162: TOYA S.A. - Product / Service
              • Exhibit 163: TOYA S.A. - Key offerings
            • 12.17 Wera
              • Exhibit 164: Wera - Overview
              • Exhibit 165: Wera - Product / Service
              • Exhibit 166: Wera - Key offerings

            13 Appendix

            • 13.1 Scope of the report
              • 13.2 Inclusions and exclusions checklist
                • Exhibit 167: Inclusions checklist
                • Exhibit 168: Exclusions checklist
              • 13.3 Currency conversion rates for US$
                • Exhibit 169: Currency conversion rates for US$
              • 13.4 Research methodology
                • Exhibit 170: Research methodology
                • Exhibit 171: Validation techniques employed for market sizing
                • Exhibit 172: Information sources
              • 13.5 List of abbreviations
                • Exhibit 173: List of abbreviations

              Research Methodology

              Technavio presents a detailed picture of the market by way of study, synthesis, and summation of data from multiple sources. The analysts have presented the various facets of the market with a particular focus on identifying the key industry influencers. The data thus presented is comprehensive, reliable, and the result of extensive research, both primary and secondary.

              INFORMATION SOURCES

              Primary sources

              • Manufacturers and suppliers
              • Channel partners
              • Industry experts
              • Strategic decision makers

              Secondary sources

              • Industry journals and periodicals
              • Government data
              • Financial reports of key industry players
              • Historical data
              • Press releases

              DATA ANALYSIS

              Data Synthesis

              • Collation of data
              • Estimation of key figures
              • Analysis of derived insights

              Data Validation

              • Triangulation with data models
              • Reference against proprietary databases
              • Corroboration with industry experts

              REPORT WRITING

              Qualitative

              • Market drivers
              • Market challenges
              • Market trends
              • Five forces analysis

              Quantitative

              • Market size and forecast
              • Market segmentation
              • Geographical insights
              • Competitive landscape

              Interested in this report?

              Get your sample now to see our research methodology and insights!

              Download Now

              Frequently Asked Questions

              Hand Tools market growth will increase by $ 2.66 bn during 2024-2028 .

              The Hand Tools market is expected to grow at a CAGR of 4.45% during 2024-2028 .

              Hand Tools market is segmented by Application( General-purpose, Metal cutting, Taps and dies and others) End-user( Industrial, Household, Taps and dies and others)

              Akar Auto Industries Ltd., Apex Tool Group LLC, Cementex Products Inc., Channellock Inc., Emerson Electric Co., Estwing Manufacturing Co., IDEAL Industries Inc, Ingersoll Rand Inc., JCBL Group, Klein Tools Inc., Malco Tools Inc., Martin Sprocket and Gear Inc., Snap On Inc., STAHLWILLE Eduard Wille GmbH and Co. KG, Stanley Black and Decker Inc., Swanson Tool Co. Inc., Taparia Tools Ltd., Techtronic Industries Co. Ltd., The L.S. Starrett Co., Toughbuilt Industries Inc., TOYA S.A., Vaughan Manufacturing, Wera are a few of the key vendors in the Hand Tools market.

              North America will register the highest growth rate of 32% among the other regions. Therefore, the Hand Tools market in North America is expected to garner significant business opportunities for the vendors during the forecast period.

              US, China, Germany, UK, France

              • Huge demand for hand tools from developing economiesThe hand tools market in developing economies is the driving factor this market.
              • such as India is the driving factor this market.
              • Brazil is the driving factor this market.
              • South Africa is the driving factor this market.
              • and Indonesia is the driving factor this market.
              • witnessed significant growth in the past decade. The growth of industries such as automobiles and construction (especially residential construction) is being driven by the rising disposable incomes of people and the increasing economic activities in developing markets is the driving factor this market.
              • such as India. This is driving the growth of heavy industries (such as automobiles and housing) in the country. Hand tools play a crucial role in the manufacturing of automobiles and infrastructure development is the driving factor this market.
              • especially construction. Hand tools are used for multiple purposes is the driving factor this market.
              • such as the fixing of small parts and equipment. These tools are also used for fixing instruments and parts at farfetched places where power tools cannot get the source of electricity. Furthermore is the driving factor this market.
              • rapid industrialization in economies such as Brazil is the driving factor this market.
              • Russia is the driving factor this market.
              • India is the driving factor this market.
              • China is the driving factor this market.
              • and South Africa (BRICS) is creating considerable demand for hand tools. Growing investments in the manufacturing sector in developing countries are further increasing the consumption of hand tools. Several other regions is the driving factor this market.
              • such as South America and MEA is the driving factor this market.
              • are also exhibiting an increase in manufacturing activities is the driving factor this market.
              • particularly in the consumer durables sector. As these regions are undergoing rapid urbanization is the driving factor this market.
              • manufacturers and customers seek new and technologically advanced products. Hence is the driving factor this market.
              • the huge demand for hand tools from developing economies is expected to drive the growth of the global hand tools market during the forecast period. is the driving factor this market.

              The Hand Tools market vendors should focus on grabbing business opportunities from the General-purpose segment as it accounted for the largest market share in the base year.