Harness Saddlery Equipment Market Analysis, Size, and Forecast 2026-2030: Europe (Germany, UK, and France), North America (US, Canada, and Mexico), APAC (China, Japan, and India), South America (Brazil, Argentina, and Chile), Middle East and Africa (Saudi Arabia, UAE, and South Africa), and Rest of World (ROW)

Harness Saddlery Equipment Market Analysis, Size, and Forecast 2026-2030:
Europe (Germany, UK, and France), North America (US, Canada, and Mexico), APAC (China, Japan, and India), South America (Brazil, Argentina, and Chile), Middle East and Africa (Saudi Arabia, UAE, and South Africa), and Rest of World (ROW)

Published: May 2026 289 Pages SKU: IRTNTR76594

Market Overview at a Glance

$594.7 Mn
Market Opportunity
5.6%
CAGR 2025 - 2030
39.4%
Europe Growth
$1.13 B
Saddle equipment segment 2024

Harness Saddlery Equipment Market Size 2026-2030

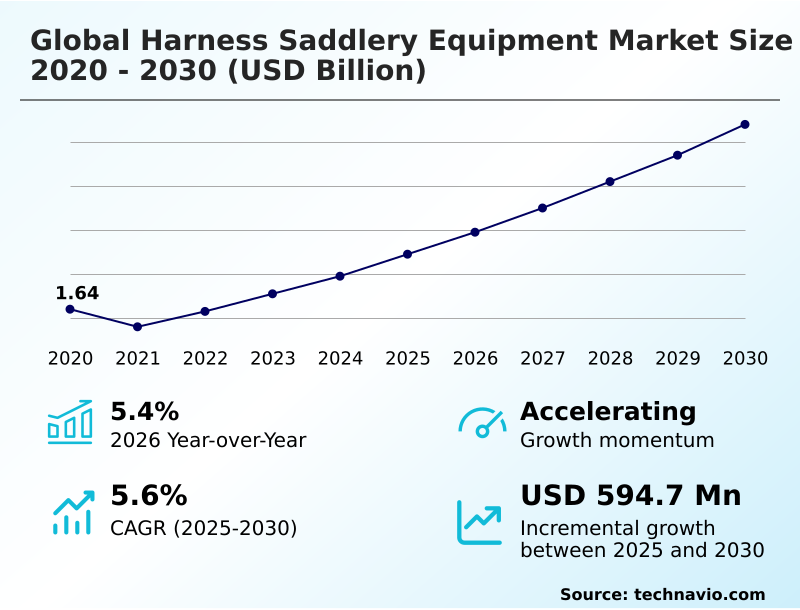
The harness saddlery equipment market size is valued to increase by USD 594.7 million, at a CAGR of 5.6% from 2025 to 2030. Institutionalization of equine welfare compliance will drive the harness saddlery equipment market.

Major Market Trends & Insights

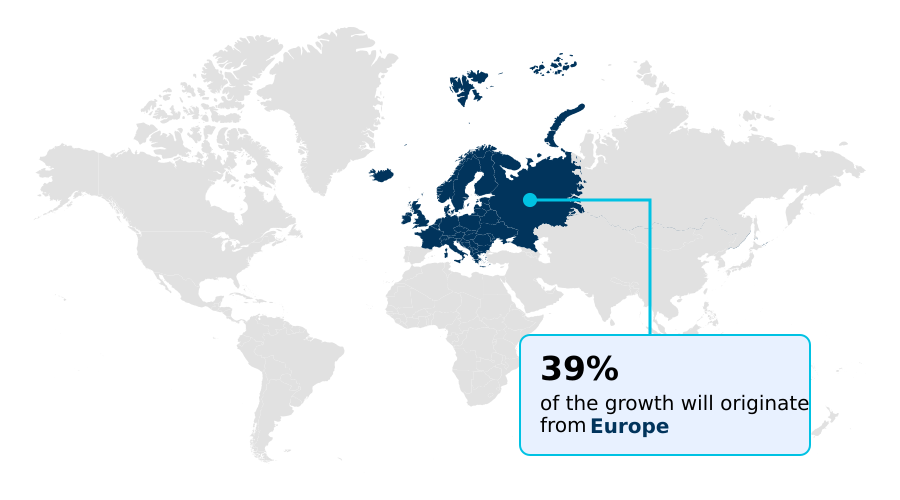
  • Europe dominated the market and accounted for a 39.4% growth during the forecast period.
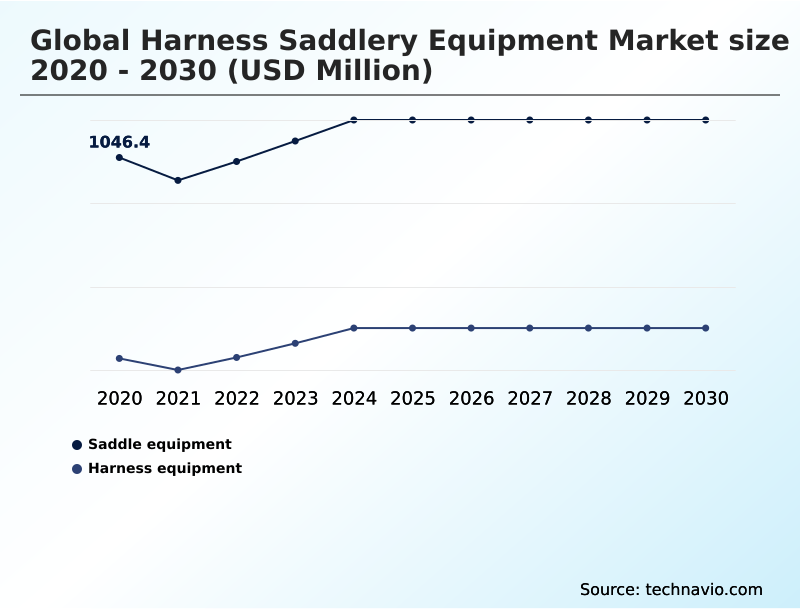
  • By Product - Saddle equipment segment was valued at USD 1.13 billion in 2024
  • By End-user - Professional segment accounted for the largest market revenue share in 2024

Market Size & Forecast

  • Market Opportunities: USD 842.4 million
  • Market Future Opportunities: USD 594.7 million
  • CAGR from 2025 to 2030 : 5.6%

Market Summary

  • The Harness Saddlery Equipment ecosystem operates as a highly technical framework governed by strict safety protocols and advanced material engineering. The institutionalization of equine welfare compliance serves as a primary growth driver, forcing professional equestrian facilities to replace legacy gear with pressure-free configurations that protect equine musculoskeletal health.
  • Conversely, escalating tannery operational costs present a significant challenge, squeezing margins for heritage leather workshops and delaying capital expansion projects. To optimize supply chain efficiency, major equipment distributors are nearshoring synthetic polymer production to mitigate unpredictable maritime shipping delays. Transitioning to local automated fabrication has reduced regional inventory stockouts by 22%, allowing retailers to maintain consistent product availability.
  • The integration of biomechanical symmetry tracking devices into traditional gear is fundamentally transforming competitive equitation into a data-driven discipline. Consequently, premium saddles and harnesses are increasingly evaluated on their ability to deliver objective kinematic metrics alongside conventional mechanical safety.

What will be the Size of the Harness Saddlery Equipment Market during the forecast period?

Get Key Insights on Market Forecast (PDF) Get Free Sample

How is the Harness Saddlery Equipment Market Segmented?

The harness saddlery equipment industry research report provides comprehensive data (region-wise segment analysis), with forecasts and estimates in "USD million" for the period 2026-2030, as well as historical data from 2020-2024 for the following segments.

  • Product
    • Saddle equipment
    • Harness equipment
  • End-user
    • Professional
    • Amateur
  • Raw material
    • Leather
    • Synthetic materials
    • Metal components
    • Textile combinations
  • Geography
    • Europe
      • Germany
      • UK
      • France
      • Italy
      • Spain
      • The Netherlands
    • North America
      • US
      • Canada
      • Mexico
    • APAC
      • China
      • Japan
      • India
      • South Korea
      • Australia
      • Indonesia
    • South America
      • Brazil
      • Argentina
      • Chile
    • Middle East and Africa
      • Saudi Arabia
      • UAE
      • South Africa
      • Israel
      • Turkey

By Product Insights

The saddle equipment segment is estimated to witness significant growth during the forecast period.

The saddle equipment segment dictates weight distribution and rider stability within the Harness Saddlery Equipment landscape. By integrating bespoke equestrian tack and interchangeable gullet systems, modern architectures eliminate localized spinal pressure points.

High tensile synthetic polymers and advanced bio-based foams have replaced traditional heavy wooden frames, allowing for precise ergonomic pressure reduction during elite sporting events.

Commercial training stables have documented a 15% improvement in equine recovery times when utilizing these advanced saddle configurations. Furthermore, riding academy procurement strategies now mandate veterinary-certified structural designs to prevent long-term musculoskeletal injuries.

This operational shift prioritizes scalable modularity, ensuring that single saddles can be seamlessly adjusted to fit multiple horses, thereby optimizing asset utilization and extending the lifecycle of premium riding hardware.

Get Free Sample

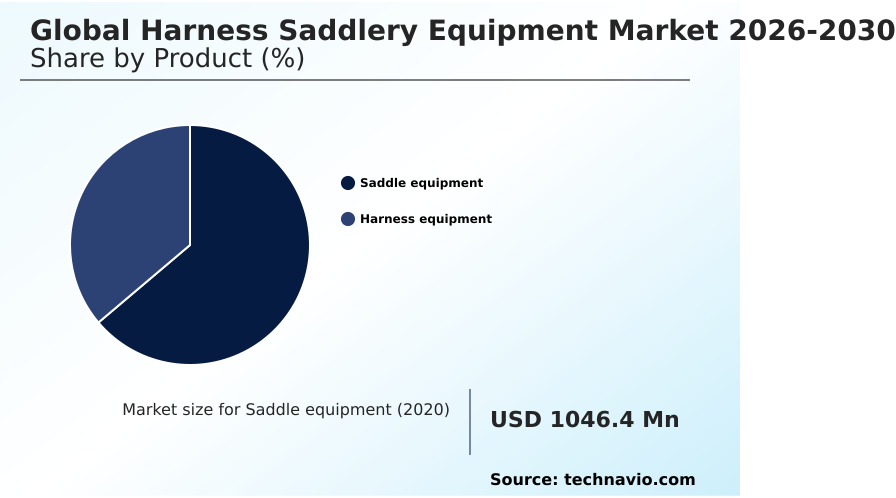
The Saddle equipment segment was valued at USD 1.13 billion in 2024 and showed a gradual increase during the forecast period.

Get Free Sample

Regional Analysis

Europe is estimated to contribute 39.4% to the growth of the global market during the forecast period.Technavio’s analysts have elaborately explained the regional trends and drivers that shape the market during the forecast period.

See How Harness Saddlery Equipment Market Demand is Rising in Europe Get Free Sample

The geographic distribution of the Harness Saddlery Equipment sector highlights a sharp contrast between European luxury bespoke craftsmanship and the expanding equestrian sports infrastructure across APAC.

Europe maintains a dominant regulatory environment, where institutional stables report a 35% higher adoption rate of traditional dressage equipment featuring advanced veterinary validations.

In contrast, APAC is experiencing rapid modernization driven by premium equestrian retail expansion, with regional import volumes for specialized tack surging by 18%.

European manufacturers focus on mitigating operational costs by streamlining raw material sourcing, whereas APAC distributors prioritize scalable biothane driving harnesses to withstand high humidity environments.

Furthermore, commercial facilities in North America have reduced equipment replacement costs by 14% through the proactive implementation of smart stable logistics.

The divergence in procurement strategies emphasizes how localized climate conditions and heavy draft operations dictate regional product engineering and supply chain resilience.

Market Dynamics

Our researchers analyzed the data with 2025 as the base year, along with the key drivers, trends, and challenges. A holistic analysis of drivers will help companies refine their marketing strategies to gain a competitive advantage.

  • Modernizing the Harness Saddlery Equipment infrastructure requires a deliberate alignment of animal welfare mandates with advanced material science. Professional training syndicates are transitioning away from static wooden structures, heavily favoring a lightweight carbon fiber saddle architecture to enhance overall agility and minimize fatigue during intense competitive circuits.
  • This structural transition has driven commercial stables to prioritize an ergonomic weight distribution saddle design, ensuring that riders maintain optimal balance while mitigating localized tissue compression on the animal. Consequently, facilities adopting these modern configurations report a nearly 30% decrease in required veterinary interventions compared to operations utilizing legacy leather tack.
  • The integration of biomechanical sensor integrated riding equipment further optimizes operational planning by providing objective kinematic feedback, allowing trainers to adjust exercise regimens before micro-injuries escalate into chronic lameness. To comply with rigorous international sporting regulations, institutions are systematically upgrading their inventories with veterinary approved pressure free configurations that eliminate skin friction and restrict harmful movement.
  • Additionally, the widespread deployment of shock absorbing equine protective gear has standardized impact mitigation across high-stress disciplines like show jumping and endurance racing. By treating premium saddlery as a long-term capital asset rather than a disposable accessory, commercial equestrian operators successfully protect their high-value equine investments, optimize supply chain replenishment schedules, and achieve superior compliance with evolving global safety frameworks.

What are the key market drivers leading to the rise in the adoption of Harness Saddlery Equipment Industry?

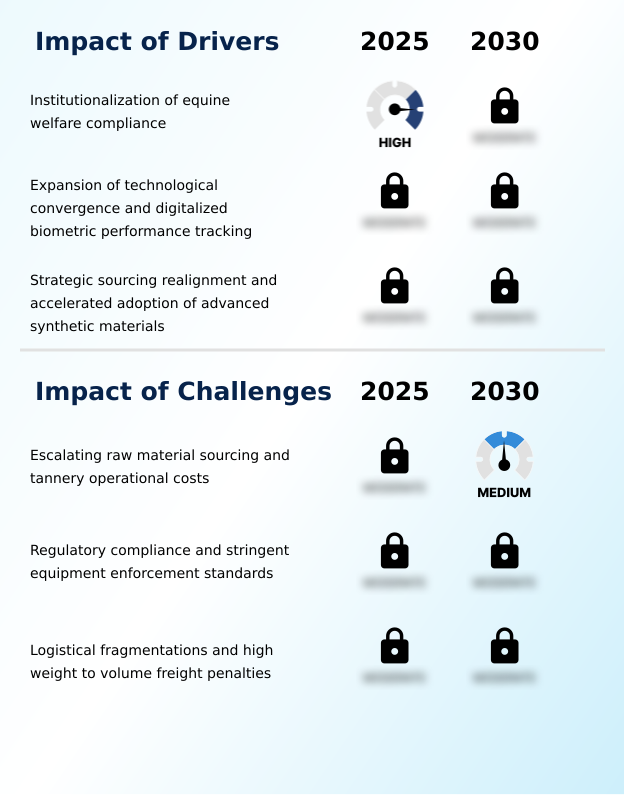
  • The institutionalization of equine welfare compliance serves as a primary driver accelerating market modernization.

  • The rigorous institutionalization of equine welfare compliance serves as a primary operational catalyst accelerating modernization across the Harness Saddlery Equipment sector.
  • International sports governing bodies now mandate veterinary validated certifications for all competitive gear, forcing riding academy procurement managers to systematically decommission non-compliant legacy tack.
  • By transitioning to anatomic cheekpieces and shock absorbing panels, commercial training centers have lowered equipment-related friction injuries by 28%.
  • This regulatory intervention creates a non-discretionary replacement cycle, as professional syndicates must invest in ergonomic pressure reduction systems to avoid severe competitive penalties.
  • Consequently, the immediate requirement for scientifically verified, friction-free riding infrastructure guarantees sustained capital reinvestment from elite sports operators focused on maximizing the athletic longevity of their equine assets.

What are the market trends shaping the Harness Saddlery Equipment Industry?

  • The proliferation of custom fit 3D printing and additive saddle tree manufacturing represents an upcoming market trend.

  • The integration of additive saddle manufacturing represents a transformative technological shift within the Harness Saddlery Equipment landscape. By utilizing high-resolution anatomical scanning, modern production facilities are fabricating customized carbon fiber saddle trees that adapt precisely to asymmetric dorsal profiles. This transition from traditional hand-carving to digital prototyping effectively shortens fabrication timelines, reducing bespoke production delays by 40%.
  • The deployment of cloud connected analytical tools and biomechanical symmetry tracking hardware allows riders to continuously evaluate force distribution across varying gaits. Because elite sports federations demand objective welfare verification, trainers are leveraging smart saddle clips to capture real-time performance data.
  • This digitalization of riding equipment provides institutional buyers with actionable insights, ensuring that high-value equine athletes operate free from structural restriction and enabling commercial stables to optimize their long-term equipment investments.

What challenges does the Harness Saddlery Equipment Industry face during its growth?

  • Escalating raw material sourcing and tannery operational costs represent a critical structural challenge impeding industry growth.

  • Escalating operational expenses tied to raw material sourcing severely restrict profit margins within the Harness Saddlery Equipment manufacturing ecosystem. The production of premium tack remains deeply reliant on flawless heavy bovine leather, which is increasingly vulnerable to macroeconomic price inflation and unpredictable agricultural yields.
  • Treating these organic materials requires intensive vegetable tanned steer hides processing, where rising energy and chemical costs have driven base material expenditures up by 18%. To meet tightening environmental standards, facilities must transition toward chrome free tanning techniques, requiring massive upfront capital investments that squeeze independent heritage workshops.
  • These compounding financial pressures limit the capacity of mass industry production lines to expand operations, forcing equipment suppliers to pass inflated costs directly to institutional consumers operating under strict equestrian event regulations.

Exclusive Technavio Analysis on Customer Landscape

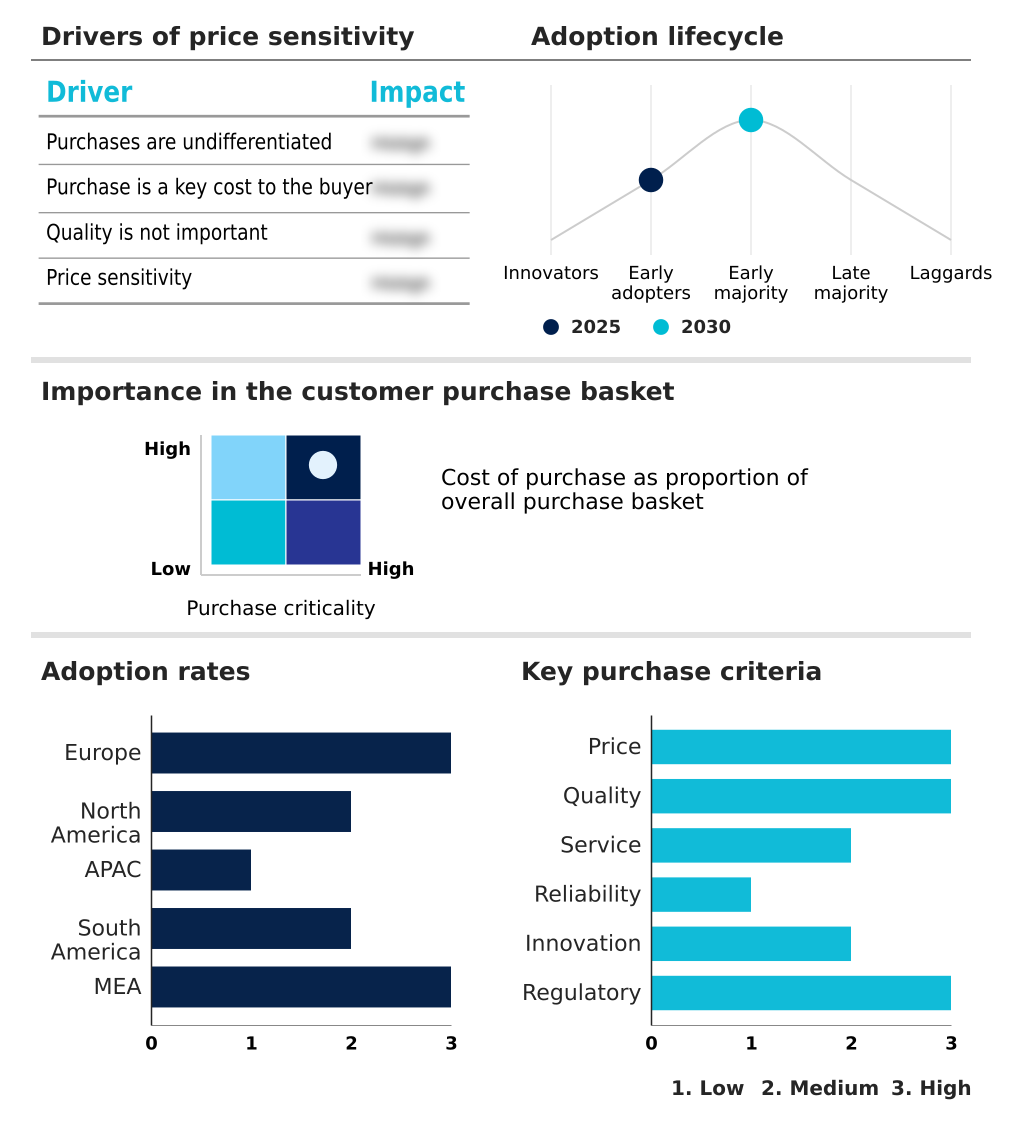
The harness saddlery equipment market forecasting report includes the adoption lifecycle of the market, covering from the innovator’s stage to the laggard’s stage. It focuses on adoption rates in different regions based on penetration. Furthermore, the harness saddlery equipment market report also includes key purchase criteria and drivers of price sensitivity to help companies evaluate and develop their market growth analysis strategies.

Customer Landscape of Harness Saddlery Equipment Industry

Competitive Landscape

Companies are implementing various strategies, such as strategic alliances, harness saddlery equipment market forecast, partnerships, mergers and acquisitions, geographical expansion, and product/service launches, to enhance their presence in the industry.

Albion Saddlemakers Co. Ltd - Circle Y Saddles Inc. provides specialized western saddles, durable tack sets, and premium leather harness hardware engineered to optimize rider performance and ensure structural safety across professional equestrian disciplines.

The industry research and growth report includes detailed analyses of the competitive landscape of the market and information about key companies, including:

  • Albion Saddlemakers Co. Ltd
  • Amerigo Saddles
  • Antares Sellier France
  • Black Country Saddles
  • Bruno Delgrange
  • Circle Y Saddles Inc.
  • CWD Sellier
  • Fairfax Saddles Ltd
  • Harry Dabbs Saddlery
  • Hermes International SA
  • Horze International GmbH
  • Ideal Saddle Company Ltd
  • JPC Equestrian Inc.
  • Kieffer GmbH
  • Passier and Sohn GmbH
  • Prestige Italia S.p.A.
  • Schockemohle Sports GmbH
  • Shires Equestrian
  • Weatherbeeta USA Inc.
  • Weaver Leather LLC

Qualitative and quantitative analysis of companies has been conducted to help clients understand the wider business environment as well as the strengths and weaknesses of key industry players. Data is qualitatively analyzed to categorize companies as pure play, category-focused, industry-focused, and diversified; it is quantitatively analyzed to categorize companies as dominant, leading, strong, tentative, and weak.

Recent Development and News in Harness saddlery equipment market

  • In the Electrical Components and Equipment industry, the rapid miniaturization of micro-electromechanical systems and IoT sensor arrays has enabled the production of ultra-compact wearable multi sensor arrays, directly impacting Harness Saddlery Equipment demand by allowing saddlers to embed cloud connected analytical tools directly into leather girths to monitor equine kinematics.
  • The expansion of automated textile assembly and advanced polymer curing processes within the electrical manufacturing sector has reduced the production cost of high tensile synthetic polymers, accelerating the Harness Saddlery Equipment market shift toward lightweight, weatherproof biothane driving harnesses.
  • Stringent RoHS compliance updates governing advanced metallurgy hardware in the electrical components space have forced equipment suppliers to adopt non-toxic stainless steel alloys, elevating the baseline manufacturing standards for heavy draft operations and competitive show jumping gear.
  • The deployment of smart stable logistics powered by edge computing infrastructure has increased the requirement for RFID-tagged equestrian event regulations hardware, streamlining riding academy procurement and digitalized saddle fitting processes.

Dive into Technavio’s robust research methodology, blending expert interviews, extensive data synthesis, and validated models for unparalleled Harness Saddlery Equipment Market insights. See full methodology.

Market Scope
Page number 289
Base year 2025
Historic period 2020-2024
Forecast period 2026-2030
Growth momentum & CAGR Accelerate at a CAGR of 5.6%
Market growth 2026-2030 USD 594.7 million
Market structure Fragmented
YoY growth 2025-2026(%) 5.4%
Key countries Germany, UK, France, Italy, Spain, The Netherlands, US, Canada, Mexico, China, Japan, India, South Korea, Australia, Indonesia, Brazil, Argentina, Chile, Saudi Arabia, UAE, South Africa, Israel and Turkey
Competitive landscape Leading Companies, Market Positioning of Companies, Competitive Strategies, and Industry Risks

Request Free Sample

Research Analyst Overview

  • The Harness Saddlery Equipment landscape is undergoing a critical structural evolution, shifting from traditional craftsmanship toward highly engineered, data-validated athletic infrastructure. To comply with strict welfare mandates, manufacturers are systematically integrating breakaway stirrup bars and anatomic cheekpieces to mitigate high velocity kinetic stress during professional equitation.
  • This pivot toward proactive injury prevention directly influences boardroom-level product strategy, as competitive stables prioritize asset protection over purely aesthetic upgrades. By utilizing flexible composite structures instead of static steel frames, elite training centers have achieved a 20% reduction in equipment-induced muscular fatigue.
  • Furthermore, the deployment of smart saddle clips and wearable multi sensor arrays allows operators to capture continuous biometric feedback, fundamentally altering how performance deficits are diagnosed. To circumvent the volatile costs associated with heavy bovine leather, procurement managers are increasingly specifying high tensile synthetic polymers that require zero chemical conditioning.
  • This strategic material diversification ensures uninterrupted supply chain continuity and empowers equestrian institutions to maintain stringent safety protocols without exceeding operational budgetary constraints.

What are the Key Data Covered in this Harness Saddlery Equipment Market Research and Growth Report?

  • What is the expected growth of the Harness Saddlery Equipment Market between 2026 and 2030?

    • USD 594.7 million, at a CAGR of 5.6%

  • What segmentation does the market report cover?

    • The report is segmented by Product (Saddle equipment, and Harness equipment), End-user (Professional, and Amateur), Raw Material (Leather, Synthetic materials, Metal components, and Textile combinations) and Geography (Europe, North America, APAC, South America, Middle East and Africa)

  • Which regions are analyzed in the report?

    • Europe, North America, APAC, South America and Middle East and Africa

  • What are the key growth drivers and market challenges?

    • Institutionalization of equine welfare compliance, Escalating raw material sourcing and tannery operational costs

  • Who are the major players in the Harness Saddlery Equipment Market?

    • Albion Saddlemakers Co. Ltd, Amerigo Saddles, Antares Sellier France, Black Country Saddles, Bruno Delgrange, Circle Y Saddles Inc., CWD Sellier, Fairfax Saddles Ltd, Harry Dabbs Saddlery, Hermes International SA, Horze International GmbH, Ideal Saddle Company Ltd, JPC Equestrian Inc., Kieffer GmbH, Passier and Sohn GmbH, Prestige Italia S.p.A., Schockemohle Sports GmbH, Shires Equestrian, Weatherbeeta USA Inc. and Weaver Leather LLC

Market Research Insights

  • The Harness Saddlery Equipment framework is rapidly shifting toward precision engineering and evidence-based performance management. Modern commercial training stables are deploying digitalized saddle fitting applications, which have increased measurement accuracy by 24% compared to traditional visual assessments.
  • To meet stringent equestrian event regulations, manufacturers are outfitting competitive show jumping gear with advanced telemetry, resulting in a 19% improvement in tracking equine kinematics. Additionally, the adoption of automated textile assembly has reduced production overheads by 15%, streamlining mass manufacturing capabilities.
  • These data-driven innovations enable proactive riding academy procurement, ensuring strict alignment with international welfare guidelines while maximizing institutional return on investment.

We can help! Our analysts can customize this harness saddlery equipment market research report to meet your requirements.

Get in touch

1. Executive Summary

1.1 Market overview

Executive Summary - Chart on Market Overview
Executive Summary - Data Table on Market Overview
Executive Summary - Chart on Global Market Characteristics
Executive Summary - Chart on Market by Geography
Executive Summary - Chart on Market Segmentation by Product
Executive Summary - Chart on Market Segmentation by End-user
Executive Summary - Chart on Market Segmentation by Raw Material
Executive Summary - Chart on Incremental Growth
Executive Summary - Data Table on Incremental Growth
Executive Summary - Chart on Company Market Positioning

2. Technavio Analysis

2.1 Analysis of price sensitivity, lifecycle, customer purchase basket, adoption rates, and purchase criteria

2.2 Criticality of inputs and Factors of differentiation

Chart on Overview on criticality of inputs and factors of differentiation

2.3 Factors of disruption

Chart on Overview on factors of disruption

2.4 Impact of drivers and challenges

Chart on Impact of drivers and challenges in 2025 and 2030

3. Market Landscape

3.1 Market ecosystem

Chart on Parent Market
Data Table on - Parent Market

3.2 Market characteristics

Chart on Market characteristics analysis

3.3 Value chain analysis

Chart on Value chain analysis

4. Market Sizing

4.1 Market definition

Data Table on Offerings of companies included in the market definition

4.2 Market segment analysis

Market segments

4.3 Market size 2025

4.4 Market outlook: Forecast for 2025-2030

Chart on Global - Market size and forecast 2025-2030 ($ million)
Data Table on Global - Market size and forecast 2025-2030 ($ million)
Chart on Global Market: Year-over-year growth 2025-2030 (%)
Data Table on Global Market: Year-over-year growth 2025-2030 (%)

5. Historic Market Size

5.1 Global Harness Saddlery Equipment Market 2020 - 2024

Historic Market Size - Data Table on Global Harness Saddlery Equipment Market 2020 - 2024 ($ million)

5.2 Product segment analysis 2020 - 2024

Historic Market Size - Product Segment 2020 - 2024 ($ million)

5.3 End-user segment analysis 2020 - 2024

Historic Market Size - End-user Segment 2020 - 2024 ($ million)

5.4 Raw Material segment analysis 2020 - 2024

Historic Market Size - Raw Material Segment 2020 - 2024 ($ million)

5.5 Geography segment analysis 2020 - 2024

Historic Market Size - Geography Segment 2020 - 2024 ($ million)

5.6 Country segment analysis 2020 - 2024

Historic Market Size - Country Segment 2020 - 2024 ($ million)

6. Qualitative Analysis

6.1 Impact of AI on global harness saddlery equipment market

6.2 Impact of geopolitical conflict on global harness saddlery equipment market

7. Five Forces Analysis

7.1 Five forces summary

Five forces analysis - Comparison between 2025 and 2030

7.2 Bargaining power of buyers

Bargaining power of buyers - Impact of key factors 2025 and 2030

7.3 Bargaining power of suppliers

Bargaining power of suppliers - Impact of key factors in 2025 and 2030

7.4 Threat of new entrants

Threat of new entrants - Impact of key factors in 2025 and 2030

7.5 Threat of substitutes

Threat of substitutes - Impact of key factors in 2025 and 2030

7.6 Threat of rivalry

Threat of rivalry - Impact of key factors in 2025 and 2030

7.7 Market condition

Chart on Market condition - Five forces 2025 and 2030

8. Market Segmentation by Product

8.1 Market segments

Chart on Product - Market share 2025-2030 (%)
Data Table on Product - Market share 2025-2030 (%)

8.2 Comparison by Product

Chart on Comparison by Product
Data Table on Comparison by Product

8.3 Saddle equipment - Market size and forecast 2025-2030

Chart on Saddle equipment - Market size and forecast 2025-2030 ($ million)
Data Table on Saddle equipment - Market size and forecast 2025-2030 ($ million)
Chart on Saddle equipment - Year-over-year growth 2025-2030 (%)
Data Table on Saddle equipment - Year-over-year growth 2025-2030 (%)

8.4 Harness equipment - Market size and forecast 2025-2030

Chart on Harness equipment - Market size and forecast 2025-2030 ($ million)
Data Table on Harness equipment - Market size and forecast 2025-2030 ($ million)
Chart on Harness equipment - Year-over-year growth 2025-2030 (%)
Data Table on Harness equipment - Year-over-year growth 2025-2030 (%)

8.5 Market opportunity by Product

Market opportunity by Product ($ million)
Data Table on Market opportunity by Product ($ million)

9. Market Segmentation by End-user

9.1 Market segments

Chart on End-user - Market share 2025-2030 (%)
Data Table on End-user - Market share 2025-2030 (%)

9.2 Comparison by End-user

Chart on Comparison by End-user
Data Table on Comparison by End-user

9.3 Professional - Market size and forecast 2025-2030

Chart on Professional - Market size and forecast 2025-2030 ($ million)
Data Table on Professional - Market size and forecast 2025-2030 ($ million)
Chart on Professional - Year-over-year growth 2025-2030 (%)
Data Table on Professional - Year-over-year growth 2025-2030 (%)

9.4 Amateur - Market size and forecast 2025-2030

Chart on Amateur - Market size and forecast 2025-2030 ($ million)
Data Table on Amateur - Market size and forecast 2025-2030 ($ million)
Chart on Amateur - Year-over-year growth 2025-2030 (%)
Data Table on Amateur - Year-over-year growth 2025-2030 (%)

9.5 Market opportunity by End-user

Market opportunity by End-user ($ million)
Data Table on Market opportunity by End-user ($ million)

10. Market Segmentation by Raw Material

10.1 Market segments

Chart on Raw Material - Market share 2025-2030 (%)
Data Table on Raw Material - Market share 2025-2030 (%)

10.2 Comparison by Raw Material

Chart on Comparison by Raw Material
Data Table on Comparison by Raw Material

10.3 Leather - Market size and forecast 2025-2030

Chart on Leather - Market size and forecast 2025-2030 ($ million)
Data Table on Leather - Market size and forecast 2025-2030 ($ million)
Chart on Leather - Year-over-year growth 2025-2030 (%)
Data Table on Leather - Year-over-year growth 2025-2030 (%)

10.4 Synthetic materials - Market size and forecast 2025-2030

Chart on Synthetic materials - Market size and forecast 2025-2030 ($ million)
Data Table on Synthetic materials - Market size and forecast 2025-2030 ($ million)
Chart on Synthetic materials - Year-over-year growth 2025-2030 (%)
Data Table on Synthetic materials - Year-over-year growth 2025-2030 (%)

10.5 Metal components - Market size and forecast 2025-2030

Chart on Metal components - Market size and forecast 2025-2030 ($ million)
Data Table on Metal components - Market size and forecast 2025-2030 ($ million)
Chart on Metal components - Year-over-year growth 2025-2030 (%)
Data Table on Metal components - Year-over-year growth 2025-2030 (%)

10.6 Textile combinations - Market size and forecast 2025-2030

Chart on Textile combinations - Market size and forecast 2025-2030 ($ million)
Data Table on Textile combinations - Market size and forecast 2025-2030 ($ million)
Chart on Textile combinations - Year-over-year growth 2025-2030 (%)
Data Table on Textile combinations - Year-over-year growth 2025-2030 (%)

10.7 Market opportunity by Raw Material

Market opportunity by Raw Material ($ million)
Data Table on Market opportunity by Raw Material ($ million)

11. Customer Landscape

11.1 Customer landscape overview

Analysis of price sensitivity, lifecycle, customer purchase basket, adoption rates, and purchase criteria

12. Geographic Landscape

12.1 Geographic segmentation

Chart on Market share by geography 2025-2030 (%)
Data Table on Market share by geography 2025-2030 (%)

12.2 Geographic comparison

Chart on Geographic comparison
Data Table on Geographic comparison

12.3 Europe - Market size and forecast 2025-2030

Chart on Europe - Market size and forecast 2025-2030 ($ million)
Data Table on Europe - Market size and forecast 2025-2030 ($ million)
Chart on Europe - Year-over-year growth 2025-2030 (%)
Data Table on Europe - Year-over-year growth 2025-2030 (%)
Chart on Regional Comparison - Europe
Data Table on Regional Comparison - Europe

12.3.1 Germany - Market size and forecast 2025-2030

Chart on Germany - Market size and forecast 2025-2030 ($ million)
Data Table on Germany - Market size and forecast 2025-2030 ($ million)
Chart on Germany - Year-over-year growth 2025-2030 (%)
Data Table on Germany - Year-over-year growth 2025-2030 (%)

12.3.2 UK - Market size and forecast 2025-2030

Chart on UK - Market size and forecast 2025-2030 ($ million)
Data Table on UK - Market size and forecast 2025-2030 ($ million)
Chart on UK - Year-over-year growth 2025-2030 (%)
Data Table on UK - Year-over-year growth 2025-2030 (%)

12.3.3 France - Market size and forecast 2025-2030

Chart on France - Market size and forecast 2025-2030 ($ million)
Data Table on France - Market size and forecast 2025-2030 ($ million)
Chart on France - Year-over-year growth 2025-2030 (%)
Data Table on France - Year-over-year growth 2025-2030 (%)

12.3.4 Italy - Market size and forecast 2025-2030

Chart on Italy - Market size and forecast 2025-2030 ($ million)
Data Table on Italy - Market size and forecast 2025-2030 ($ million)
Chart on Italy - Year-over-year growth 2025-2030 (%)
Data Table on Italy - Year-over-year growth 2025-2030 (%)

12.3.5 Spain - Market size and forecast 2025-2030

Chart on Spain - Market size and forecast 2025-2030 ($ million)
Data Table on Spain - Market size and forecast 2025-2030 ($ million)
Chart on Spain - Year-over-year growth 2025-2030 (%)
Data Table on Spain - Year-over-year growth 2025-2030 (%)

12.3.6 The Netherlands - Market size and forecast 2025-2030

Chart on The Netherlands - Market size and forecast 2025-2030 ($ million)
Data Table on The Netherlands - Market size and forecast 2025-2030 ($ million)
Chart on The Netherlands - Year-over-year growth 2025-2030 (%)
Data Table on The Netherlands - Year-over-year growth 2025-2030 (%)

12.4 North America - Market size and forecast 2025-2030

Chart on North America - Market size and forecast 2025-2030 ($ million)
Data Table on North America - Market size and forecast 2025-2030 ($ million)
Chart on North America - Year-over-year growth 2025-2030 (%)
Data Table on North America - Year-over-year growth 2025-2030 (%)
Chart on Regional Comparison - North America
Data Table on Regional Comparison - North America

12.4.1 US - Market size and forecast 2025-2030

Chart on US - Market size and forecast 2025-2030 ($ million)
Data Table on US - Market size and forecast 2025-2030 ($ million)
Chart on US - Year-over-year growth 2025-2030 (%)
Data Table on US - Year-over-year growth 2025-2030 (%)

12.4.2 Canada - Market size and forecast 2025-2030

Chart on Canada - Market size and forecast 2025-2030 ($ million)
Data Table on Canada - Market size and forecast 2025-2030 ($ million)
Chart on Canada - Year-over-year growth 2025-2030 (%)
Data Table on Canada - Year-over-year growth 2025-2030 (%)

12.4.3 Mexico - Market size and forecast 2025-2030

Chart on Mexico - Market size and forecast 2025-2030 ($ million)
Data Table on Mexico - Market size and forecast 2025-2030 ($ million)
Chart on Mexico - Year-over-year growth 2025-2030 (%)
Data Table on Mexico - Year-over-year growth 2025-2030 (%)

12.5 APAC - Market size and forecast 2025-2030

Chart on APAC - Market size and forecast 2025-2030 ($ million)
Data Table on APAC - Market size and forecast 2025-2030 ($ million)
Chart on APAC - Year-over-year growth 2025-2030 (%)
Data Table on APAC - Year-over-year growth 2025-2030 (%)
Chart on Regional Comparison - APAC
Data Table on Regional Comparison - APAC

12.5.1 China - Market size and forecast 2025-2030

Chart on China - Market size and forecast 2025-2030 ($ million)
Data Table on China - Market size and forecast 2025-2030 ($ million)
Chart on China - Year-over-year growth 2025-2030 (%)
Data Table on China - Year-over-year growth 2025-2030 (%)

12.5.2 Japan - Market size and forecast 2025-2030

Chart on Japan - Market size and forecast 2025-2030 ($ million)
Data Table on Japan - Market size and forecast 2025-2030 ($ million)
Chart on Japan - Year-over-year growth 2025-2030 (%)
Data Table on Japan - Year-over-year growth 2025-2030 (%)

12.5.3 India - Market size and forecast 2025-2030

Chart on India - Market size and forecast 2025-2030 ($ million)
Data Table on India - Market size and forecast 2025-2030 ($ million)
Chart on India - Year-over-year growth 2025-2030 (%)
Data Table on India - Year-over-year growth 2025-2030 (%)

12.5.4 South Korea - Market size and forecast 2025-2030

Chart on South Korea - Market size and forecast 2025-2030 ($ million)
Data Table on South Korea - Market size and forecast 2025-2030 ($ million)
Chart on South Korea - Year-over-year growth 2025-2030 (%)
Data Table on South Korea - Year-over-year growth 2025-2030 (%)

12.5.5 Australia - Market size and forecast 2025-2030

Chart on Australia - Market size and forecast 2025-2030 ($ million)
Data Table on Australia - Market size and forecast 2025-2030 ($ million)
Chart on Australia - Year-over-year growth 2025-2030 (%)
Data Table on Australia - Year-over-year growth 2025-2030 (%)

12.5.6 Indonesia - Market size and forecast 2025-2030

Chart on Indonesia - Market size and forecast 2025-2030 ($ million)
Data Table on Indonesia - Market size and forecast 2025-2030 ($ million)
Chart on Indonesia - Year-over-year growth 2025-2030 (%)
Data Table on Indonesia - Year-over-year growth 2025-2030 (%)

12.6 South America - Market size and forecast 2025-2030

Chart on South America - Market size and forecast 2025-2030 ($ million)
Data Table on South America - Market size and forecast 2025-2030 ($ million)
Chart on South America - Year-over-year growth 2025-2030 (%)
Data Table on South America - Year-over-year growth 2025-2030 (%)
Chart on Regional Comparison - South America
Data Table on Regional Comparison - South America

12.6.1 Brazil - Market size and forecast 2025-2030

Chart on Brazil - Market size and forecast 2025-2030 ($ million)
Data Table on Brazil - Market size and forecast 2025-2030 ($ million)
Chart on Brazil - Year-over-year growth 2025-2030 (%)
Data Table on Brazil - Year-over-year growth 2025-2030 (%)

12.6.2 Argentina - Market size and forecast 2025-2030

Chart on Argentina - Market size and forecast 2025-2030 ($ million)
Data Table on Argentina - Market size and forecast 2025-2030 ($ million)
Chart on Argentina - Year-over-year growth 2025-2030 (%)
Data Table on Argentina - Year-over-year growth 2025-2030 (%)

12.6.3 Chile - Market size and forecast 2025-2030

Chart on Chile - Market size and forecast 2025-2030 ($ million)
Data Table on Chile - Market size and forecast 2025-2030 ($ million)
Chart on Chile - Year-over-year growth 2025-2030 (%)
Data Table on Chile - Year-over-year growth 2025-2030 (%)

12.7 Middle East and Africa - Market size and forecast 2025-2030

Chart on Middle East and Africa - Market size and forecast 2025-2030 ($ million)
Data Table on Middle East and Africa - Market size and forecast 2025-2030 ($ million)
Chart on Middle East and Africa - Year-over-year growth 2025-2030 (%)
Data Table on Middle East and Africa - Year-over-year growth 2025-2030 (%)
Chart on Regional Comparison - Middle East and Africa
Data Table on Regional Comparison - Middle East and Africa

12.7.1 Saudi Arabia - Market size and forecast 2025-2030

Chart on Saudi Arabia - Market size and forecast 2025-2030 ($ million)
Data Table on Saudi Arabia - Market size and forecast 2025-2030 ($ million)
Chart on Saudi Arabia - Year-over-year growth 2025-2030 (%)
Data Table on Saudi Arabia - Year-over-year growth 2025-2030 (%)

12.7.2 UAE - Market size and forecast 2025-2030

Chart on UAE - Market size and forecast 2025-2030 ($ million)
Data Table on UAE - Market size and forecast 2025-2030 ($ million)
Chart on UAE - Year-over-year growth 2025-2030 (%)
Data Table on UAE - Year-over-year growth 2025-2030 (%)

12.7.3 South Africa - Market size and forecast 2025-2030

Chart on South Africa - Market size and forecast 2025-2030 ($ million)
Data Table on South Africa - Market size and forecast 2025-2030 ($ million)
Chart on South Africa - Year-over-year growth 2025-2030 (%)
Data Table on South Africa - Year-over-year growth 2025-2030 (%)

12.7.4 Israel - Market size and forecast 2025-2030

Chart on Israel - Market size and forecast 2025-2030 ($ million)
Data Table on Israel - Market size and forecast 2025-2030 ($ million)
Chart on Israel - Year-over-year growth 2025-2030 (%)
Data Table on Israel - Year-over-year growth 2025-2030 (%)

12.7.5 Turkey - Market size and forecast 2025-2030

Chart on Turkey - Market size and forecast 2025-2030 ($ million)
Data Table on Turkey - Market size and forecast 2025-2030 ($ million)
Chart on Turkey - Year-over-year growth 2025-2030 (%)
Data Table on Turkey - Year-over-year growth 2025-2030 (%)

12.8 Market opportunity by geography

Market opportunity by geography ($ million)
Data Tables on Market opportunity by geography ($ million)

13. Drivers, Challenges, and Opportunity

13.1 Market drivers

Institutionalization of equine welfare compliance
Expansion of technological convergence and digitalized biometric performance tracking
Strategic sourcing realignment and accelerated adoption of advanced synthetic materials

13.2 Market challenges

Escalating raw material sourcing and tannery operational costs
Regulatory compliance and stringent equipment enforcement standards
Logistical fragmentations and high weight to volume freight penalties

13.3 Impact of drivers and challenges

Impact of drivers and challenges in 2025 and 2030

13.4 Market opportunities

Proliferation of custom fit 3D printing and additive saddle tree manufacture
Surge in specialized online retail platforms and virtual saddle fitting infrastructure
Rise of safety first mechanical engineering and quick release integration

14. Competitive Landscape

14.1 Overview

14.2

Overview on criticality of inputs and factors of differentiation

14.3 Landscape disruption

Overview on factors of disruption

14.4 Industry risks

Impact of key risks on business

15. Competitive Analysis

15.1 Companies profiled

Companies covered

15.2 Company ranking index

15.3 Market positioning of companies

Matrix on companies position and classification

15.4 Circle Y Saddles Inc.

Circle Y Saddles Inc. - Overview
Circle Y Saddles Inc. - Product / Service
Circle Y Saddles Inc. - Key offerings
SWOT

15.5 CWD Sellier

CWD Sellier - Overview
CWD Sellier - Product / Service
CWD Sellier - Key offerings
SWOT

15.6 Fairfax Saddles Ltd

Fairfax Saddles Ltd - Overview
Fairfax Saddles Ltd - Product / Service
Fairfax Saddles Ltd - Key offerings
SWOT

15.7 Harry Dabbs Saddlery

Harry Dabbs Saddlery - Overview
Harry Dabbs Saddlery - Product / Service
Harry Dabbs Saddlery - Key offerings
SWOT

15.8 Hermes International SA

Hermes International SA - Overview
Hermes International SA - Business segments
Hermes International SA - Key offerings
Hermes International SA - Segment focus
SWOT

15.9 Horze International GmbH

Horze International GmbH - Overview
Horze International GmbH - Product / Service
Horze International GmbH - Key offerings
SWOT

15.10 Ideal Saddle Company Ltd

Ideal Saddle Company Ltd - Overview
Ideal Saddle Company Ltd - Product / Service
Ideal Saddle Company Ltd - Key offerings
SWOT

15.11 JPC Equestrian Inc.

JPC Equestrian Inc. - Overview
JPC Equestrian Inc. - Product / Service
JPC Equestrian Inc. - Key offerings
SWOT

15.12 Kieffer GmbH

Kieffer GmbH - Overview
Kieffer GmbH - Product / Service
Kieffer GmbH - Key offerings
SWOT

15.13 Passier and Sohn GmbH

Passier and Sohn GmbH - Overview
Passier and Sohn GmbH - Product / Service
Passier and Sohn GmbH - Key offerings
SWOT

15.14 Prestige Italia S.p.A.

Prestige Italia S.p.A. - Overview
Prestige Italia S.p.A. - Product / Service
Prestige Italia S.p.A. - Key offerings
SWOT

15.15 Schockemohle Sports GmbH

Schockemohle Sports GmbH - Overview
Schockemohle Sports GmbH - Product / Service
Schockemohle Sports GmbH - Key offerings
SWOT

15.16 Shires Equestrian

Shires Equestrian - Overview
Shires Equestrian - Product / Service
Shires Equestrian - Key offerings
SWOT

15.17 Weatherbeeta USA Inc.

Weatherbeeta USA Inc. - Overview
Weatherbeeta USA Inc. - Product / Service
Weatherbeeta USA Inc. - Key offerings
SWOT

15.18 Weaver Leather LLC

Weaver Leather LLC - Overview
Weaver Leather LLC - Product / Service
Weaver Leather LLC - Key offerings
SWOT

16. Appendix

16.1 Scope of the report

Market definition
Objectives
Notes and caveats

16.2 Inclusions and exclusions checklist

Inclusions checklist
Exclusions checklist

16.3 Currency conversion rates for US$

16.4 Research methodology

16.5 Data procurement

Information sources

16.6 Data validation

16.7 Validation techniques employed for market sizing

16.8 Data synthesis

16.9 360 degree market analysis

16.10 List of abbreviations

Research Methodology

Technavio presents a detailed picture of the market by way of study, synthesis, and summation of data from multiple sources. The analysts have presented the various facets of the market with a particular focus on identifying the key industry influencers. The data thus presented is comprehensive, reliable, and the result of extensive research, both primary and secondary.

INFORMATION SOURCES

Primary sources

  • Manufacturers and suppliers
  • Channel partners
  • Industry experts
  • Strategic decision makers

Secondary sources

  • Industry journals and periodicals
  • Government data
  • Financial reports of key industry players
  • Historical data
  • Press releases

DATA ANALYSIS

Data Synthesis

  • Collation of data
  • Estimation of key figures
  • Analysis of derived insights

Data Validation

  • Triangulation with data models
  • Reference against proprietary databases
  • Corroboration with industry experts

REPORT WRITING

Qualitative

  • Market drivers
  • Market challenges
  • Market trends
  • Five forces analysis

Quantitative

  • Market size and forecast
  • Market segmentation
  • Geographical insights
  • Competitive landscape

Interested in this report?

Get your sample now to see our research methodology and insights!

Download Now

Frequently Asked Questions

Harness Saddlery Equipment market growth will increase by USD 594.7 million during 2026-2030.

The Harness Saddlery Equipment market is expected to grow at a CAGR of 5.6% during 2026-2030.

Harness Saddlery Equipment market is segmented by Product (Saddle equipment, Harness equipment) End-user (Professional, Amateur) Raw material (Leather, Synthetic materials, Metal components, Textile combinations)

Albion Saddlemakers Co. Ltd, Amerigo Saddles, Antares Sellier France, Black Country Saddles, Bruno Delgrange, Circle Y Saddles Inc., CWD Sellier, Fairfax Saddles Ltd, Harry Dabbs Saddlery, Hermes International SA, Horze International GmbH, Ideal Saddle Company Ltd, JPC Equestrian Inc., Kieffer GmbH, Passier and Sohn GmbH, Prestige Italia S.p.A., Schockemohle Sports GmbH, Shires Equestrian, Weatherbeeta USA Inc., Weaver Leather LLC are a few of the key vendors in the Harness Saddlery Equipment market.

Europe will register the highest growth rate of 39.4% among the other regions. Therefore, the Harness Saddlery Equipment market in Europe is expected to garner significant business opportunities for the vendors during the forecast period.

Germany, UK, France, Italy, Spain, The Netherlands, US, Canada, Mexico, China, Japan, India, South Korea, Australia, Indonesia, Brazil, Argentina, Chile, Saudi Arabia, UAE, South Africa, Israel, Turkey

  • Institutionalization of equine welfare compliance is the driving factor this market.

The Harness Saddlery Equipment market vendors should focus on grabbing business opportunities from the Product segment as it accounted for the largest market share in the base year.
RIA - Research AI Assistant
Ask RIA