Hearing Amplifiers Market Analysis Europe, North America, Asia, Rest of World (ROW) - US, Germany, Italy, China, Japan - Size and Forecast 2024-2028

Hearing Amplifiers Market Analysis Europe, North America, Asia, Rest of World (ROW) - US, Germany, Italy, China, Japan - Size and Forecast 2024-2028

Published: Oct 2023 154 Pages SKU: IRTNTR74618

Market Overview at a Glance

$28.29 B
Market Opportunity
5.66%
CAGR
5.22
YoY growth 2023-2024(%)

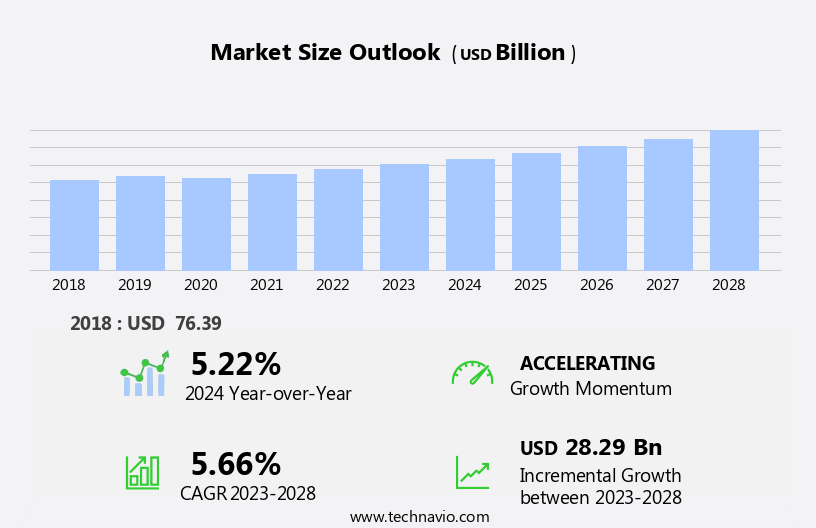
Hearing Amplifiers Market Size 2024-2028

The hearing amplifiers market size is forecast to increase by USD 28.29 billion, at a CAGR of 5.66% between 2023 and 2028.

  • The market is experiencing significant growth due to the increasing number of individuals diagnosed with hearing loss. This trend is driven by an aging population and rising awareness of the importance of early intervention for hearing health. Furthermore, the integration of Internet of Things (IoT) technology into hearing amplifiers is adding value to the market. These advanced devices offer additional features such as connectivity to smartphones, TVs, and other devices, enhancing the overall user experience. However, challenges persist in the form of battery concerns.
  • As hearing amplifiers require frequent battery replacements, addressing this issue through innovative battery technologies or alternative power sources could be a key differentiator for market participants. Companies that successfully navigate these challenges and capitalize on the growing demand for hearing solutions will be well-positioned to succeed in this dynamic market.

What will be the Size of the Hearing Amplifiers Market during the forecast period?

Hearing Amplifiers Market Size

Explore in-depth regional segment analysis with market size data - historical 2018-2022 and forecasts 2024-2028 - in the full report.  
Request Free Sample

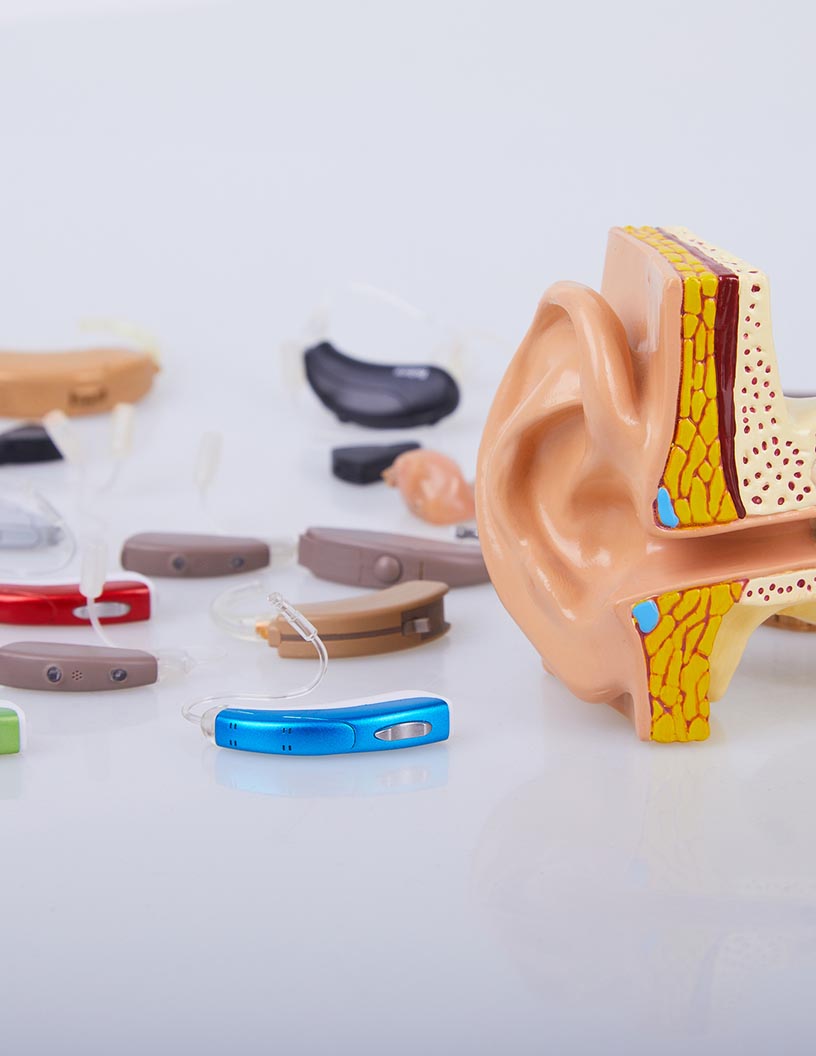
The market continues to evolve, driven by advancements in technology and growing demand for effective solutions to address various types and degrees of hearing loss. Hearing amplifiers, also known as personal sound amplification products (PSAPs), offer customizable sound amplification for individuals with normal hearing or mild to moderate hearing loss. These devices incorporate features such as directional microphones, gain adjustment, and noise reduction algorithms to enhance sound quality and improve listening experiences in diverse environments. In-the-ear models, including in-the-canal and completely-in-canal designs, cater to individual preferences and offer discreet solutions. Moreover, hearing amplifiers are increasingly compatible with cochlear implants and wireless connectivity options, enabling seamless integration with other devices like smartphones and televisions.

Advanced features like tinnitus maskers, open-fit designs, and sound localization capabilities further expand the market's reach and applications. As technology progresses, hearing amplifiers continue to evolve, offering improved performance, longer battery life, and more sophisticated features tailored to meet the unique needs of various user profiles. The market's ongoing dynamism reflects the growing importance of effective hearing solutions in various sectors, including healthcare, education, and entertainment.

How is this Hearing Amplifiers Industry segmented?

The hearing amplifiers industry research report provides comprehensive data (region-wise segment analysis), with forecasts and estimates in "USD billion" for the period 2024-2028, as well as historical data from 2018-2022 for the following segments.

  • Distribution Channel
    • Offline
    • Online
  • Type
    • Behind-the-ear
    • In-the-ear
  • Geography
    • North America
      • US
    • Europe
      • Germany
      • Italy
    • APAC
      • China
      • Japan
    • Rest of World (ROW)

By Distribution Channel Insights

The offline segment is estimated to witness significant growth during the forecast period.

In the dynamic market of 2023, the offline segment dominates due to the surge in availability of amplifiers in retail stores and hospitals. The segment's growth is driven by the rising number of young and adult populations with hearing impairments worldwide. Additionally, the demand for personalized sound amplification products (PSAP) recommended by healthcare professionals for the geriatric population further fuels the segment's expansion. The proliferation of standalone pharmacies and hospitals, particularly in developing countries, is expected to boost the market significantly. This trend is attributed to the growing need for hearing aid devices, including hearing amplifiers, which are increasingly accessible through the offline segment.

Digital signal processing, custom-fit hearing aids, and directional microphones are essential features that cater to diverse hearing loss needs. Hearing amplifiers with telecoil technology, Bluetooth connectivity, and tinnitus maskers offer enhanced functionality and convenience. Adjustable volume control, feedback cancellation systems, and speech enhancement are other essential features that contribute to the market's growth. Hearing loss severity and auditory processing capabilities influence the demand for various types of hearing amplifiers, including behind-the-ear, in-the-canal, receiver-in-canal, and completely-in-canal models. The market is also witnessing the integration of advanced technologies such as high-frequency and low-frequency amplification, noise reduction algorithms, and sound localization features to cater to the evolving needs of consumers.

Power hearing aids with rechargeable battery life and cochlear implant compatibility are gaining popularity due to their extended usage hours and compatibility with other assistive listening devices. In conclusion, the market is experiencing significant growth, driven by the increasing prevalence of hearing loss, the availability of various types and features, and the expanding distribution channels.

Hearing Amplifiers Market Size

Request Free Sample

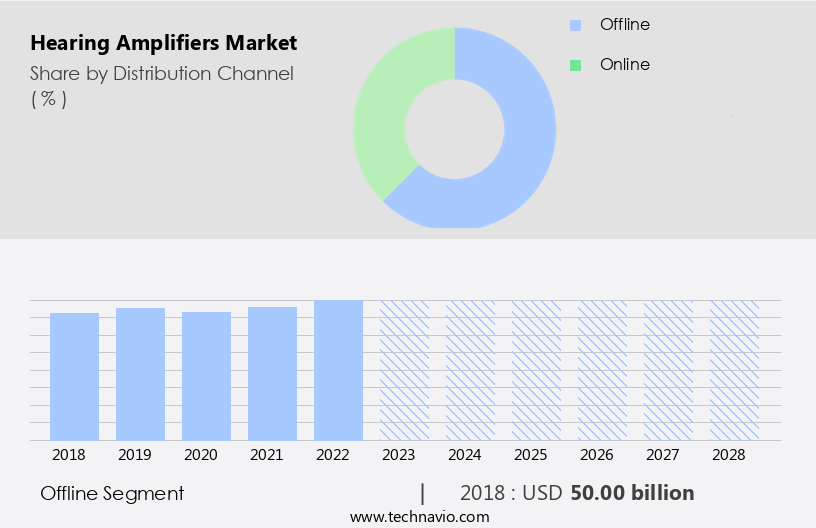
The Offline segment was valued at USD 50.00 billion in 2018 and showed a gradual increase during the forecast period.
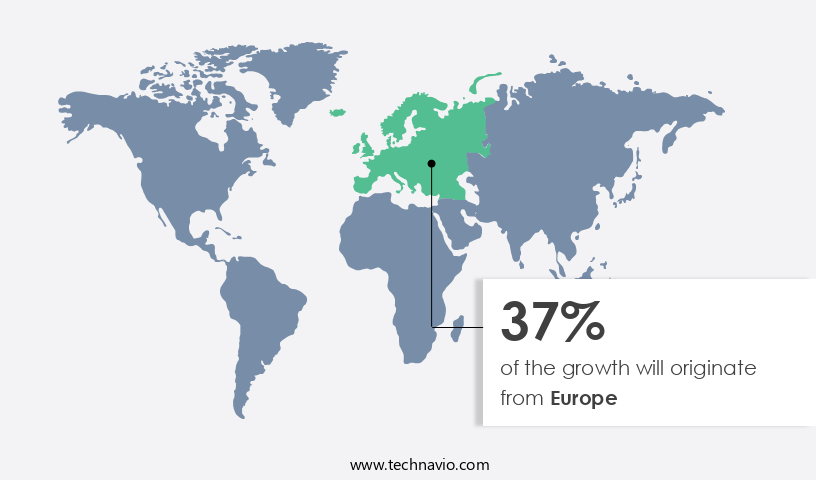
Regional Analysis

Europe is estimated to contribute 37% to the growth of the global market during the forecast period. Technavio's analysts have elaborately explained the regional trends and drivers that shape the market during the forecast period.

Hearing Amplifiers Market Share by Geography

 Request Free Sample

The European market holds a significant share in the global hearing amplifiers industry, driven by the increasing prevalence of hearing loss and technological advancements. With countries like the UK, Germany, and France reporting rising instances of hearing impairments, there is a growing emphasis on the adoption of hearing devices. Notably, government bodies and healthcare providers are actively promoting their use. For instance, in early 2021, the French Ministry of Health and Prevention approved reimbursements for various hearing aid designs. Innovations in hearing aid technology, such as digital signal processing, directional microphones, and feedback cancellation systems, enhance user experience.

Additionally, features like adjustable volume control, wireless connectivity options, and tinnitus maskers cater to diverse user needs. Hearing aids come in various styles, including custom-fit, behind-the-ear, in-the-canal, and completely-in-canal, providing users with a range of choices based on their preferences and hearing loss severity. Moreover, advancements in audio amplification technology, including high-frequency and low-frequency amplification, improve sound quality for users. Cochlear implant compatibility, noise reduction algorithms, and speech enhancement further enhance the functionality of these devices. Furthermore, telecoil technology and Bluetooth connectivity enable seamless integration with other devices, such as smartphones and televisions. Rechargeable battery life and power hearing aids cater to users' convenience, ensuring uninterrupted use.

As the market continues to evolve, advancements in auditory processing and sound localization features will further enhance the overall user experience.

Market Dynamics

Our researchers analyzed the data with 2023 as the base year, along with the key drivers, trends, and challenges. A holistic analysis of drivers will help companies refine their marketing strategies to gain a competitive advantage.

What are the key market drivers leading to the rise in the adoption of Hearing Amplifiers Industry?

  • The significant increase in the global population experiencing hearing loss serves as the primary market driver. 
  • The global hearing amplifier market is witnessing notable growth due to the rising prevalence of hearing impairments and related disorders. According to the Centers for Disease Control and Prevention (CDC), approximately 6,000 infants in the US were born with permanent hearing loss in June 2021. The geriatric population's growth is another significant factor driving market expansion. Hearing amplifiers cater to various types of hearing loss, including those requiring custom-fit solutions using hearing aid microphones and personal sound amplification devices. Advanced technologies such as digital signal processing and hybrid hearing aids, including behind-the-ear models, offer improved sound quality and reduced acoustic feedback.
  • Assistive listening devices are also gaining popularity due to their ability to enhance the listening experience in noisy environments. Noise pollution, a growing concern worldwide, further increases the demand for hearing amplifiers.

What are the market trends shaping the Hearing Amplifiers Industry?

  • The integration of Internet of Things (IoT) technology into devices and the subsequent addition of advanced features is a significant market trend. This development signifies a major shift towards more connected and intelligent devices.
  • The market is experiencing significant growth due to the increasing demand for IoT-integrated devices. Advanced audio amplification technology, including high-frequency and low-frequency amplification, is driving the market forward. Receiver-in-canal hearing aids, equipped with telecoil technology and output limiting, are gaining popularity. The frequency response curve is being optimized to cater to various hearing loss needs. Bluetooth hearing aids, which enable seamless connectivity with smartphones, are a top preference for users.
  • The integration of voice search options, RFID sensors, and biometric analysis further enhances the functionality and convenience of these devices. The global market is witnessing a shift towards these advanced features, as users seek improved monitoring capabilities and effortless connectivity.

What challenges does the Hearing Amplifiers Industry face during its growth?

  • The growth of the hearing amplifier industry is significantly impacted by the challenge of addressing battery concerns. This issue, which is of great importance, necessitates continuous innovation and improvement in battery technology to ensure uninterrupted use and user satisfaction. 
  • Hearing amplifiers, a vital solution for individuals with hearing difficulties, have seen significant advancements in technology. However, one persistent challenge remains: battery life. The longevity of hearing amplifiers is influenced by several factors, including battery milliamp-hour (mAh) rating, signal intensity, gain control, sound input, and discharge voltage level. For instance, the amount of gain control and battery current depends on the settings of volume and filter controls in the amplifiers. Advanced and multipurpose hearing amplifiers, featuring directional microphones, wireless connectivity options, tinnitus maskers, and sound localization features, often face the issue of shorter battery life due to their power-consuming functionalities.
  • Cochlear implant compatibility and open-fit hearing aid designs further add to the power requirements, impacting battery life. By addressing these concerns, manufacturers can improve the overall user experience and satisfaction with their products.

Exclusive Customer Landscape

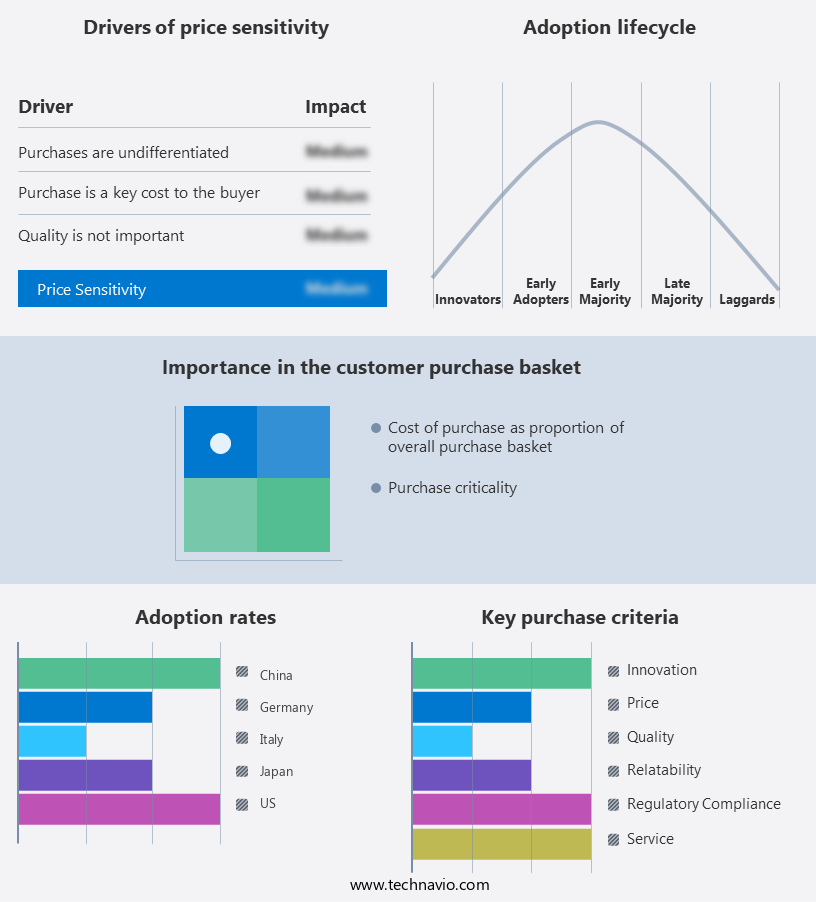
The hearing amplifiers market forecasting report includes the adoption lifecycle of the market, covering from the innovator's stage to the laggard's stage. It focuses on adoption rates in different regions based on penetration. Furthermore, the hearing amplifiers market report also includes key purchase criteria and drivers of price sensitivity to help companies evaluate and develop their market growth analysis strategies.

Hearing Amplifiers Market Share by Geography

 Customer Landscape

Key Companies & Market Insights

Companies are implementing various strategies, such as strategic alliances, hearing amplifiers market forecast, partnerships, mergers and acquisitions, geographical expansion, and product/service launches, to enhance their presence in the industry.

Austar Hearing Science and Technology Xiamen Co. Ltd. - The company specializes in providing a range of hearing amplification solutions, including over-the-counter digital rechargeable RIC and BTE open fit models. Their offerings prioritize affordability and advanced technology, catering to diverse hearing needs.

The industry research and growth report includes detailed analyses of the competitive landscape of the market and information about key companies, including:

  • Austar Hearing Science and Technology Xiamen Co. Ltd.
  • Beurer GmbH
  • Claratone
  • Cochlear Ltd.
  • Demant AS
  • Eargo Inc.
  • Foshan Vohom Technology Co. Ltd.
  • GN Store Nord AS
  • Huizhou Jinghao Medical Technology Co. Ltd.
  • InnerScope Hearing Technologies Inc.
  • Intricon Corp.
  • MDHearingAid Inc.
  • MEDca Hearing
  • Otofonix Hearing Solutions
  • Sonova AG
  • Sound World Solutions
  • Starkey Laboratories Inc.
  • WS Audiology AS
  • ZipHearing LLC
  • Lucid Hearing Holding Co. LLC

Qualitative and quantitative analysis of companies has been conducted to help clients understand the wider business environment as well as the strengths and weaknesses of key industry players. Data is qualitatively analyzed to categorize companies as pure play, category-focused, industry-focused, and diversified; it is quantitatively analyzed to categorize companies as dominant, leading, strong, tentative, and weak.

Recent Development and News in Hearing Amplifiers Market

  • In January 2024, Sonova Holding AG, a leading provider of hearing solutions, launched the new Phonak Bolero B-Direct hearing aids, enabling direct streaming from Apple and Android devices without the need for an intermediary device (Sonova press release, 2024).
  • In March 2024, Starkey Hearing Technologies and Google announced a strategic partnership to integrate Google Assistant directly into Starkey's Livio AI hearing aids, allowing users to access Google Assistant features hands-free (Starkey press release, 2024).
  • In May 2024, Signia, a Sivantos brand, received FDA approval for its new Xperience X hearing aids, featuring the world's most advanced Bluetooth technology, allowing for high-definition binaural streaming and better speech recognition (Sivantos press release, 2024).
  • In April 2025, Widex, a Danish hearing aid manufacturer, secured a USD 100 million investment from EQT Ventures to accelerate its digital transformation and expand its market presence (EQT Ventures press release, 2025).

Research Analyst Overview

  • The hearing amplifier market is characterized by advancements in technology, with adaptive noise cancellation and binaural processing becoming increasingly popular. Multi-channel processing enhances sound clarity improvement, while total harmonic distortion remains a crucial factor in ensuring speech intelligibility testing. Connectivity protocols, such as Bluetooth Low Energy, enable wireless range expansion. Battery power consumption is a significant concern, with peak clipping prevention and automatic gain control addressing this issue. Data transmission rate and directional audio processing improve user experience, while output impedance and fitting procedure ensure proper device functionality. Maintenance procedures and troubleshooting techniques are essential for long-term use, with environmental noise reduction and automatic gain control contributing to improved sound quality.
  • Audio compression and frequency shaping optimize battery life, and input impedance and amplifier gain settings cater to individual user preferences. Speech intelligibility testing, signal-to-noise ratio, and harmonic distortion measurement are key performance indicators, while frequency response range and microphone sensitivity determine device capabilities. User interface design and device latency are critical factors in ensuring user satisfaction.

Dive into Technavio's robust research methodology, blending expert interviews, extensive data synthesis, and validated models for unparalleled Hearing Amplifiers Market insights. See full methodology.

Market Scope

Report Coverage

Details

Page number

154

Base year

2023

Historic period

2018-2022

Forecast period

2024-2028

Growth momentum & CAGR

Accelerate at a CAGR of 5.66%

Market growth 2024-2028

USD 28.29 billion

Market structure

Fragmented

YoY growth 2023-2024(%)

5.22

Key countries

US, Germany, Italy, China, and Japan

Competitive landscape

Leading Companies, Market Positioning of Companies, Competitive Strategies, and Industry Risks

Request Free Sample

What are the Key Data Covered in this Hearing Amplifiers Market Research and Growth Report?

  • CAGR of the Hearing Amplifiers industry during the forecast period
  • Detailed information on factors that will drive the growth and forecasting between 2024 and 2028
  • Precise estimation of the size of the market and its contribution of the industry in focus to the parent market
  • Accurate predictions about upcoming growth and trends and changes in consumer behaviour
  • Growth of the market across Europe, North America, Asia, and Rest of World (ROW)
  • Thorough analysis of the market's competitive landscape and detailed information about companies
  • Comprehensive analysis of factors that will challenge the hearing amplifiers market growth of industry companies

We can help! Our analysts can customize this hearing amplifiers market research report to meet your requirements.

Get in touch

1 Executive Summary

  • 1.1 Market overview
    • Exhibit 01: Executive Summary – Chart on Market Overview
    • Exhibit 02: Executive Summary – Data Table on Market Overview
    • Exhibit 03: Executive Summary – Chart on Global Market Characteristics
    • Exhibit 04: Executive Summary – Chart on Market by Geography
    • Exhibit 05: Executive Summary – Chart on Market Segmentation by Distribution Channel
    • Exhibit 06: Executive Summary – Chart on Market Segmentation by Type
    • Exhibit 07: Executive Summary – Chart on Incremental Growth
    • Exhibit 08: Executive Summary – Data Table on Incremental Growth
    • Exhibit 09: Executive Summary – Chart on Vendor Market Positioning

2 Market Landscape

  • 2.1 Market ecosystem
    • Exhibit 10: Parent market
    • Exhibit 11: Market Characteristics

3 Market Sizing

  • 3.1 Market definition
    • Exhibit 12: Offerings of vendors included in the market definition
  • 3.2 Market segment analysis
    • Exhibit 13: Market segments
  • 3.3 Market size 2023
    • 3.4 Market outlook: Forecast for 2023-2028
      • Exhibit 14: Chart on Global - Market size and forecast 2023-2028 ($ billion)
      • Exhibit 15: Data Table on Global - Market size and forecast 2023-2028 ($ billion)
      • Exhibit 16: Chart on Global Market: Year-over-year growth 2023-2028 (%)
      • Exhibit 17: Data Table on Global Market: Year-over-year growth 2023-2028 (%)

    4 Historic Market Size

    • 4.1 Global hearing amplifiers market 2018 - 2022
      • Exhibit 18: Historic Market Size – Data Table on global hearing amplifiers market 2018 - 2022 ($ billion)
    • 4.2 Distribution channel Segment Analysis 2018 - 2022
      • Exhibit 19: Historic Market Size – Distribution channel Segment 2018 - 2022 ($ billion)
    • 4.3 Type Segment Analysis 2018 - 2022
      • Exhibit 20: Historic Market Size – Type Segment 2018 - 2022 ($ billion)
    • 4.4 Geography Segment Analysis 2018 - 2022
      • Exhibit 21: Historic Market Size – Geography Segment 2018 - 2022 ($ billion)
    • 4.5 Country Segment Analysis 2018 - 2022
      • Exhibit 22: Historic Market Size – Country Segment 2018 - 2022 ($ billion)

    5 Five Forces Analysis

    • 5.1 Five forces summary
      • Exhibit 23: Five forces analysis - Comparison between 2023 and 2028
    • 5.2 Bargaining power of buyers
      • Exhibit 24: Chart on Bargaining power of buyers – Impact of key factors 2023 and 2028
    • 5.3 Bargaining power of suppliers
      • Exhibit 25: Bargaining power of suppliers – Impact of key factors in 2023 and 2028
    • 5.4 Threat of new entrants
      • Exhibit 26: Threat of new entrants – Impact of key factors in 2023 and 2028
    • 5.5 Threat of substitutes
      • Exhibit 27: Threat of substitutes – Impact of key factors in 2023 and 2028
    • 5.6 Threat of rivalry
      • Exhibit 28: Threat of rivalry – Impact of key factors in 2023 and 2028
    • 5.7 Market condition
      • Exhibit 29: Chart on Market condition - Five forces 2023 and 2028

    6 Market Segmentation by Distribution Channel

    • 6.1 Market segments
      • Exhibit 30: Chart on Distribution Channel - Market share 2023-2028 (%)
      • Exhibit 31: Data Table on Distribution Channel - Market share 2023-2028 (%)
    • 6.2 Comparison by Distribution Channel
      • Exhibit 32: Chart on Comparison by Distribution Channel
      • Exhibit 33: Data Table on Comparison by Distribution Channel
    • 6.3 Offline - Market size and forecast 2023-2028
      • Exhibit 34: Chart on Offline - Market size and forecast 2023-2028 ($ billion)
      • Exhibit 35: Data Table on Offline - Market size and forecast 2023-2028 ($ billion)
      • Exhibit 36: Chart on Offline - Year-over-year growth 2023-2028 (%)
      • Exhibit 37: Data Table on Offline - Year-over-year growth 2023-2028 (%)
    • 6.4 Online - Market size and forecast 2023-2028
      • Exhibit 38: Chart on Online - Market size and forecast 2023-2028 ($ billion)
      • Exhibit 39: Data Table on Online - Market size and forecast 2023-2028 ($ billion)
      • Exhibit 40: Chart on Online - Year-over-year growth 2023-2028 (%)
      • Exhibit 41: Data Table on Online - Year-over-year growth 2023-2028 (%)
    • 6.5 Market opportunity by Distribution Channel
      • Exhibit 42: Market opportunity by Distribution Channel ($ billion)
      • Exhibit 43: Data Table on Market opportunity by Distribution Channel ($ billion)

    7 Market Segmentation by Type

    • 7.1 Market segments
      • Exhibit 44: Chart on Type - Market share 2023-2028 (%)
      • Exhibit 45: Data Table on Type - Market share 2023-2028 (%)
    • 7.2 Comparison by Type
      • Exhibit 46: Chart on Comparison by Type
      • Exhibit 47: Data Table on Comparison by Type
    • 7.3 Behind-the-ear - Market size and forecast 2023-2028
      • Exhibit 48: Chart on Behind-the-ear - Market size and forecast 2023-2028 ($ billion)
      • Exhibit 49: Data Table on Behind-the-ear - Market size and forecast 2023-2028 ($ billion)
      • Exhibit 50: Chart on Behind-the-ear - Year-over-year growth 2023-2028 (%)
      • Exhibit 51: Data Table on Behind-the-ear - Year-over-year growth 2023-2028 (%)
    • 7.4 In-the-ear - Market size and forecast 2023-2028
      • Exhibit 52: Chart on In-the-ear - Market size and forecast 2023-2028 ($ billion)
      • Exhibit 53: Data Table on In-the-ear - Market size and forecast 2023-2028 ($ billion)
      • Exhibit 54: Chart on In-the-ear - Year-over-year growth 2023-2028 (%)
      • Exhibit 55: Data Table on In-the-ear - Year-over-year growth 2023-2028 (%)
    • 7.5 Market opportunity by Type
      • Exhibit 56: Market opportunity by Type ($ billion)
      • Exhibit 57: Data Table on Market opportunity by Type ($ billion)

    8 Customer Landscape

    • 8.1 Customer landscape overview
      • Exhibit 58: Analysis of price sensitivity, lifecycle, customer purchase basket, adoption rates, and purchase criteria

    9 Geographic Landscape

    • 9.1 Geographic segmentation
      • Exhibit 59: Chart on Market share by geography 2023-2028 (%)
      • Exhibit 60: Data Table on Market share by geography 2023-2028 (%)
    • 9.2 Geographic comparison
      • Exhibit 61: Chart on Geographic comparison
      • Exhibit 62: Data Table on Geographic comparison
    • 9.3 Europe - Market size and forecast 2023-2028
      • Exhibit 63: Chart on Europe - Market size and forecast 2023-2028 ($ billion)
      • Exhibit 64: Data Table on Europe - Market size and forecast 2023-2028 ($ billion)
      • Exhibit 65: Chart on Europe - Year-over-year growth 2023-2028 (%)
      • Exhibit 66: Data Table on Europe - Year-over-year growth 2023-2028 (%)
    • 9.4 North America - Market size and forecast 2023-2028
      • Exhibit 67: Chart on North America - Market size and forecast 2023-2028 ($ billion)
      • Exhibit 68: Data Table on North America - Market size and forecast 2023-2028 ($ billion)
      • Exhibit 69: Chart on North America - Year-over-year growth 2023-2028 (%)
      • Exhibit 70: Data Table on North America - Year-over-year growth 2023-2028 (%)
    • 9.5 Asia - Market size and forecast 2023-2028
      • Exhibit 71: Chart on Asia - Market size and forecast 2023-2028 ($ billion)
      • Exhibit 72: Data Table on Asia - Market size and forecast 2023-2028 ($ billion)
      • Exhibit 73: Chart on Asia - Year-over-year growth 2023-2028 (%)
      • Exhibit 74: Data Table on Asia - Year-over-year growth 2023-2028 (%)
    • 9.6 Rest of World (ROW) - Market size and forecast 2023-2028
      • Exhibit 75: Chart on Rest of World (ROW) - Market size and forecast 2023-2028 ($ billion)
      • Exhibit 76: Data Table on Rest of World (ROW) - Market size and forecast 2023-2028 ($ billion)
      • Exhibit 77: Chart on Rest of World (ROW) - Year-over-year growth 2023-2028 (%)
      • Exhibit 78: Data Table on Rest of World (ROW) - Year-over-year growth 2023-2028 (%)
    • 9.7 US - Market size and forecast 2023-2028
      • Exhibit 79: Chart on US - Market size and forecast 2023-2028 ($ billion)
      • Exhibit 80: Data Table on US - Market size and forecast 2023-2028 ($ billion)
      • Exhibit 81: Chart on US - Year-over-year growth 2023-2028 (%)
      • Exhibit 82: Data Table on US - Year-over-year growth 2023-2028 (%)
    • 9.8 China - Market size and forecast 2023-2028
      • Exhibit 83: Chart on China - Market size and forecast 2023-2028 ($ billion)
      • Exhibit 84: Data Table on China - Market size and forecast 2023-2028 ($ billion)
      • Exhibit 85: Chart on China - Year-over-year growth 2023-2028 (%)
      • Exhibit 86: Data Table on China - Year-over-year growth 2023-2028 (%)
    • 9.9 Germany - Market size and forecast 2023-2028
      • Exhibit 87: Chart on Germany - Market size and forecast 2023-2028 ($ billion)
      • Exhibit 88: Data Table on Germany - Market size and forecast 2023-2028 ($ billion)
      • Exhibit 89: Chart on Germany - Year-over-year growth 2023-2028 (%)
      • Exhibit 90: Data Table on Germany - Year-over-year growth 2023-2028 (%)
    • 9.10 Italy - Market size and forecast 2023-2028
      • Exhibit 91: Chart on Italy - Market size and forecast 2023-2028 ($ billion)
      • Exhibit 92: Data Table on Italy - Market size and forecast 2023-2028 ($ billion)
      • Exhibit 93: Chart on Italy - Year-over-year growth 2023-2028 (%)
      • Exhibit 94: Data Table on Italy - Year-over-year growth 2023-2028 (%)
    • 9.11 Japan - Market size and forecast 2023-2028
      • Exhibit 95: Chart on Japan - Market size and forecast 2023-2028 ($ billion)
      • Exhibit 96: Data Table on Japan - Market size and forecast 2023-2028 ($ billion)
      • Exhibit 97: Chart on Japan - Year-over-year growth 2023-2028 (%)
      • Exhibit 98: Data Table on Japan - Year-over-year growth 2023-2028 (%)
    • 9.12 Market opportunity by geography
      • Exhibit 99: Market opportunity by geography ($ billion)
      • Exhibit 100: Data Tables on Market opportunity by geography ($ billion)

    10 Drivers, Challenges, and Trends

    • 10.1 Market drivers
      • 10.2 Market challenges
        • 10.3 Impact of drivers and challenges
          • Exhibit 101: Impact of drivers and challenges in 2023 and 2028
        • 10.4 Market trends

          11 Vendor Landscape

          • 11.1 Overview
            • 11.2 Vendor landscape
              • Exhibit 102: Overview on Criticality of inputs and Factors of differentiation
            • 11.3 Landscape disruption
              • Exhibit 103: Overview on factors of disruption
            • 11.4 Industry risks
              • Exhibit 104: Impact of key risks on business

            12 Vendor Analysis

            • 12.1 Vendors covered
              • Exhibit 105: Vendors covered
            • 12.2 Market positioning of vendors
              • Exhibit 106: Matrix on vendor position and classification
            • 12.3 Austar Hearing Science and Technology Xiamen Co. Ltd.
              • Exhibit 107: Austar Hearing Science and Technology Xiamen Co. Ltd. - Overview
              • Exhibit 108: Austar Hearing Science and Technology Xiamen Co. Ltd. - Product / Service
              • Exhibit 109: Austar Hearing Science and Technology Xiamen Co. Ltd. - Key offerings
            • 12.4 Beurer GmbH
              • Exhibit 110: Beurer GmbH - Overview
              • Exhibit 111: Beurer GmbH - Product / Service
              • Exhibit 112: Beurer GmbH - Key offerings
            • 12.5 Cochlear Ltd.
              • Exhibit 113: Cochlear Ltd. - Overview
              • Exhibit 114: Cochlear Ltd. - Business segments
              • Exhibit 115: Cochlear Ltd. - Key offerings
              • Exhibit 116: Cochlear Ltd. - Segment focus
            • 12.6 Eargo Inc.
              • Exhibit 117: Eargo Inc. - Overview
              • Exhibit 118: Eargo Inc. - Product / Service
              • Exhibit 119: Eargo Inc. - Key offerings
            • 12.7 Foshan Vohom Technology Co. Ltd.
              • Exhibit 120: Foshan Vohom Technology Co. Ltd. - Overview
              • Exhibit 121: Foshan Vohom Technology Co. Ltd. - Product / Service
              • Exhibit 122: Foshan Vohom Technology Co. Ltd. - Key offerings
            • 12.8 GN Store Nord AS
              • Exhibit 123: GN Store Nord AS - Overview
              • Exhibit 124: GN Store Nord AS - Business segments
              • Exhibit 125: GN Store Nord AS - Key offerings
              • Exhibit 126: GN Store Nord AS - Segment focus
            • 12.9 Huizhou Jinghao Medical Technology Co. Ltd.
              • Exhibit 127: Huizhou Jinghao Medical Technology Co. Ltd. - Overview
              • Exhibit 128: Huizhou Jinghao Medical Technology Co. Ltd. - Product / Service
              • Exhibit 129: Huizhou Jinghao Medical Technology Co. Ltd. - Key offerings
            • 12.10 InnerScope Hearing Technologies Inc.
              • Exhibit 130: InnerScope Hearing Technologies Inc. - Overview
              • Exhibit 131: InnerScope Hearing Technologies Inc. - Product / Service
              • Exhibit 132: InnerScope Hearing Technologies Inc. - Key offerings
            • 12.11 Intricon Corp.
              • Exhibit 133: Intricon Corp. - Overview
              • Exhibit 134: Intricon Corp. - Product / Service
              • Exhibit 135: Intricon Corp. - Key offerings
            • 12.12 Lucid Hearing Holding Co. LLC
              • Exhibit 136: Lucid Hearing Holding Co. LLC - Overview
              • Exhibit 137: Lucid Hearing Holding Co. LLC - Product / Service
              • Exhibit 138: Lucid Hearing Holding Co. LLC - Key offerings
            • 12.13 MDHearingAid Inc.
              • Exhibit 139: MDHearingAid Inc. - Overview
              • Exhibit 140: MDHearingAid Inc. - Product / Service
              • Exhibit 141: MDHearingAid Inc. - Key offerings
            • 12.14 MEDca Hearing
              • Exhibit 142: MEDca Hearing - Overview
              • Exhibit 143: MEDca Hearing - Product / Service
              • Exhibit 144: MEDca Hearing - Key offerings
            • 12.15 Otofonix Hearing Solutions
              • Exhibit 145: Otofonix Hearing Solutions - Overview
              • Exhibit 146: Otofonix Hearing Solutions - Product / Service
              • Exhibit 147: Otofonix Hearing Solutions - Key offerings
            • 12.16 Sound World Solutions
              • Exhibit 148: Sound World Solutions - Overview
              • Exhibit 149: Sound World Solutions - Product / Service
              • Exhibit 150: Sound World Solutions - Key offerings
            • 12.17 Starkey Laboratories Inc.
              • Exhibit 151: Starkey Laboratories Inc. - Overview
              • Exhibit 152: Starkey Laboratories Inc. - Product / Service
              • Exhibit 153: Starkey Laboratories Inc. - Key offerings

            13 Appendix

            • 13.1 Scope of the report
              • 13.2 Inclusions and exclusions checklist
                • Exhibit 154: Inclusions checklist
                • Exhibit 155: Exclusions checklist
              • 13.3 Currency conversion rates for US$
                • Exhibit 156: Currency conversion rates for US$
              • 13.4 Research methodology
                • Exhibit 157: Research methodology
                • Exhibit 158: Validation techniques employed for market sizing
                • Exhibit 159: Information sources
              • 13.5 List of abbreviations
                • Exhibit 160: List of abbreviations

              Research Methodology

              Technavio presents a detailed picture of the market by way of study, synthesis, and summation of data from multiple sources. The analysts have presented the various facets of the market with a particular focus on identifying the key industry influencers. The data thus presented is comprehensive, reliable, and the result of extensive research, both primary and secondary.

              INFORMATION SOURCES

              Primary sources

              • Manufacturers and suppliers
              • Channel partners
              • Industry experts
              • Strategic decision makers

              Secondary sources

              • Industry journals and periodicals
              • Government data
              • Financial reports of key industry players
              • Historical data
              • Press releases

              DATA ANALYSIS

              Data Synthesis

              • Collation of data
              • Estimation of key figures
              • Analysis of derived insights

              Data Validation

              • Triangulation with data models
              • Reference against proprietary databases
              • Corroboration with industry experts

              REPORT WRITING

              Qualitative

              • Market drivers
              • Market challenges
              • Market trends
              • Five forces analysis

              Quantitative

              • Market size and forecast
              • Market segmentation
              • Geographical insights
              • Competitive landscape

              Interested in this report?

              Get your sample now to see our research methodology and insights!

              Download Now

              Frequently Asked Questions

              Hearing Amplifiers market growth will increase by $ 28.29 bn during 2024-2028 .

              The Hearing Amplifiers market is expected to grow at a CAGR of 5.66% during 2024-2028 .

              Hearing Amplifiers market is segmented by Distribution Channel( Offline, Online) Type( Behind-the-ear, In-the-ear, Asia, Rest of World (ROW))

              Austar Hearing Science and Technology Xiamen Co. Ltd., Beurer GmbH, Claratone, Cochlear Ltd., Demant AS, Eargo Inc., Foshan Vohom Technology Co. Ltd., GN Store Nord AS, Huizhou Jinghao Medical Technology Co. Ltd., InnerScope Hearing Technologies Inc., Intricon Corp., MDHearingAid Inc., MEDca Hearing, Otofonix Hearing Solutions, Sonova AG, Sound World Solutions, Starkey Laboratories Inc., WS Audiology AS, ZipHearing LLC, Lucid Hearing Holding Co. LLC are a few of the key vendors in the Hearing Amplifiers market.

              Europe will register the highest growth rate of 37% among the other regions. Therefore, the Hearing Amplifiers market in Europe is expected to garner significant business opportunities for the vendors during the forecast period.

              US, Germany, Italy, China, Japan

              • Global rise in number of patients with hearing lossThe incidence and prevalence of hearing loss are increasing significantly across geographies around the world. For instance is the driving factor this market.
              • according to the latest data provided by the Centers for Disease Control and Prevention (CDC) is the driving factor this market.
              • in June 2021 is the driving factor this market.
              • around 6 is the driving factor this market.
              • 000 infants in the US were born with permanent hearing loss. At present is the driving factor this market.
              • there has been an increase in the number of people with hearing impairment and related disorders. The global geriatric population is increasing is the driving factor this market.
              • leading to a rise in the prevalence of hearing impairments. This is the driving factor this market.
              • in turn is the driving factor this market.
              • increases the need for hearing amplifiers. Growing noise pollution across the world also has had a significant impact on the hearing ability of people. Genetic factors is the driving factor this market.
              • noise pollution is the driving factor this market.
              • trauma is the driving factor this market.
              • aging is the driving factor this market.
              • and bacterial infections are some of the causes of hearing impairment. Excessive noise pollution in heavy-duty industries also damages the hearing capacity of adults is the driving factor this market.
              • especially those employed in such industries. The practice of exposing the eardrum to loud music is another factor causing hearing problems among the younger generation. Loud noise during drilling and dismantling operations can lead to hearing problems for construction workers. People working in high-decibel environments such as airports or ordnance factories are also expected to suffer from hearing loss due to overexposure to loud noise. These are some factors that increase the chances of hearing loss among people is the driving factor this market.
              • which is the driving factor this market.
              • in turn is the driving factor this market.
              • is expected to foster the demand for hearing amplifiers during the forecast period. is the driving factor this market.

              The Hearing Amplifiers market vendors should focus on grabbing business opportunities from the Offline segment as it accounted for the largest market share in the base year.