High Purity Zinc Market Size 2025-2029
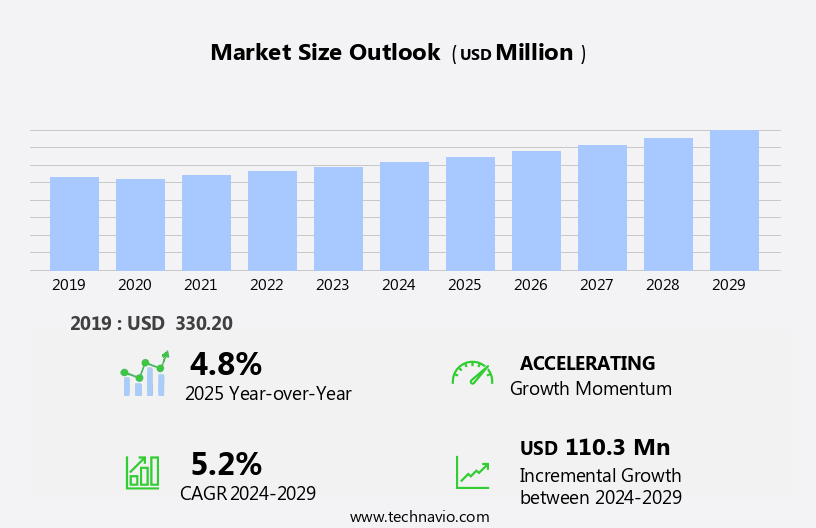
The high purity zinc market size is forecast to increase by USD 110.3 million at a CAGR of 5.2% between 2024 and 2029.
- The market is experiencing significant growth, driven primarily by the increasing demand for zinc in electronics and the semiconductor industries. This trend is attributed to the essential role of high purity zinc in the production of various electronic components, including batteries, capacitors, and semiconductor wafers. Furthermore, the continuous innovation in technology and the introduction of new high-tech products are fueling the market's expansion. However, the market is not without challenges. The volatility in zinc prices poses a significant risk to market participants, as price fluctuations can impact the profitability of businesses. The zinc market dynamics are influenced by reserves, price fluctuations, and exploration.
- Producers and consumers must navigate this challenge by implementing effective supply chain strategies and exploring alternative sources to mitigate price risks. Additionally, the market faces intense competition, with various players vying for market share. Companies seeking to capitalize on market opportunities must focus on innovation, cost competitiveness, and operational efficiency to stay ahead of the competition. Overall, the market presents significant growth potential for businesses that can effectively manage price risks and navigate the competitive landscape.
What will be the Size of the High Purity Zinc Market during the forecast period?
- Zinc-based materials, including alloys, cathodes, electroplating, and galvanizing, play a significant role in various industries. Zinc is utilized in electronics, agrochemicals, solar panels, cosmetics, telecommunications, automotive, construction, dietary supplements, and aerospace. Metallurgical grade zinc is refined through smelting and recycling to produce zinc-based composites, alloys, and coatings. Sustainability is a key trend in the zinc industry, with a focus on recycling and minimizing environmental impact.
- Zinc-based batteries, such as zinc-cadmium, zinc-mercury, zinc-iron, and zinc-based catalysts, sensors, nanomaterials, and catalysts, also contribute to the market. Overall, the zinc market is diverse and dynamic, driven by the demand for zinc-based products and technologies.
How is this High Purity Zinc Industry segmented?
The high purity zinc industry research report provides comprehensive data (region-wise segment analysis), with forecasts and estimates in "USD million" for the period 2025-2029, as well as historical data from 2019-2023 for the following segments.
- Grade Type
- Special high grade
- Super special high grade
- Application
- Electronics and semiconductors
- Alloys and specialty materials
- Batteries
- Pharmaceuticals and cosmetics
- Laboratory
- Geography
- North America
- US
- Canada
- Europe
- France
- Germany
- Spain
- UK
- APAC
- China
- India
- Japan
- South Korea
- North America
By Grade Type Insights
The special high grade segment is estimated to witness significant growth during the forecast period. Special high grade (SHG) zinc is the most widely utilized grade in the global high-purity zinc market. With a minimum purity level of 99.995%, this grade strikes a critical balance between high quality and cost-effectiveness, making it suitable for a broad range of industrial and commercial applications. It is a foundational material in sectors such as galvanizing, die casting, batteries, and chemical manufacturing. One of the primary uses of SHG zinc is in the galvanization of steel and iron, a process that enhances corrosion resistance and extends the lifespan of metal structures. This application is particularly important in construction, automotive manufacturing, shipbuilding, and infrastructure projects. The durability and anti-corrosive properties of zinc-coated steel make it essential in environments subject to moisture, chemicals, and temperature fluctuations. In addition to galvanizing, SHG zinc is extensively used in zinc-based die casting alloys.
These alloys are crucial for manufacturing lightweight, precision components for automotive parts, electronic housings, and consumer goods. SHG zinc is also used in the production of zinc oxide, zinc sulfate, and other chemical compounds employed in fertilizers, rubber, and pharmaceuticals. Its excellent electrical conductivity, mechanical strength, and resistance to oxidation make SHG zinc a preferred material for battery applications, particularly in alkaline and zinc-carbon batteries. Overall, SHG zinc plays a pivotal role in global industrial supply chains due to its reliable performance, wide availability, and versatile application, especially in regions undergoing rapid industrialization and infrastructure expansion.
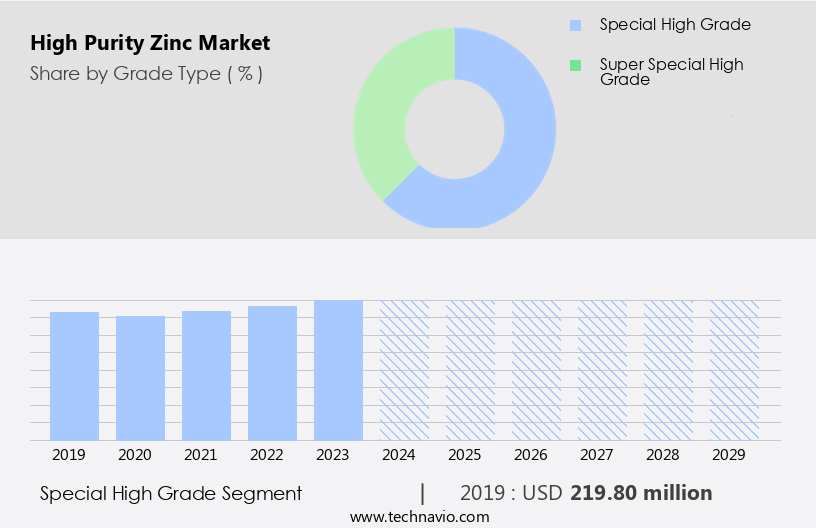
The Special high grade segment was valued at USD 219.80 million in 2019 and showed a gradual increase during the forecast period.
Regional Analysis
APAC is estimated to contribute 47% to the growth of the global market during the forecast period. Technavio's analysts have elaborately explained the regional trends and drivers that shape the market during the forecast period.
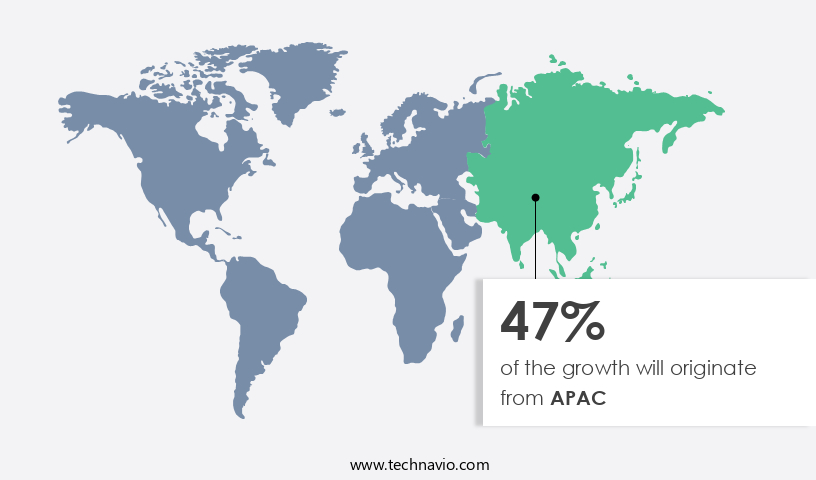
The global market for high purity zinc finds significant traction in the Asia-Pacific (APAC) region due to the region's thriving industrial sector and substantial investments in various industries. The automotive industry, in particular, contributes notably to the demand for high purity zinc. In 2023, Japan recorded a 17% increase in car production, totaling 7.5 million units, while China produced approximately 21 million units from January to September, marking a 2% year-on-year growth. South Korea's automotive sector also experienced a 13.5% expansion, producing around 4 million units in the same year. These statistics underscore the vibrant automotive sector in the APAC region, driving the demand for high purity zinc.
Zinc-based technologies, including zinc-tin batteries, zinc-carbon fuel cells, zinc-based coatings, zinc-air batteries, zinc-copper batteries, zinc-lithium batteries, zinc-aluminum batteries, zinc-graphene batteries, zinc-air fuel cells, and zinc chloride, play pivotal roles in diverse applications. For instance, zinc-tin batteries are integral components of solar-powered devices, while zinc-carbon fuel cells power electric vehicles. Zinc-based coatings offer corrosion protection, and zinc chloride is a critical component in various applications, such as flame retardants and explosives. The evolving trends in the market include advancements in zinc-based technologies, such as zinc-air fuel cells, which offer higher energy density and longer runtime compared to traditional zinc-carbon fuel cells.
Furthermore, the integration of zinc-based materials, such as zinc-graphene batteries, presents opportunities for improved energy storage and enhanced performance. In summary, the APAC region's industrial growth and automotive production increases fuel the demand for high purity zinc. The ongoing advancements in zinc-based technologies, such as zinc-air fuel cells and zinc-graphene batteries, present opportunities for innovation and growth in the market.
Market Dynamics
Our researchers analyzed the data with 2024 as the base year, along with the key drivers, trends, and challenges. A holistic analysis of drivers will help companies refine their marketing strategies to gain a competitive advantage.
What are the High Purity Zinc market drivers leading to the rise in the adoption of Industry?
- The significant growth in the demand for electronics and semiconductors serves as the primary market driver. The market is experiencing significant growth due to the increasing demand from the electronics and semiconductor industry. High purity zinc, refined to 99.995 percent or higher, is essential for producing advanced electronic components due to its superior electrical conductivity, low impurity levels, and corrosion resistance. This high-purity material is used in the manufacture of various electronic components such as diodes, transistors, capacitors, semiconductors, and printed circuit boards (PCBs), which require materials with high precision and reliability. With the ongoing trend towards miniaturization and high-performance standards in electronics, the need for ultra-pure materials like high purity zinc is becoming increasingly important.
- High purity zinc is utilized in various applications including zinc-tin batteries, zinc-carbon fuel cells, zinc-based coatings, zinc-air batteries, zinc-copper batteries, zinc-lithium batteries, zinc-aluminum batteries, zinc-graphene batteries, and zinc-air fuel cells. The versatility and superior properties of high purity zinc make it an indispensable component in numerous advanced technologies.
What are the High Purity Zinc market trends shaping the Industry?
- The introduction of new products is currently a significant market trend, reflecting a continuous drive for innovation and development within industries. The market is witnessing innovation and sustainability with the introduction of new products. For instance, on July 24, 2024, Hindustan Zinc, a leading global zinc producer, launched EcoZen, a low-carbon green zinc. This product, produced using renewable energy, has a carbon footprint 75% lower than the industry average. EcoZen is certified as low-carbon by a global sustainability firm and offers high-purity zinc for galvanizing steel, which is essential for sectors such as automotive, construction, infrastructure, and renewable energy.
- Hindustan Zinc's commitment to decarbonizing operations is reflected in EcoZen, providing customers with a competitive edge in reducing their supply chain emissions. The trend of introducing eco-friendly and high-purity zinc products underscores the industry's dedication to innovation and sustainability.
How does High Purity Zinc market faces challenges face during its growth?
- Zinc price volatility poses a significant challenge to the industry's growth trajectory. The market is influenced by the volatility in zinc prices, which poses a significant challenge for manufacturers and end-users. In 2024, zinc prices underwent considerable fluctuations, with an initial wave due to supply concerns and decreasing mine outputs. The London Metal Exchange (LME) reported a 13 percent increase in zinc prices, rising from USD 2,621 per metric ton to USD 2,979 by the year-end. This upward trend was attributed to a 3 percent decline in global zinc mine output, marking its lowest level since the global financial crisis. The price volatility can have far-reaching implications for the market.
- Manufacturers and consumers face increased uncertainty in cost planning and budgeting, which can negatively impact their operational efficiency and profitability. Applications of high purity zinc in industries such as zinc-silver oxide batteries, zinc anodes, zinc-lead batteries, zinc-carbon batteries, zinc oxide, zinc-based composites, zinc-titanium batteries, and zinc-nickel-cadmium batteries, as well as in zinc-metal fuel cells, are affected by such price fluctuations.
Exclusive Customer Landscape
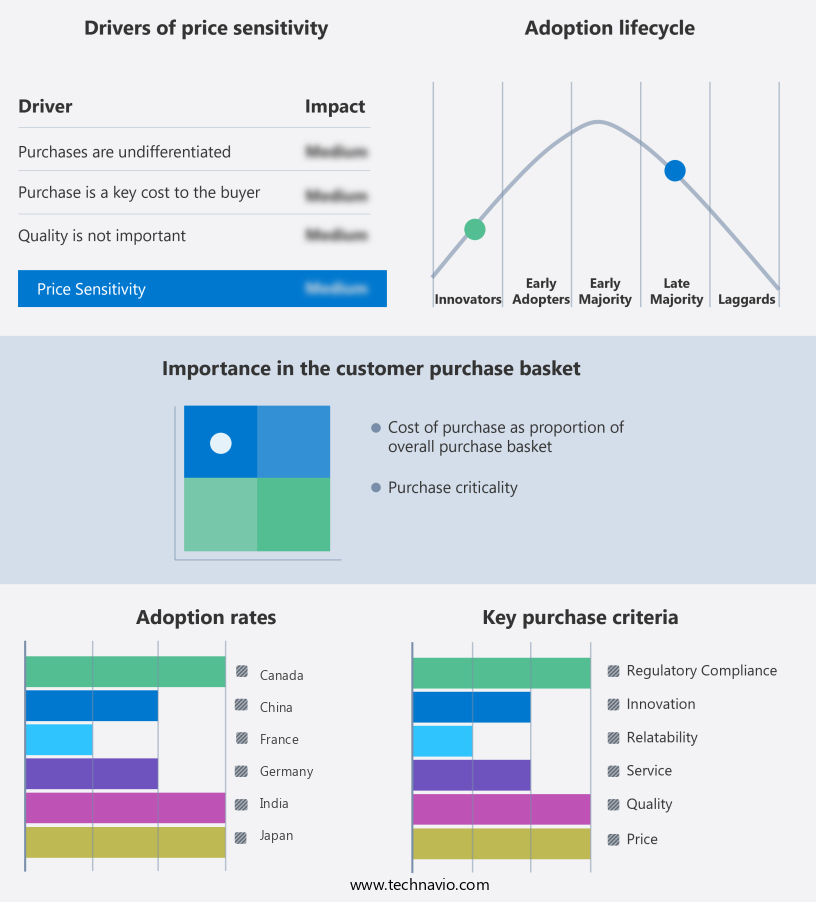
The high purity zinc market forecasting report includes the adoption lifecycle of the market, covering from the innovator's stage to the laggard's stage. It focuses on adoption rates in different regions based on penetration. Furthermore, the high purity zinc market report also includes key purchase criteria and drivers of price sensitivity to help companies evaluate and develop their market growth analysis strategies.
Customer Landscape
Key Companies & Market Insights
Companies are implementing various strategies, such as strategic alliances, high purity zinc market forecast, partnerships, mergers and acquisitions, geographical expansion, and product/service launches, to enhance their presence in the industry.
Boliden Group - The company offers high purity zinc which is used in various types of batteries, including zinc-carbon and zinc-air batteries.
The industry research and growth report includes detailed analyses of the competitive landscape of the market and information about key companies, including:
- Boliden Group
- China Minmetals Corp.
- Dowa Holdings Co. Ltd.
- Glencore Plc
- Henan Yuguang Zinc Industry Co. Ltd
- Hindustan Zinc Ltd.
- Jiangxi Copper Corp
- Korea Zinc Co. Ltd
- MITSUI MINING and SMELTING CO. LTD.
- Nexa Resources SA
- Nyrstar
- Roy Gostar Jam Co
- Shijiazhuang Zhongli zinc Co. Ltd.
- Teck Resources Ltd.
- Yunnan Chihong Zinc and Germanium Co. Ltd
Qualitative and quantitative analysis of companies has been conducted to help clients understand the wider business environment as well as the strengths and weaknesses of key industry players. Data is qualitatively analyzed to categorize companies as pure play, category-focused, industry-focused, and diversified; it is quantitatively analyzed to categorize companies as dominant, leading, strong, tentative, and weak.
Recent Development and News in High Purity Zinc Market
- In Q1 2025, Nippon Light Metal Co. Ltd. Announced the expansion of its high purity zinc production capacity by 10,000 tons per annum at its Himeji Works in Japan. This expansion aimed to cater to the increasing demand for high purity zinc in the electronics industry (Technavio, 2025).
- In Q3 2024, HZ Metals, a leading global producer of high purity zinc, entered into a technological collaboration with the University of Minnesota to develop a new process for producing high purity zinc using recycled materials. This collaboration was expected to reduce the environmental impact of zinc production and lower costs (HZ Metals Press Release, 2024).
- In H1 2024, Hunan Zhongjiang Nonferrous Metals Co. Ltd. acquired a 70% stake in Jiangxi Zhongyang New Materials Co. Ltd., a Chinese high purity zinc producer. This acquisition aimed to strengthen Hunan Zhongjiang's position in the market and expand its geographic reach (Technavio, 2024).
- In Q4 2023, Umicore, a global materials technology and recycling group, launched its new high purity zinc product, Zinc Alloy 99.9995. This product catered to the increasing demand for high purity zinc in the semiconductor industry and set a new industry benchmark for purity levels (Umicore Press Release, 2023). These developments demonstrate the ongoing innovation and competition in the market, driven by technological advancements, strategic collaborations, and expanding production capacities.
Research Analyst Overview
The market is characterized by its dynamic nature, with ongoing developments and advancements shaping the industry landscape. This market encompasses a diverse range of applications, from zinc alloys and zinc cathodes to zinc-based products such as galvanizing, electroplating, and batteries. Zinc alloys, with their unique properties, are increasingly being adopted in various industries. These alloys are finding significant use in automotive, construction, and electrical applications due to their strength, durability, and corrosion resistance. Zinc cathodes, a critical component in electroplating processes, are essential for enhancing the protective coating on various substrates. The demand for zinc-based products continues to grow, driven by their versatility and utility.
StartFragment The High Purity Zinc Market is thriving, driven by advancements in zinc refining, electrolytic zinc production, and innovations in zinc smelting. Applications such as zinc-based pharmaceuticals, zinc-based dietary supplements, zinc-based cosmetics, and zinc-based agrochemicals dominate the sector, highlighting versatility. The demand for zinc-based alloys, zinc-based nanomaterials, and solutions for zinc-based applications in construction, automotive, aerospace, and telecommunications underline its wide-ranging impact. Key trends include zinc recovery, zinc recycling, and a focus on zinc sustainability, addressing environmental priorities. Industry challenges like zinc price fluctuations and optimizing the zinc supply chain are met through strategic innovation. Enhanced zinc-based solar panels, LED lighting, sensors, and electronics reflect growing adoption across technological advancements. Increased attention to zinc resources, zinc reserves, and zinc exploration propels continued market evolution
Zinc-based composites, for example, are being explored for their potential in the automotive and construction industries due to their superior strength and durability. Zinc-based materials, such as zinc dust and zinc pellets, are finding use in various applications, including as catalysts and pigments. The ongoing research and development efforts are aimed at improving the performance, efficiency, and sustainability of zinc-based products and technologies. The integration of advanced materials, such as graphene and nanomaterials, is expected to lead to significant advancements in the zinc market. The market is a dynamic and evolving landscape, with ongoing developments and innovations shaping its future. The diverse range of applications, from zinc alloys and zinc-based products to batteries and coatings, is driving the growth and demand for high purity zinc. The continuous pursuit of improved performance, efficiency, and sustainability is expected to further fuel the growth of this market.
Dive into Technavio's strong research methodology, blending expert interviews, extensive data synthesis, and validated models for unparalleled High Purity Zinc Market insights. See full methodology.
|
Market Scope |
|
|
Report Coverage |
Details |
|
Page number |
0 |
|
Base year |
2024 |
|
Historic period |
2019-2023 |
|
Forecast period |
2025-2029 |
|
Growth momentum & CAGR |
Accelerate at a CAGR of 5.2% |
|
Market growth 2025-2029 |
USD 110.3 million |
|
Market structure |
Fragmented |
|
YoY growth 2024-2025(%) |
4.8 |
|
Key countries |
US, China, Japan, India, Germany, UK, South Korea, Canada, France, and Spain |
|
Competitive landscape |
Leading Companies, Market Positioning of Companies, Competitive Strategies, and Industry Risks |
What are the Key Data Covered in this High Purity Zinc Market Research and Growth Report?
- CAGR of the High Purity Zinc industry during the forecast period
- Detailed information on factors that will drive the growth and forecasting between 2025 and 2029
- Precise estimation of the size of the market and its contribution of the industry in focus to the parent market
- Accurate predictions about upcoming growth and trends and changes in consumer behaviour
- Growth of the market across APAC, North America, Europe, South America, and Middle East and Africa
- Thorough analysis of the market's competitive landscape and detailed information about companies
- Comprehensive analysis of factors that will challenge the high purity zinc market growth and forecasting
We can help! Our analysts can customize this high purity zinc market research report to meet your requirements.
 RIA -
RIA - 
