High Voltage Equipment Market Analysis APAC, Europe, North America, South America, Middle East and Africa - US, China, India, Germany, UK - Size and Forecast 2024-2028

High Voltage Equipment Market Analysis APAC, Europe, North America, South America, Middle East and Africa - US, China, India, Germany, UK - Size and Forecast 2024-2028

Published: Mar 2024 179 Pages SKU: IRTNTR77799

Market Overview at a Glance

$50.38 B
Market Opportunity
7.45%
CAGR
7.25
YoY growth 2023-2024(%)

High Voltage Equipment Market Size 2024-2028

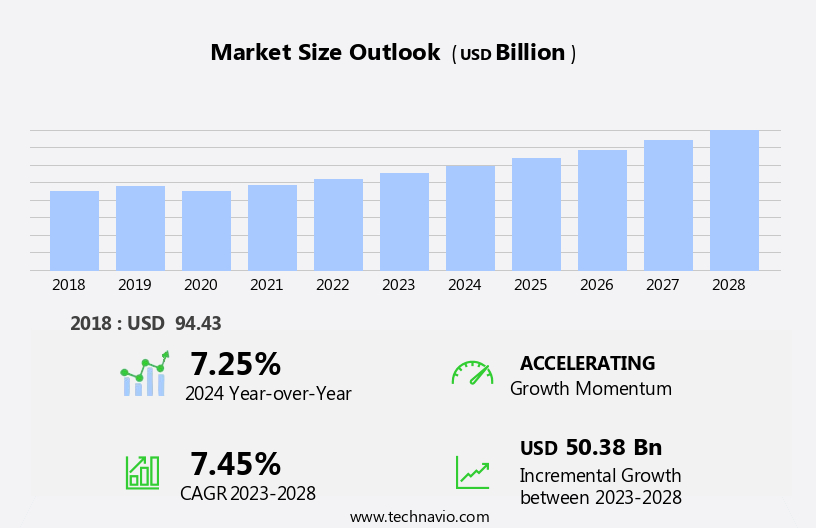
The high voltage equipment market size is forecast to increase by USD 50.38 billion at a CAGR of 7.45% between 2023 and 2028.

  • The market is experiencing significant growth due to increasing power demands from various sectors, including residential, industrial, and commercial. The evolution of smart grids is another key trend driving market expansion. Strict environmental regulations are also influencing the manufacturing of high-voltage equipment, leading to advancements in energy efficiency and sustainable production methods. These factors contribute to the market's continued growth and innovation. Additionally, the increasing adoption of renewable energy sources and the need for reliable and efficient power transmission systems further bolster market prospects. Overall, the market is poised for continued expansion as it addresses the evolving power needs of modern societies.
  • What will be the Size of the High Voltage Equipment Market During the Forecast Period?

    High Voltage Equipment Market Size

     Request Free Sample

  • The market encompasses a range of technologies essential to the generation, transmission, and measurement of electricity In the energy sector. Key market drivers include the expansion of renewable energy farms, such as solar and wind, in remote areas, and the need for reliable power transmission through transmission grids. High-voltage measuring equipment plays a critical role in electricity measurement and monitoring systems, ensuring energy efficiency and carbon emissions reduction. Substations, transformers, metal clad switchgear, and generators are integral components of the electric power system, facilitating the conversion, distribution, and restoration of power. In the context of grid modernization projects and smart grid integration, high-voltage equipment is increasingly utilized in laboratories and mobile substations to optimize energy infrastructure and improve power transmission.
  • Insulating materials and advanced monitoring systems are also vital for enhancing the performance and safety of high-voltage equipment in various applications.
  • How is this High Voltage Equipment Industry segmented and which is the largest segment?

    The high voltage equipment industry research report provides comprehensive data (region-wise segment analysis), with forecasts and estimates in "USD billion" for the period 2024-2028, as well as historical data from 2018-2022 for the following segments.

    • Application
      • Power transmission
      • Power distribution
    • Type
      • Transformer
      • Switchgear
      • Reactive power equipment
      • Relay panel
      • Others
    • Geography
      • APAC
        • China
        • India
      • Europe
        • Germany
        • UK
      • North America
        • US
      • South America
        • Middle East and Africa

        By Application Insights

        • The power transmission segment is estimated to witness significant growth during the forecast period.

        The market is experiencing notable growth due to several influential factors. The expanding industrialization and population growth necessitate increased electricity consumption, leading to the demand for efficient power transmission systems. High-voltage equipment, comprising transformers, circuit breakers, and switchgear, plays a pivotal role in facilitating the reliable and efficient transfer of electrical energy over extended distances. Furthermore, the integration of renewable energy sources, such as wind and solar power, into the grid necessitates robust high-voltage equipment to manage their intermittent nature. As countries prioritize transitioning to cleaner energy solutions, the demand for high-voltage equipment to support renewable energy integration continues to escalate.

        This trend is particularly significant In the context of the power transmission segment, which is poised for substantial growth In the coming years.

        High Voltage Equipment Market Size

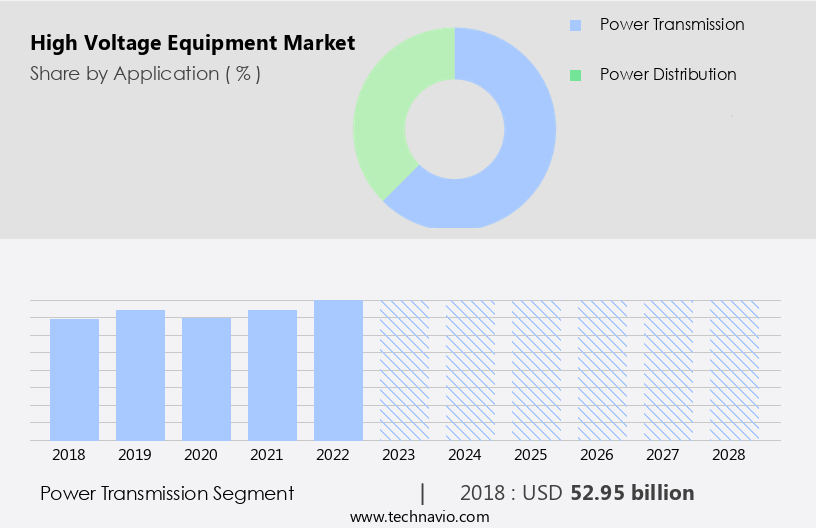
        Get a glance at the  High Voltage Equipment Industry report of share of various segments Request Free Sample

        The Power transmission segment was valued at USD 52.95 billion in 2018 and showed a gradual increase during the forecast period.
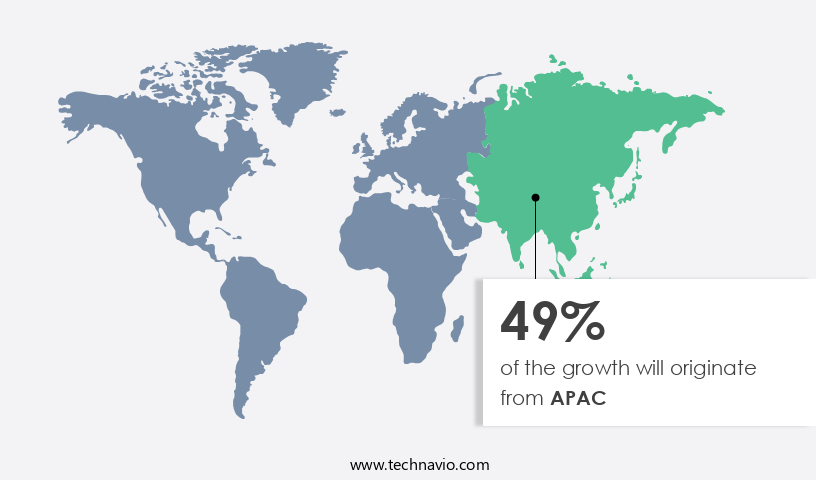
        Regional Analysis

        • APAC is estimated to contribute 49% to the growth of the global market during the forecast period.

        Technavio’s analysts have elaborately explained the regional trends and drivers that shape the market during the forecast period.

        High Voltage Equipment Market Share by Geography

        For more insights on the market share of various regions, Request Free Sample

        The Asia Pacific (APAC) region experiences significant electricity demand due to the expansion of electricity-consuming sectors and increasing urban population. Countries In the area are attracting private investments to meet the growing electricity needs, driven by rising standards of living and industrialization. China holds a substantial market share in APAC's high-voltage equipment sector. The region's population growth and urbanization, along with government initiatives for rural electrification, fuel the demand for electricity. High-voltage equipment plays a crucial role in power generation, transmission, and distribution, including solar and wind energy farms, transmission grids, electricity measurement, and electricity supply to various sectors such as commercial vehicles, heavy machinery, and uninterrupted power supplies.

        Key applications include transformers, circuit breakers, switchgears, and various control equipment. The market is influenced by factors like economic uncertainty, capital expenditures, and the need for grid modernization and energy efficiency.

        Market Dynamics

        Our  researchers analyzed the data with 2023 as the base year, along with the key drivers, trends, and challenges. A holistic analysis of drivers will help companies refine their marketing strategies to gain a competitive advantage.

        What are the key market drivers leading to the rise In the adoption of High Voltage Equipment Industry?

        Rising requirements for power from residential, industrial, and commercial sectors is the key driver of the market.

      • The global high-voltage equipment market is experiencing significant growth due to the increasing energy demand and industrialization expansion in various parts of the world. In remote areas, renewable energy sources such as solar and wind energy farms are becoming increasingly popular, leading to the requirement for high-voltage equipment like transformers and substations for electricity measurement, production automation, and power transmission. The transmission grids are being upgraded to handle the increasing electric currents and distribute electricity more efficiently. Laboratories and manufacturing facilities are also investing in high-voltage equipment for power generation, production automation, and robotics. The adoption of electric cars and the shift towards energy independence are also driving the demand for energy storage systems and smart grid technologies.
      • Economic uncertainty and capital expenditures are major factors influencing the investment in high-voltage equipment. The aging power grids in many parts of the world present operational limitations, and smart grid technologies such as real-time monitoring, optimization, and distribution sector upgrades are being implemented to address these challenges. Smart meters, charging infrastructure, and EV charging stations are becoming essential components of the electrical power system. Companies like ABB, Sungrow, and others are leading the renewable energy initiative with innovative high-voltage equipment solutions. Despite the challenges, the high-voltage equipment market is expected to grow significantly due to the increasing electricity consumption, the need for emission reduction, and the digitization of industrial operations.
      • The market is also witnessing the development of compact metal-enclosed switchgear, transformers, circuit breakers, switchgears, and other advanced technologies to improve energy efficiency and grid modernization projects. Energy infrastructure and grid modernization activities are essential for meeting the growing energy demands while ensuring uninterrupted power supplies to various sectors, including mining, infrastructure projects, and commercial vehicles such as buses, trucks, and heavy machinery. Electromagnetic fields, insulating materials, and smart grid integration are some of the critical areas of focus In the high-voltage equipment market. Safety norms and voltage level considerations are essential factors In the design and implementation of high-voltage equipment.
      • The market is also witnessing the development of advanced technologies such as surge arresters, insulators, disconnect switches, fuses, and disconnectors to address the operational challenges and ensure the reliability and efficiency of power distribution networks. In conclusion, the high-voltage equipment market is poised for significant growth due to the increasing energy demand, industrialization expansion, and the need for energy efficiency and grid modernization. Companies In the electrical industry are investing in advanced technologies and innovations to address the operational challenges and meet the evolving energy infrastructure needs. The market is expected to witness significant growth In the coming years, driven by the increasing adoption of renewable energy sources, energy storage systems, and smart grid technologies.
      • What are the market trends shaping the High Voltage Equipment Industry?

        Evolution of smart grids is the upcoming market trend.

      • High-voltage equipment is a crucial element In the development and operation of smart grids, which represent the next generation of electrical power systems. Smart grids utilize advanced technologies such as sensors, communication systems, and automation to optimize power distribution and ensure energy efficiency. High-voltage transformers, circuit breakers, and other components are integral to this infrastructure, enabling the transmission and distribution of electricity at increased voltage levels. Real-time data monitoring and analytics are a significant focus In the evolution of smart grids. High-voltage equipment, including transformers, circuit breakers, and switchgears, plays a vital role in this area by facilitating the accurate measurement and management of electric currents and voltages.
      • The integration of energy storage systems, such as batteries and pumped hydro storage, further enhances the capabilities of smart grids, allowing for the efficient management of renewable energy sources like solar and wind power. Major players In the high-voltage equipment market include Sungrow, ABB, and Siemens, among others. These companies are investing heavily in research and development to create more advanced and efficient solutions for the smart grid sector. The growing demand for electricity, driven by population growth and industrialization, is expected to drive capital expenditures In the high-voltage equipment market. However, economic uncertainty and the high installation and maintenance costs of high-voltage equipment may pose challenges to market growth.
      • The adoption of smart grids is essential for achieving energy independence and reducing carbon emissions In the oil-intensive sector. The integration of renewable energy sources, such as solar, wind, and hydropower, into the electricity transmission and distribution networks is a key aspect of this transition. The deployment of energy storage systems, including batteries and capacitors, is also crucial for ensuring the stability and reliability of the smart grid infrastructure. In conclusion, the high-voltage equipment market is experiencing significant growth due to the increasing adoption of smart grids and the shift towards renewable energy sources. The integration of advanced technologies, such as real-time monitoring and optimization, is essential for enhancing the efficiency and reliability of power transmission and distribution.
      • Despite challenges, such as high installation and maintenance costs, the market is expected to continue growing due to the pressing need for more sustainable and efficient energy solutions.
      • What challenges does the High Voltage Equipment Industry face during its growth?

        Stringent environmental regulations associated with manufacturing of high-voltage equipment is a key challenge affecting the industry growth.

      • The market is experiencing significant growth due to various factors, including the increasing energy consumption and the shift towards renewable energy sources. According to Statista Research Department, global electricity consumption is projected to reach approximately 28,000 Terawatt-hours by 2025, driven by population growth and industrialization expansion. Renewable energy sources, such as solar energy farms and wind energy farms, are becoming increasingly important in meeting this growing demand for electricity. In remote areas, high voltage equipment plays a crucial role in transmitting electricity over long distances through transmission grids. Solar power plants and wind power farms require high voltage equipment for electricity measurement, energy storage, and power transmission.
      • Companies like Sungrow and Huanghe Hydropower Development are leading the way in renewable energy initiatives, developing advanced high voltage equipment solutions. Smart grid technologies, such as real-time monitoring, optimization, and distribution sector automation, are also driving the growth of the market. Smart meters, charging infrastructure, and EV charging stations require high voltage equipment for their operation. Companies like ABB and Siemens are investing heavily in energy storage systems, batteries, and pumped hydro storage to support the deployment of electric vehicles (EVs) and other renewable energy applications. Economic uncertainty and capital expenditures are key challenges facing the market. Outdated infrastructure and operational limitations In the transmission and distribution sectors can limit the growth of the market.
      • Safety norms and voltage level considerations are also important factors In the design and installation of high voltage equipment. Companies are focusing on developing compact metal-enclosed switchgear, voltage level transformers, and other high-voltage equipment solutions to address these challenges. In conclusion, The market is experiencing significant growth due to the increasing demand for electricity, the shift towards renewable energy sources, and the adoption of smart grid technologies. Environmental regulations, such as those targeting the reduction of greenhouse gas emissions, are also driving the development of more efficient and sustainable high voltage equipment solutions. Companies are investing in research and development, as well as In the deployment of energy storage systems and other advanced technologies, to meet the growing demand for high voltage equipment and support the transition to a more sustainable energy future.
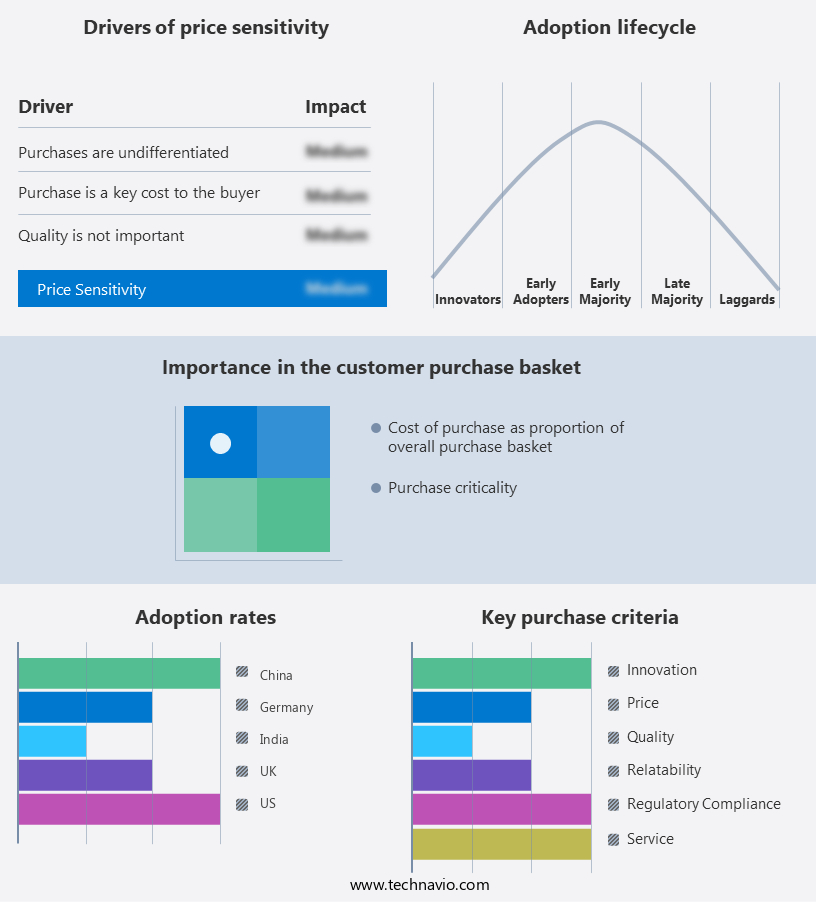
      • Exclusive Customer Landscape

        The high voltage equipment market forecasting report includes the adoption lifecycle of the market, covering from the innovator’s stage to the laggard’s stage. It focuses on adoption rates in different regions based on penetration. Furthermore, the high voltage equipment market report also includes key purchase criteria and drivers of price sensitivity to help companies evaluate and develop their market growth analysis strategies.

        High Voltage Equipment Market Share by Geography

         Customer Landscape

        Key Companies & Market Insights

        Companies are implementing various strategies, such as strategic alliances, high voltage equipment market forecast, partnerships, mergers and acquisitions, geographical expansion, and product/service launches, to enhance their presence In the industry.

        ABB Ltd. - The company specializes in providing high-voltage equipment solutions, encompassing switchgear and breakers capable of handling voltages up to 1200 kV AC and 1100 kV DC. This equipment caters to the power industry's demands for reliable and efficient energy transmission and distribution. The company's offerings adhere to stringent safety and performance standards, ensuring optimal system performance and minimal downtime. With a focus on innovation and technological advancements, the company's solutions contribute to enhancing the overall efficiency and sustainability of power systems.

        The industry research and growth report includes detailed analyses of the competitive landscape of the market and information about key companies, including:

        • ABB Ltd.
        • ALSTOM SA
        • Bharat Heavy Electricals Ltd.
        • CG Power and Industrial Solutions Ltd.
        • DuPont de Nemours Inc.
        • Eaton Corp. Plc
        • Emerson Electric Co.
        • ETEL TRANSFORMERS PTY LTD.
        • Fuji Electric Co. Ltd.
        • General Electric Co.
        • Hitachi Ltd.
        • Honeywell International Inc.
        • Hubbell Inc.
        • Hyundai Electric and Energy Systems Co. Ltd.
        • Mitsubishi Electric Corp.
        • Schneider Electric SE
        • Siemens AG
        • Sumitomo Electric Industries Ltd.
        • TBEA Co. Ltd.
        • Toshiba Corp.

        Qualitative and quantitative analysis of companies has been conducted to help clients understand the wider business environment as well as the strengths and weaknesses of key industry players. Data is qualitatively analyzed to categorize companies as pure play, category-focused, industry-focused, and diversified; it is quantitatively analyzed to categorize companies as dominant, leading, strong, tentative, and weak.

        Research Analyst Overview

        The market encompasses a wide range of technologies and applications withIn the electrical power industry. This sector plays a crucial role In the transmission and distribution of electricity, enabling the efficient transfer of power from generation sources to end-users. High voltage equipment is essential for various applications, including power generation, transmission grids, and electricity measurement. These systems facilitate the conversion, measurement, and control of electric currents to ensure the reliable and efficient delivery of electricity. Substations, transformers, circuit breakers, switchgears, and various control and protection devices are key components of this market. The growth of high voltage equipment is influenced by several factors, including industrialization expansion, economic uncertainty, and accessibility to electricity.

        The increasing global population and the expansion of renewable energy sources, such as solar power, wind power, and hydropower, have led to a surge in electricity consumption and the need for advanced transmission and distribution systems. The aging power grids in many parts of the world necessitate modernization activities to address operational limitations, safety norms, and voltage level concerns. Smart grid technologies, such as real-time monitoring, optimization, and distribution sector automation, are increasingly being adopted to enhance the efficiency and reliability of electricity supply. Investment in high voltage equipment is driven by the need for energy storage systems, including batteries and pumped hydro storage, to ensure uninterrupted power supplies and support the integration of renewable energy sources into the grid.

        The adoption of electric vehicles (EVs) and the expansion of charging infrastructure also contribute to the growth of this market. The market is diverse, with applications ranging from low voltage applications in commercial and residential settings to high voltage applications in industrial processes, transportation, and mining. The electrical industry continues to evolve, with digitization and electrified industrial operations driving innovation in this sector. The use of high voltage equipment in power generation and transmission also has environmental implications, as the reduction of carbon emissions is a key focus for many governments and industries. Renewable energy systems, such as solar energy and wind energy, are increasingly being integrated into the grid to support emission reduction efforts.

        In conclusion, the market plays a vital role In the electrical power industry, enabling the efficient and reliable transmission and distribution of electricity. The market is driven by various factors, including industrialization expansion, renewable energy sources, and grid modernization activities. The ongoing evolution of the electrical industry and the integration of smart grid technologies are expected to continue shaping the growth of this market.

        Market Scope

        Report Coverage

        Details

        Page number

        179

        Base year

        2023

        Historic period

        2018-2022

        Forecast period

        2024-2028

        Growth momentum & CAGR

        Accelerate at a CAGR of 7.45%

        Market growth 2024-2028

        USD 50.38 billion

        Market structure

        Fragmented

        YoY growth 2023-2024(%)

        7.25

        Key countries

        US, China, India, Germany, and UK

        Competitive landscape

        Leading Companies, Market Positioning of Companies, Competitive Strategies, and Industry Risks

        Request Free Sample

        What are the Key Data Covered in this High Voltage Equipment Market Research and Growth Report?

        • CAGR of the High Voltage Equipment industry during the forecast period
        • Detailed information on factors that will drive the growth and forecasting between 2024 and 2028
        • Precise estimation of the size of the market and its contribution of the industry in focus to the parent market
        • Accurate predictions about upcoming growth and trends and changes in consumer behaviour
        • Growth of the market across APAC, Europe, North America, South America, and Middle East and Africa
        • Thorough analysis of the market’s competitive landscape and detailed information about companies
        • Comprehensive analysis of factors that will challenge the high voltage equipment market growth of industry companies

        We can help! Our analysts can customize this high voltage equipment market research report to meet your requirements.

        Get in touch


        1 Executive Summary

        • 1.1 Market overview
          • Exhibit 01: Executive Summary – Chart on Market Overview
          • Exhibit 02: Executive Summary – Data Table on Market Overview
          • Exhibit 03: Executive Summary – Chart on Global Market Characteristics
          • Exhibit 04: Executive Summary – Chart on Market by Geography
          • Exhibit 05: Executive Summary – Chart on Market Segmentation by Application
          • Exhibit 06: Executive Summary – Chart on Market Segmentation by Type
          • Exhibit 07: Executive Summary – Chart on Incremental Growth
          • Exhibit 08: Executive Summary – Data Table on Incremental Growth
          • Exhibit 09: Executive Summary – Chart on Vendor Market Positioning

        2 Market Landscape

        • 2.1 Market ecosystem
          • Exhibit 10: Parent market
          • Exhibit 11: Market Characteristics

        3 Market Sizing

        • 3.1 Market definition
          • Exhibit 12: Offerings of vendors included in the market definition
        • 3.2 Market segment analysis
          • Exhibit 13: Market segments
        • 3.3 Market size 2023
          • 3.4 Market outlook: Forecast for 2023-2028
            • Exhibit 14: Chart on Global - Market size and forecast 2023-2028 ($ billion)
            • Exhibit 15: Data Table on Global - Market size and forecast 2023-2028 ($ billion)
            • Exhibit 16: Chart on Global Market: Year-over-year growth 2023-2028 (%)
            • Exhibit 17: Data Table on Global Market: Year-over-year growth 2023-2028 (%)

          4 Historic Market Size

          • 4.1 Global high voltage equipment market 2018 - 2022
            • Exhibit 18: Historic Market Size – Data Table on global high voltage equipment market 2018 - 2022 ($ billion)
          • 4.2 Application Segment Analysis 2018 - 2022
            • Exhibit 19: Historic Market Size – Application Segment 2018 - 2022 ($ billion)
          • 4.3 Type Segment Analysis 2018 - 2022
            • Exhibit 20: Historic Market Size – Type Segment 2018 - 2022 ($ billion)
          • 4.4 Geography Segment Analysis 2018 - 2022
            • Exhibit 21: Historic Market Size – Geography Segment 2018 - 2022 ($ billion)
          • 4.5 Country Segment Analysis 2018 - 2022
            • Exhibit 22: Historic Market Size – Country Segment 2018 - 2022 ($ billion)

          5 Five Forces Analysis

          • 5.1 Five forces summary
            • Exhibit 23: Five forces analysis - Comparison between 2023 and 2028
          • 5.2 Bargaining power of buyers
            • Exhibit 24: Chart on Bargaining power of buyers – Impact of key factors 2023 and 2028
          • 5.3 Bargaining power of suppliers
            • Exhibit 25: Bargaining power of suppliers – Impact of key factors in 2023 and 2028
          • 5.4 Threat of new entrants
            • Exhibit 26: Threat of new entrants – Impact of key factors in 2023 and 2028
          • 5.5 Threat of substitutes
            • Exhibit 27: Threat of substitutes – Impact of key factors in 2023 and 2028
          • 5.6 Threat of rivalry
            • Exhibit 28: Threat of rivalry – Impact of key factors in 2023 and 2028
          • 5.7 Market condition
            • Exhibit 29: Chart on Market condition - Five forces 2023 and 2028

          6 Market Segmentation by Application

          • 6.1 Market segments
            • Exhibit 30: Chart on Application - Market share 2023-2028 (%)
            • Exhibit 31: Data Table on Application - Market share 2023-2028 (%)
          • 6.2 Comparison by Application
            • Exhibit 32: Chart on Comparison by Application
            • Exhibit 33: Data Table on Comparison by Application
          • 6.3 Power transmission - Market size and forecast 2023-2028
            • Exhibit 34: Chart on Power transmission - Market size and forecast 2023-2028 ($ billion)
            • Exhibit 35: Data Table on Power transmission - Market size and forecast 2023-2028 ($ billion)
            • Exhibit 36: Chart on Power transmission - Year-over-year growth 2023-2028 (%)
            • Exhibit 37: Data Table on Power transmission - Year-over-year growth 2023-2028 (%)
          • 6.4 Power distribution - Market size and forecast 2023-2028
            • Exhibit 38: Chart on Power distribution - Market size and forecast 2023-2028 ($ billion)
            • Exhibit 39: Data Table on Power distribution - Market size and forecast 2023-2028 ($ billion)
            • Exhibit 40: Chart on Power distribution - Year-over-year growth 2023-2028 (%)
            • Exhibit 41: Data Table on Power distribution - Year-over-year growth 2023-2028 (%)
          • 6.5 Market opportunity by Application
            • Exhibit 42: Market opportunity by Application ($ billion)
            • Exhibit 43: Data Table on Market opportunity by Application ($ billion)

          7 Market Segmentation by Type

          • 7.1 Market segments
            • Exhibit 44: Chart on Type - Market share 2023-2028 (%)
            • Exhibit 45: Data Table on Type - Market share 2023-2028 (%)
          • 7.2 Comparison by Type
            • Exhibit 46: Chart on Comparison by Type
            • Exhibit 47: Data Table on Comparison by Type
          • 7.3 Transformer - Market size and forecast 2023-2028
            • Exhibit 48: Chart on Transformer - Market size and forecast 2023-2028 ($ billion)
            • Exhibit 49: Data Table on Transformer - Market size and forecast 2023-2028 ($ billion)
            • Exhibit 50: Chart on Transformer - Year-over-year growth 2023-2028 (%)
            • Exhibit 51: Data Table on Transformer - Year-over-year growth 2023-2028 (%)
          • 7.4 Switchgear - Market size and forecast 2023-2028
            • Exhibit 52: Chart on Switchgear - Market size and forecast 2023-2028 ($ billion)
            • Exhibit 53: Data Table on Switchgear - Market size and forecast 2023-2028 ($ billion)
            • Exhibit 54: Chart on Switchgear - Year-over-year growth 2023-2028 (%)
            • Exhibit 55: Data Table on Switchgear - Year-over-year growth 2023-2028 (%)
          • 7.5 Reactive power equipment - Market size and forecast 2023-2028
            • Exhibit 56: Chart on Reactive power equipment - Market size and forecast 2023-2028 ($ billion)
            • Exhibit 57: Data Table on Reactive power equipment - Market size and forecast 2023-2028 ($ billion)
            • Exhibit 58: Chart on Reactive power equipment - Year-over-year growth 2023-2028 (%)
            • Exhibit 59: Data Table on Reactive power equipment - Year-over-year growth 2023-2028 (%)
          • 7.6 Relay panel - Market size and forecast 2023-2028
            • Exhibit 60: Chart on Relay panel - Market size and forecast 2023-2028 ($ billion)
            • Exhibit 61: Data Table on Relay panel - Market size and forecast 2023-2028 ($ billion)
            • Exhibit 62: Chart on Relay panel - Year-over-year growth 2023-2028 (%)
            • Exhibit 63: Data Table on Relay panel - Year-over-year growth 2023-2028 (%)
          • 7.7 Others - Market size and forecast 2023-2028
            • Exhibit 64: Chart on Others - Market size and forecast 2023-2028 ($ billion)
            • Exhibit 65: Data Table on Others - Market size and forecast 2023-2028 ($ billion)
            • Exhibit 66: Chart on Others - Year-over-year growth 2023-2028 (%)
            • Exhibit 67: Data Table on Others - Year-over-year growth 2023-2028 (%)
          • 7.8 Market opportunity by Type
            • Exhibit 68: Market opportunity by Type ($ billion)
            • Exhibit 69: Data Table on Market opportunity by Type ($ billion)

          8 Customer Landscape

          • 8.1 Customer landscape overview
            • Exhibit 70: Analysis of price sensitivity, lifecycle, customer purchase basket, adoption rates, and purchase criteria

          9 Geographic Landscape

          • 9.1 Geographic segmentation
            • Exhibit 71: Chart on Market share by geography 2023-2028 (%)
            • Exhibit 72: Data Table on Market share by geography 2023-2028 (%)
          • 9.2 Geographic comparison
            • Exhibit 73: Chart on Geographic comparison
            • Exhibit 74: Data Table on Geographic comparison
          • 9.3 APAC - Market size and forecast 2023-2028
            • Exhibit 75: Chart on APAC - Market size and forecast 2023-2028 ($ billion)
            • Exhibit 76: Data Table on APAC - Market size and forecast 2023-2028 ($ billion)
            • Exhibit 77: Chart on APAC - Year-over-year growth 2023-2028 (%)
            • Exhibit 78: Data Table on APAC - Year-over-year growth 2023-2028 (%)
          • 9.4 Europe - Market size and forecast 2023-2028
            • Exhibit 79: Chart on Europe - Market size and forecast 2023-2028 ($ billion)
            • Exhibit 80: Data Table on Europe - Market size and forecast 2023-2028 ($ billion)
            • Exhibit 81: Chart on Europe - Year-over-year growth 2023-2028 (%)
            • Exhibit 82: Data Table on Europe - Year-over-year growth 2023-2028 (%)
          • 9.5 North America - Market size and forecast 2023-2028
            • Exhibit 83: Chart on North America - Market size and forecast 2023-2028 ($ billion)
            • Exhibit 84: Data Table on North America - Market size and forecast 2023-2028 ($ billion)
            • Exhibit 85: Chart on North America - Year-over-year growth 2023-2028 (%)
            • Exhibit 86: Data Table on North America - Year-over-year growth 2023-2028 (%)
          • 9.6 South America - Market size and forecast 2023-2028
            • Exhibit 87: Chart on South America - Market size and forecast 2023-2028 ($ billion)
            • Exhibit 88: Data Table on South America - Market size and forecast 2023-2028 ($ billion)
            • Exhibit 89: Chart on South America - Year-over-year growth 2023-2028 (%)
            • Exhibit 90: Data Table on South America - Year-over-year growth 2023-2028 (%)
          • 9.7 Middle East and Africa - Market size and forecast 2023-2028
            • Exhibit 91: Chart on Middle East and Africa - Market size and forecast 2023-2028 ($ billion)
            • Exhibit 92: Data Table on Middle East and Africa - Market size and forecast 2023-2028 ($ billion)
            • Exhibit 93: Chart on Middle East and Africa - Year-over-year growth 2023-2028 (%)
            • Exhibit 94: Data Table on Middle East and Africa - Year-over-year growth 2023-2028 (%)
          • 9.8 China - Market size and forecast 2023-2028
            • Exhibit 95: Chart on China - Market size and forecast 2023-2028 ($ billion)
            • Exhibit 96: Data Table on China - Market size and forecast 2023-2028 ($ billion)
            • Exhibit 97: Chart on China - Year-over-year growth 2023-2028 (%)
            • Exhibit 98: Data Table on China - Year-over-year growth 2023-2028 (%)
          • 9.9 US - Market size and forecast 2023-2028
            • Exhibit 99: Chart on US - Market size and forecast 2023-2028 ($ billion)
            • Exhibit 100: Data Table on US - Market size and forecast 2023-2028 ($ billion)
            • Exhibit 101: Chart on US - Year-over-year growth 2023-2028 (%)
            • Exhibit 102: Data Table on US - Year-over-year growth 2023-2028 (%)
          • 9.10 India - Market size and forecast 2023-2028
            • Exhibit 103: Chart on India - Market size and forecast 2023-2028 ($ billion)
            • Exhibit 104: Data Table on India - Market size and forecast 2023-2028 ($ billion)
            • Exhibit 105: Chart on India - Year-over-year growth 2023-2028 (%)
            • Exhibit 106: Data Table on India - Year-over-year growth 2023-2028 (%)
          • 9.11 Germany - Market size and forecast 2023-2028
            • Exhibit 107: Chart on Germany - Market size and forecast 2023-2028 ($ billion)
            • Exhibit 108: Data Table on Germany - Market size and forecast 2023-2028 ($ billion)
            • Exhibit 109: Chart on Germany - Year-over-year growth 2023-2028 (%)
            • Exhibit 110: Data Table on Germany - Year-over-year growth 2023-2028 (%)
          • 9.12 UK - Market size and forecast 2023-2028
            • Exhibit 111: Chart on UK - Market size and forecast 2023-2028 ($ billion)
            • Exhibit 112: Data Table on UK - Market size and forecast 2023-2028 ($ billion)
            • Exhibit 113: Chart on UK - Year-over-year growth 2023-2028 (%)
            • Exhibit 114: Data Table on UK - Year-over-year growth 2023-2028 (%)
          • 9.13 Market opportunity by geography
            • Exhibit 115: Market opportunity by geography ($ billion)
            • Exhibit 116: Data Tables on Market opportunity by geography ($ billion)

          10 Drivers, Challenges, and Trends

          • 10.1 Market drivers
            • 10.2 Market challenges
              • 10.3 Impact of drivers and challenges
                • Exhibit 117: Impact of drivers and challenges in 2023 and 2028
              • 10.4 Market trends

                11 Vendor Landscape

                • 11.1 Overview
                  • 11.2 Vendor landscape
                    • Exhibit 118: Overview on Criticality of inputs and Factors of differentiation
                  • 11.3 Landscape disruption
                    • Exhibit 119: Overview on factors of disruption
                  • 11.4 Industry risks
                    • Exhibit 120: Impact of key risks on business

                  12 Vendor Analysis

                  • 12.1 Vendors covered
                    • Exhibit 121: Vendors covered
                  • 12.2 Market positioning of vendors
                    • Exhibit 122: Matrix on vendor position and classification
                  • 12.3 ABB Ltd.
                    • Exhibit 123: ABB Ltd. - Overview
                    • Exhibit 124: ABB Ltd. - Business segments
                    • Exhibit 125: ABB Ltd. - Key news
                    • Exhibit 126: ABB Ltd. - Key offerings
                    • Exhibit 127: ABB Ltd. - Segment focus
                  • 12.4 ALSTOM SA
                    • Exhibit 128: ALSTOM SA - Overview
                    • Exhibit 129: ALSTOM SA - Business segments
                    • Exhibit 130: ALSTOM SA - Key offerings
                    • Exhibit 131: ALSTOM SA - Segment focus
                  • 12.5 Bharat Heavy Electricals Ltd.
                    • Exhibit 132: Bharat Heavy Electricals Ltd. - Overview
                    • Exhibit 133: Bharat Heavy Electricals Ltd. - Business segments
                    • Exhibit 134: Bharat Heavy Electricals Ltd. - Key news
                    • Exhibit 135: Bharat Heavy Electricals Ltd. - Key offerings
                    • Exhibit 136: Bharat Heavy Electricals Ltd. - Segment focus
                  • 12.6 CG Power and Industrial Solutions Ltd.
                    • Exhibit 137: CG Power and Industrial Solutions Ltd. - Overview
                    • Exhibit 138: CG Power and Industrial Solutions Ltd. - Business segments
                    • Exhibit 139: CG Power and Industrial Solutions Ltd. - Key offerings
                    • Exhibit 140: CG Power and Industrial Solutions Ltd. - Segment focus
                  • 12.7 Eaton Corp. Plc
                    • Exhibit 141: Eaton Corp. Plc - Overview
                    • Exhibit 142: Eaton Corp. Plc - Business segments
                    • Exhibit 143: Eaton Corp. Plc - Key offerings
                    • Exhibit 144: Eaton Corp. Plc - Segment focus
                  • 12.8 Emerson Electric Co.
                    • Exhibit 145: Emerson Electric Co. - Overview
                    • Exhibit 146: Emerson Electric Co. - Business segments
                    • Exhibit 147: Emerson Electric Co. - Key news
                    • Exhibit 148: Emerson Electric Co. - Key offerings
                    • Exhibit 149: Emerson Electric Co. - Segment focus
                  • 12.9 Fuji Electric Co. Ltd.
                    • Exhibit 150: Fuji Electric Co. Ltd. - Overview
                    • Exhibit 151: Fuji Electric Co. Ltd. - Business segments
                    • Exhibit 152: Fuji Electric Co. Ltd. - Key offerings
                    • Exhibit 153: Fuji Electric Co. Ltd. - Segment focus
                  • 12.10 General Electric Co.
                    • Exhibit 154: General Electric Co. - Overview
                    • Exhibit 155: General Electric Co. - Business segments
                    • Exhibit 156: General Electric Co. - Key news
                    • Exhibit 157: General Electric Co. - Key offerings
                    • Exhibit 158: General Electric Co. - Segment focus
                  • 12.11 Hitachi Ltd.
                    • Exhibit 159: Hitachi Ltd. - Overview
                    • Exhibit 160: Hitachi Ltd. - Business segments
                    • Exhibit 161: Hitachi Ltd. - Key news
                    • Exhibit 162: Hitachi Ltd. - Key offerings
                    • Exhibit 163: Hitachi Ltd. - Segment focus
                  • 12.12 Honeywell International Inc.
                    • Exhibit 164: Honeywell International Inc. - Overview
                    • Exhibit 165: Honeywell International Inc. - Business segments
                    • Exhibit 166: Honeywell International Inc. - Key news
                    • Exhibit 167: Honeywell International Inc. - Key offerings
                    • Exhibit 168: Honeywell International Inc. - Segment focus
                  • 12.13 Mitsubishi Electric Corp.
                    • Exhibit 169: Mitsubishi Electric Corp. - Overview
                    • Exhibit 170: Mitsubishi Electric Corp. - Business segments
                    • Exhibit 171: Mitsubishi Electric Corp. - Key news
                    • Exhibit 172: Mitsubishi Electric Corp. - Key offerings
                    • Exhibit 173: Mitsubishi Electric Corp. - Segment focus
                  • 12.14 Schneider Electric SE
                    • Exhibit 174: Schneider Electric SE - Overview
                    • Exhibit 175: Schneider Electric SE - Business segments
                    • Exhibit 176: Schneider Electric SE - Key offerings
                    • Exhibit 177: Schneider Electric SE - Segment focus
                  • 12.15 Siemens AG
                    • Exhibit 178: Siemens AG - Overview
                    • Exhibit 179: Siemens AG - Business segments
                    • Exhibit 180: Siemens AG - Key news
                    • Exhibit 181: Siemens AG - Key offerings
                    • Exhibit 182: Siemens AG - Segment focus
                  • 12.16 Sumitomo Electric Industries Ltd.
                    • Exhibit 183: Sumitomo Electric Industries Ltd. - Overview
                    • Exhibit 184: Sumitomo Electric Industries Ltd. - Business segments
                    • Exhibit 185: Sumitomo Electric Industries Ltd. - Key news
                    • Exhibit 186: Sumitomo Electric Industries Ltd. - Key offerings
                    • Exhibit 187: Sumitomo Electric Industries Ltd. - Segment focus
                  • 12.17 Toshiba Corp.
                    • Exhibit 188: Toshiba Corp. - Overview
                    • Exhibit 189: Toshiba Corp. - Business segments
                    • Exhibit 190: Toshiba Corp. - Key news
                    • Exhibit 191: Toshiba Corp. - Key offerings
                    • Exhibit 192: Toshiba Corp. - Segment focus

                  13 Appendix

                  • 13.1 Scope of the report
                    • 13.2 Inclusions and exclusions checklist
                      • Exhibit 193: Inclusions checklist
                      • Exhibit 194: Exclusions checklist
                    • 13.3 Currency conversion rates for US$
                      • Exhibit 195: Currency conversion rates for US$
                    • 13.4 Research methodology
                      • Exhibit 196: Research methodology
                      • Exhibit 197: Validation techniques employed for market sizing
                      • Exhibit 198: Information sources
                    • 13.5 List of abbreviations
                      • Exhibit 199: List of abbreviations

                    Research Methodology

                    Technavio presents a detailed picture of the market by way of study, synthesis, and summation of data from multiple sources. The analysts have presented the various facets of the market with a particular focus on identifying the key industry influencers. The data thus presented is comprehensive, reliable, and the result of extensive research, both primary and secondary.

                    INFORMATION SOURCES

                    Primary sources

                    • Manufacturers and suppliers
                    • Channel partners
                    • Industry experts
                    • Strategic decision makers

                    Secondary sources

                    • Industry journals and periodicals
                    • Government data
                    • Financial reports of key industry players
                    • Historical data
                    • Press releases

                    DATA ANALYSIS

                    Data Synthesis

                    • Collation of data
                    • Estimation of key figures
                    • Analysis of derived insights

                    Data Validation

                    • Triangulation with data models
                    • Reference against proprietary databases
                    • Corroboration with industry experts

                    REPORT WRITING

                    Qualitative

                    • Market drivers
                    • Market challenges
                    • Market trends
                    • Five forces analysis

                    Quantitative

                    • Market size and forecast
                    • Market segmentation
                    • Geographical insights
                    • Competitive landscape

                    Interested in this report?

                    Get your sample now to see our research methodology and insights!

                    Download Now

                    Frequently Asked Questions

                    High Voltage Equipment market growth will increase by $ 50.38 bn during 2024-2028.

                    The High Voltage Equipment market is expected to grow at a CAGR of 7.45% during 2024-2028.

                    High Voltage Equipment market is segmented by Application( Power transmission, Power distribution) Type( Transformer, Switchgear, Reactive power equipment, Relay panel, Others)

                    ABB Ltd., ALSTOM SA, Bharat Heavy Electricals Ltd., CG Power and Industrial Solutions Ltd., DuPont de Nemours Inc., Eaton Corp. Plc, Emerson Electric Co., ETEL TRANSFORMERS PTY LTD., Fuji Electric Co. Ltd., General Electric Co., Hitachi Ltd., Honeywell International Inc., Hubbell Inc., Hyundai Electric and Energy Systems Co. Ltd., Mitsubishi Electric Corp., Schneider Electric SE, Siemens AG, Sumitomo Electric Industries Ltd., TBEA Co. Ltd., Toshiba Corp. are a few of the key vendors in the High Voltage Equipment market.

                    APAC will register the highest growth rate of 49% among the other regions. Therefore, the High Voltage Equipment market in APAC is expected to garner significant business opportunities for the vendors during the forecast period.

                    US, China, India, Germany, UK

                    • Rising requirements for power from residential is the driving factor this market.
                    • industrial is the driving factor this market.
                    • and commercial sectorsThe rising demand for power is the driving factor this market.
                    • coupled with an increasing global population is the driving factor this market.
                    • has raised the need for high-voltage equipment such as transformers and switchgear. Similarly is the driving factor this market.
                    • rapid industrial growth in emerging economies such as China is the driving factor this market.
                    • India is the driving factor this market.
                    • Indonesia is the driving factor this market.
                    • Malaysia is the driving factor this market.
                    • Vietnam is the driving factor this market.
                    • Brazil is the driving factor this market.
                    • Argentina is the driving factor this market.
                    • Nigeria is the driving factor this market.
                    • and Ethiopia has spiked demand for power from the industrial and commercial sectors. High-voltage equipment such as transformers are likely to find high adoption in these countries. The growth in per capita income has resulted in the extensive use of electrical and electronic equipment in these emerging economies is the driving factor this market.
                    • thereby enhancing the demand for power. Developing countries is the driving factor this market.
                    • particularly in Asia and Africa is the driving factor this market.
                    • have poor distribution networks that are susceptible to frequent power outages and losses. Therefore is the driving factor this market.
                    • these countries are expanding and upgrading their power distribution infrastructure in rural and remote areas to address the rising demand for energy. A major chunk of the demand for distribution transformers from North America and Europe comes from the industrial and commercial sectors is the driving factor this market.
                    • where digitization and automation have led to the widespread use of equipment that works on power. According to the US Energy Information Administration (EIA) is the driving factor this market.
                    • Organization for Economic Co-operation and Development (OECD) countries will be the biggest contributors to this growth is the driving factor this market.
                    • with an increase of more than 48% in energy consumption between 2012 and 2040. Asia will contribute to more than half of this growth in countries that do not comprise OECD countries. Therefore is the driving factor this market.
                    • the rising demand for power in different end-user sectors is expected to continue to be the major driver for the growth of the global high voltage equipment market during the forecast period. is the driving factor this market.

                    The High Voltage Equipment market vendors should focus on grabbing business opportunities from the Power transmission segment as it accounted for the largest market share in the base year.